Running Cohort Queries from Workstations
This guide will walk you through setting up your JupyterLab environment and running queries against your approved cohort tables using Amazon Athena.
Dataset Note: The code examples in this guide use
mimic_fulldatasetas the cohort name for illustration purposes. Replace it with the name of your own approved cohort database before running any queries.
On Quark, researchers can query OMOP-standardised tables from workstations. The following section provides a brief background about the OMOP Common Data Model.
About the OMOP Common Data Model
Cohort data in Quark TRE is structured according to the OMOP Common Data Model (CDM) — an open community standard designed to standardise the structure and content of observational health data, enabling reliable, reproducible analyses across institutions.
Key OMOP tables you will query include person, condition_occurrence, drug_exposure, visit_occurrence, death, and observation_period. Each table is available as a named database in Amazon Athena, scoped to your approved cohort.
Dataset Schema
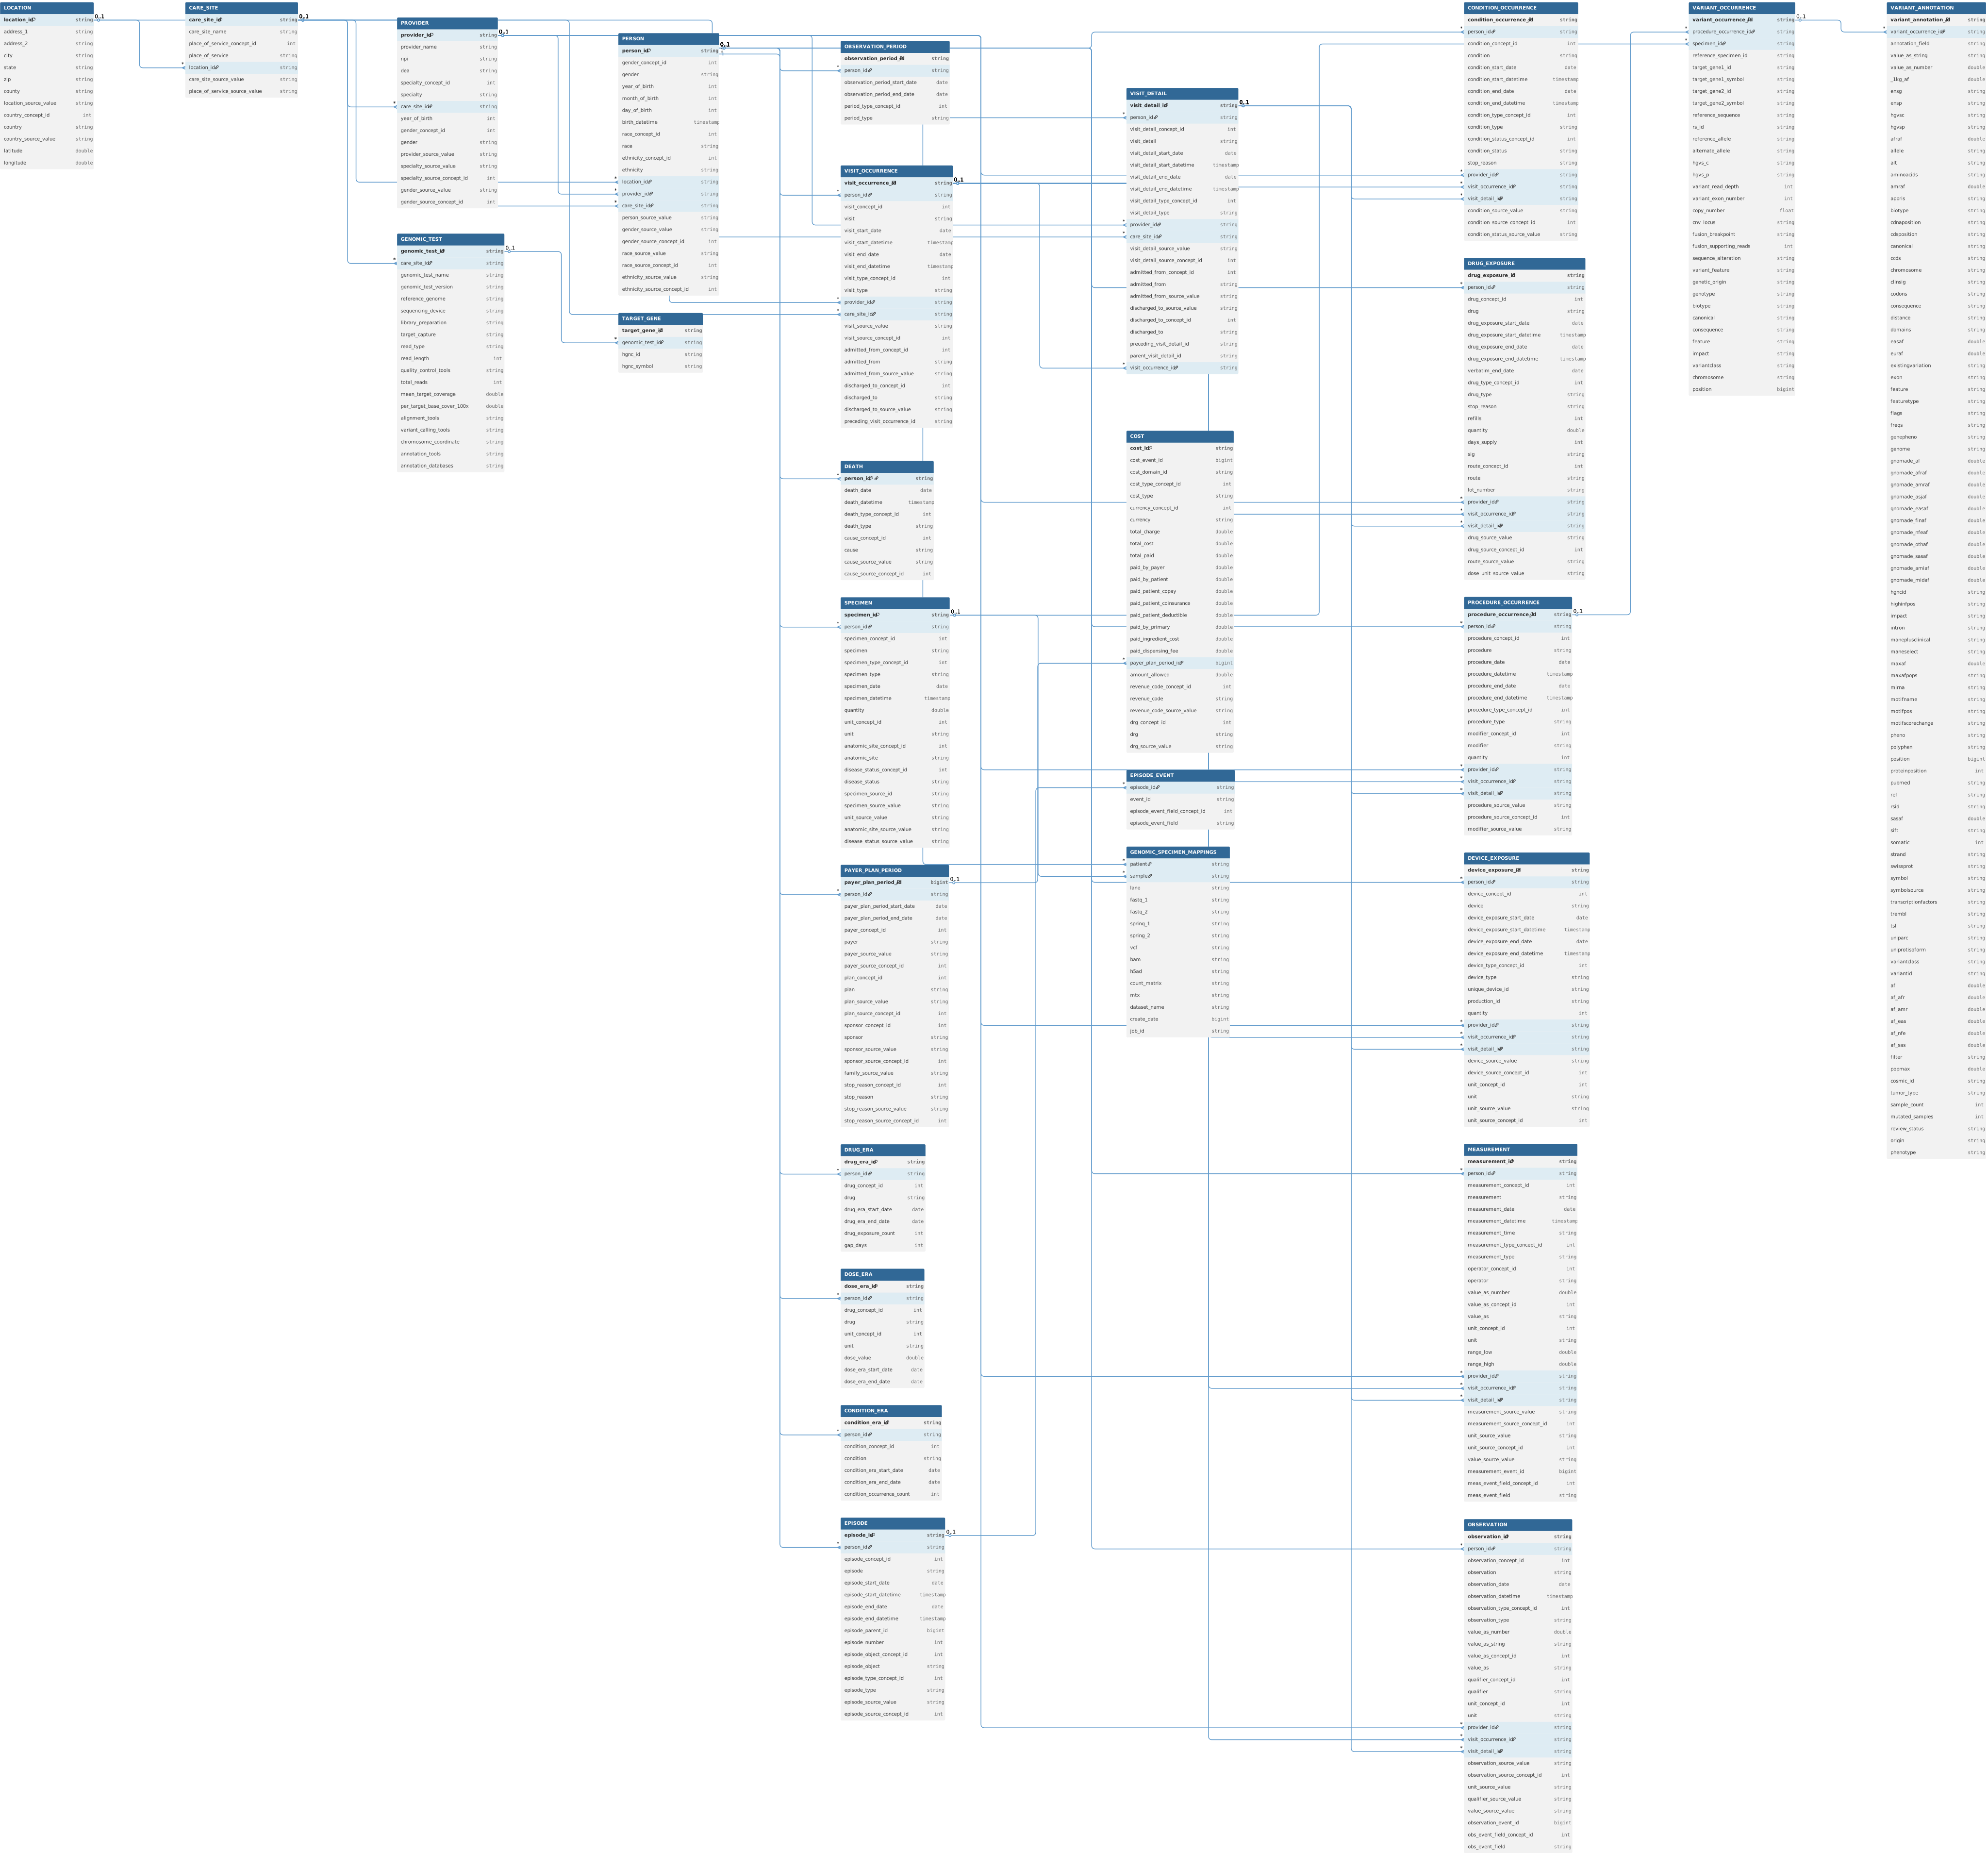
The entity-relationship diagram below shows the full table schema used in this cohort dataset, including all primary and foreign key relationships between OMOP tables. Use this as a reference when writing JOINs or exploring how tables like person, visit_occurrence, and condition_occurrence relate to one another.
Note: The schema diagram is best viewed by opening it in a new browser tab (right-click → Open image in new tab), where you can zoom and pan freely.
Standardised Vocabularies
The OMOP CDM uses a set of standardised vocabularies to represent clinical concepts consistently across domains. Each domain (Condition, Drug, Procedure, Measurement, etc.) maps source codes to a preferred standard vocabulary — for example, SNOMED for conditions, RxNorm for drugs, and LOINC for measurements — while retaining the original source codes for traceability. The table below summarises which vocabularies are used for standard, source, and classification concepts in each domain.
| Domain | Standard Concepts | Source Concepts | Classification Concepts |
|---|---|---|---|
| Condition | SNOMED, ICDO3 | SNOMED Veterinary | MedDRA |
| Procedure | SNOMED, CPT4, HCPCS, ICD10PCS, ICD9Proc, OPCS4 | SNOMED Veterinary, HemOnc, NAACCR | None at this point |
| Measurement | SNOMED, LOINC | SNOMED Veterinary, NAACCR, CPT4, HCPCS, OPCS4, PPI | None at this point |
| Drug | RxNorm, RxNorm Extension, CVX | HCPCS, CPT4, HemOnc, NAACCR | ATC |
| Device | SNOMED | Others, currently not normalized | None at this point |
| Observation | SNOMED | Others | None at this point |
| Visit | CMS Place of Service, ABMT, NUCC | SNOMED, HCPCS, CPT4, UB04 | None at this point |
For a deeper understanding of how vocabularies, concepts, and mappings work together, refer to the Standardised Vocabularies chapter in The Book of OHDSI. For detailed field-level documentation of each OMOP table — including which fields are required, their data types, and what each column represents — see the CDM v5.4 specification.
Running Cohort Queries from Workstations
Pre-requisites
- For running cohort queries, ensure you have access to an approved cohort (Login to Quark TRE → Navigate to Datasets → Click the Cohorts tab → the Cohort dashboard should show your Approved cohorts). If you do not have access to an approved cohort, follow this guide on Requesting Dataset Access.
- Ensure you have created, connected, launched and logged in to your Ubuntu or Windows workstation, as shown in the Workstation Overview.
Section 1 — Setup and Installation
Note: This section must be run once per workstation session. No user inputs are required.
This block installs the required Python libraries, configures the AWS connection variables from the workstation's environment, verifies the active AWS identity, and defines the Athena helper functions used throughout the notebook.
Installing Dependencies
Install boto3 (AWS SDK for Python) and pandas. The install command differs by operating system:
Ubuntu / macOS:
!pip install boto3
!pip install pandas
Windows:
import sys
!{sys.executable} -m pip install boto3 pandas
AWS Configuration and Athena Helpers
The following code is identical across all platforms. Paste it into a cell after the install block and run it once.
import os
import time
import boto3
import pandas as pd
from datetime import datetime

# Setting up AWS configuration variables
# These are pre-populated from the workstation's environment — no manual input required
AWS_REGION   = os.getenv("AWS_REGION")      # Region where the AWS service is running
OMOP_CATALOG = os.getenv("OMOP_CATALOG")    # Athena catalog where OMOP tables exist
WORKGROUP    = os.getenv("OMOP_WORKGROUP")  # Athena workgroup — governs query permissions
                                            # and acts as a governance layer between Athena
                                            # and this notebook

# Verifying the active AWS identity
# Confirms which AWS Account, Role, and User identity this session is using
sts      = boto3.client("sts")
identity = sts.get_caller_identity()

# ──── Athena Helper Functions ────────────────────────────────────────────────

def start_query(athena, query, catalog, database):
    """Submit a query to Athena and return its execution ID."""
    response = athena.start_query_execution(
        QueryString=query,
        QueryExecutionContext={"Database": database, "Catalog": catalog},
        WorkGroup=WORKGROUP,
    )
    return response["QueryExecutionId"]


def wait_for_query(athena, execution_id):
    """Poll Athena until the query reaches a terminal state. Returns the final status string."""
    while True:
        response = athena.get_query_execution(QueryExecutionId=execution_id)
        state    = response["QueryExecution"]["Status"]["State"]
        if state == "FAILED":
            reason = response["QueryExecution"]["Status"].get("StateChangeReason", "unknown")
            raise RuntimeError(f"Query failed: {reason}")
        if state == "CANCELLED":
            raise RuntimeError("Query was cancelled.")
        if state == "SUCCEEDED":
            return state
        time.sleep(1)


def fetch_results(athena, execution_id):
    """Retrieve all paginated results from a completed Athena query and return a DataFrame."""
    response = athena.get_query_results(QueryExecutionId=execution_id)
    columns  = [col["Name"] for col in response["ResultSet"]["ResultSetMetadata"]["ColumnInfo"]]

    def parse_rows(rows):
        return [[field.get("VarCharValue", "") for field in row["Data"]] for row in rows]

    rows = parse_rows(response["ResultSet"]["Rows"][1:])  # Skip header row
    while "NextToken" in response:
        response = athena.get_query_results(
            QueryExecutionId=execution_id,
            NextToken=response["NextToken"],
        )
        rows.extend(parse_rows(response["ResultSet"]["Rows"]))
    return pd.DataFrame(rows, columns=columns)


def run_query(query, database, catalog=OMOP_CATALOG):
    """Execute an Athena query and return results as a pandas DataFrame."""
    athena       = boto3.client("athena", region_name=AWS_REGION)
    execution_id = start_query(athena, query, catalog, database)
    wait_for_query(athena, execution_id)
    df = fetch_results(athena, execution_id)
    print(f"\nReturned {len(df)} rows × {len(df.columns)} columns")
    return df
What this block does:
- Reads three environment variables that are automatically injected into the workstation session:
AWS_REGION,OMOP_CATALOG, andOMOP_WORKGROUP. These do not need to be set manually. - Calls
sts.get_caller_identity()to confirm which AWS role the session is operating under — useful for troubleshooting access issues. - Defines three internal helper functions (
start_query,wait_for_query,fetch_results) and one public function (run_query) that you will use throughout the notebook to execute SQL queries and retrieve results as DataFrames.
Section 2 — Querying Your Cohort
Note: Querying your cohort requires two user inputs before running: your Cohort Name and the SQL query you wish to execute.
Run queries by setting COHORT_NAME in the following code-chunk to the exact dataset name of your approved cohort (e.g., mimic_fulldataset).
Example Query 1 — Querying the Person Table
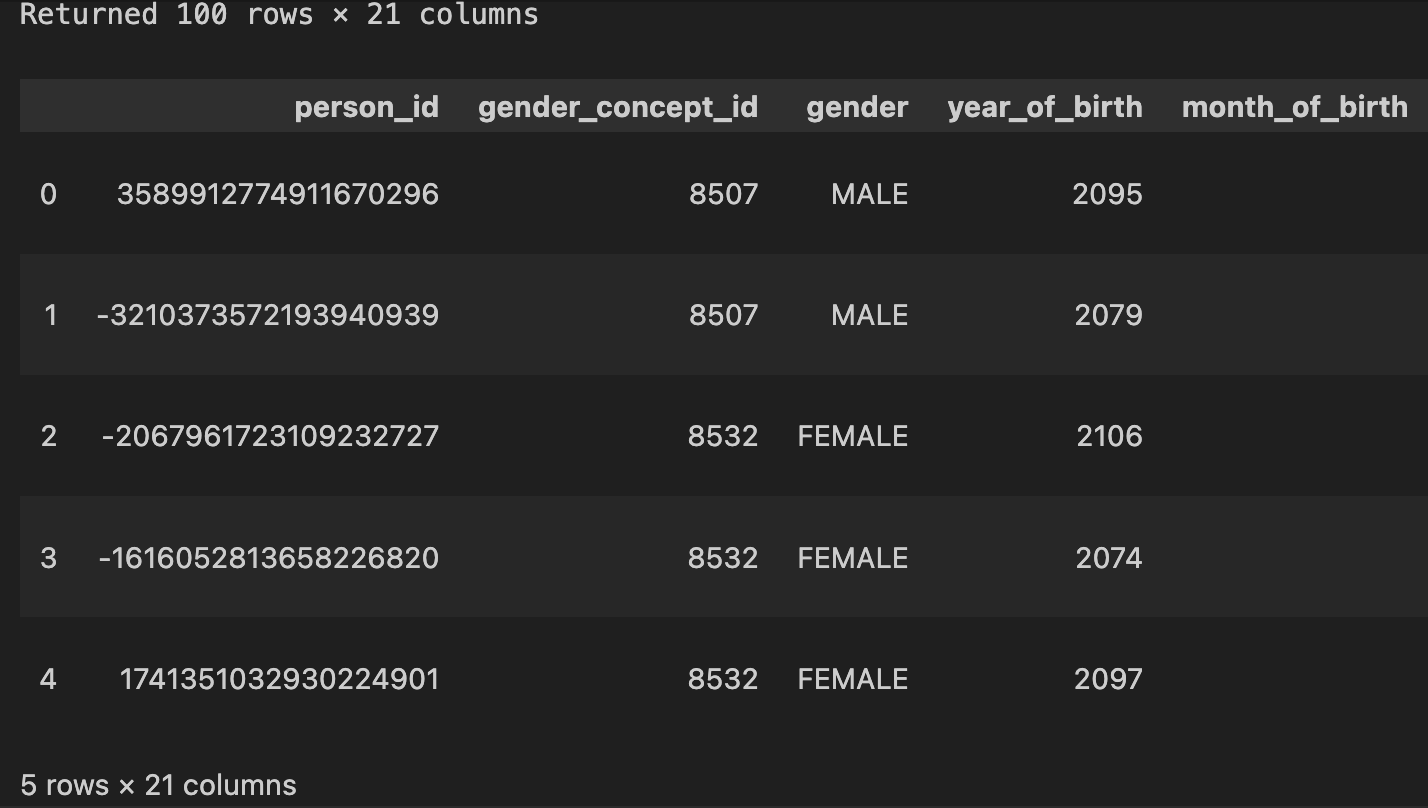
The person table contains one row per patient and includes demographic fields such as gender, year of birth, race, and ethnicity.
# ──── Update COHORT_NAME and QUERY below, then run this cell ─────────

# Replace with your approved cohort database name
COHORT_NAME = "mimic_fulldataset"

QUERY = """
SELECT * FROM person
"""

person = run_query(QUERY, database=COHORT_NAME)

person.head(5)
Example Query 2 — Querying the Condition Occurrence Table
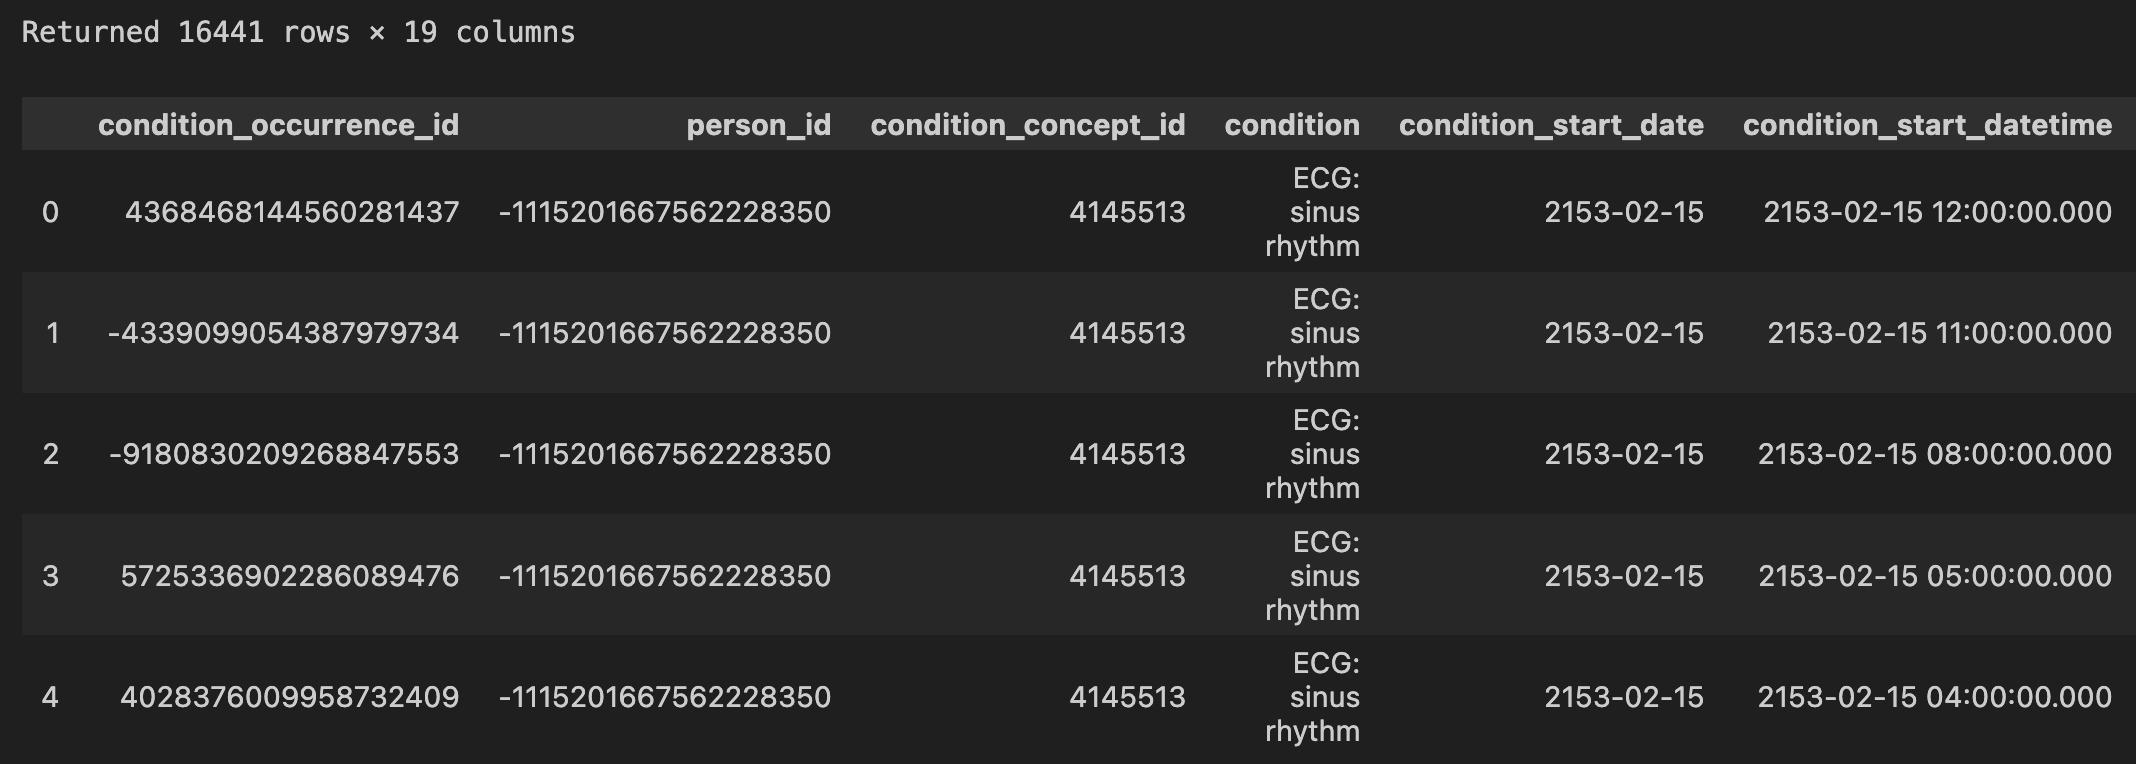
The condition_occurrence table records all clinical conditions associated with each patient, including condition name, start and end dates, and the source visit.
# ──── Update COHORT_NAME and QUERY below, then run this cell ─────────

# Replace with your approved cohort database name
COHORT_NAME = "mimic_fulldataset"

QUERY = """
SELECT * FROM condition_occurrence
"""

conditions = run_query(QUERY, database=COHORT_NAME)

conditions.head(5)
Writing Custom Queries
You can write any valid SQL query against any OMOP table in your cohort database. Common tables available in the OMOP CDM include:
| Table | Description |
|---|---|
person |
One row per patient; demographics (gender, year of birth, race, ethnicity) |
condition_occurrence |
Clinical conditions recorded per patient visit |
drug_exposure |
Medication administration records |
visit_occurrence |
Hospital and outpatient visit records |
death |
Date and cause of death if present in patient records |
observation_period |
The time span over which a patient's data is available |
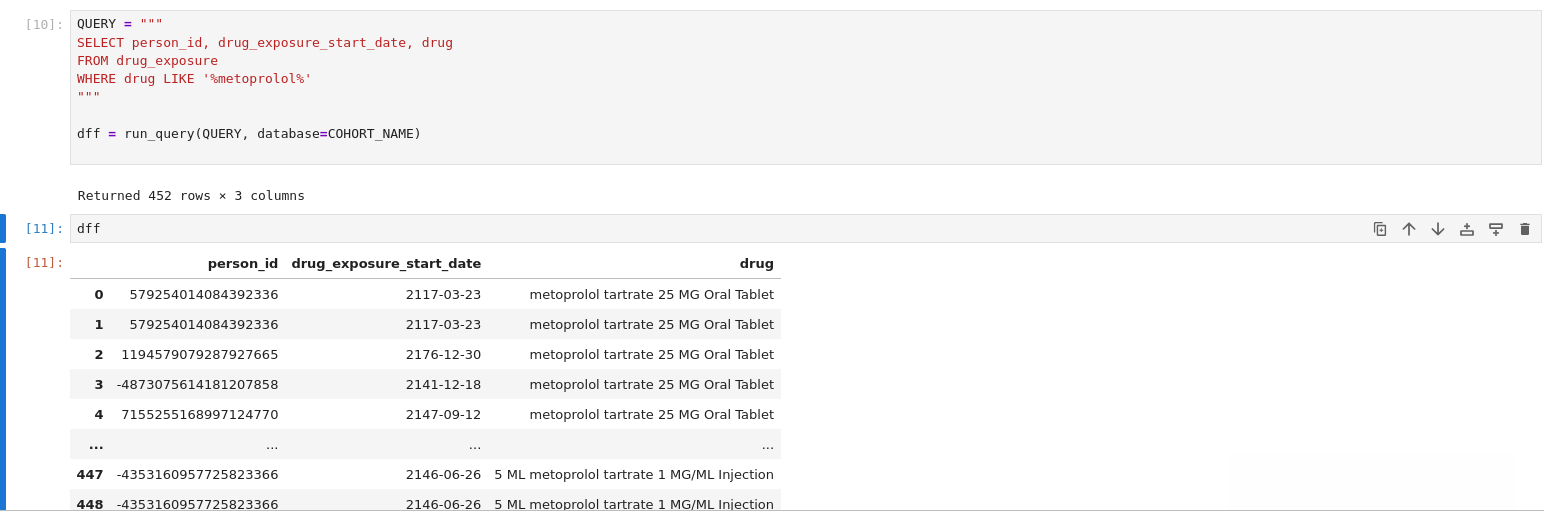
To query any of these tables, update the QUERY variable with your SQL and run the cell:
COHORT_NAME = "mimic_fulldataset"

QUERY = """
SELECT person_id, drug_exposure_start_date, drug
FROM drug_exposure
WHERE drug LIKE '%metoprolol%'
"""

drug_results = run_query(QUERY, database=COHORT_NAME)
drug_results.head(10)
Optional - Visualise Your Results
Install Visualisation Libraries
The install command differs by operating system:
Ubuntu / macOS:
!pip install matplotlib
Windows:
!{sys.executable} -m pip install matplotlib
Plotting and Saving Results
The plotting code is the same across platforms. The only difference is the file save path.
import pandas as pd
import matplotlib.pyplot as plt

# Query the person table
QUERY_person = """ SELECT * FROM person """
person = run_query(QUERY_person, database=COHORT_NAME)

# Plot gender distribution
person.gender.value_counts().plot(kind="bar")
plt.xticks(rotation=45, fontsize=8)
When saving the plot to disk, use the path format for your operating system:
Ubuntu / macOS:
plt.savefig("/home/ubuntu/Desktop/gender_profile.png", dpi=300)
Windows:
plt.savefig("C:\\Users\\wsadmin\\Desktop\\gender_profile.png", dpi=300)
What's Next
- Download your plots and results — See Downloading Data Results for the file download workflow from the Results tab.
- Run further exploratory data analysis — See a tutorial on Cohort Analysis via Ubuntu Workstations to learn how to perform cohort profiling, condition analysis, drug exposure comparison, and survival analysis on top of the data you have queried here.