Platform Cost
Overview
The Cost section gives you a consolidated, real-time, platform-wide view of budget allocation and resource expenditure — across all groups, projects, teams, and users, not just a single project. This is the broader counterpart to Project Cost, which admins use to monitor spend within their own project.
Cost provides a monitoring station. Budget policies and spending caps are configured separately under Budget.
Navigation: Select Cost from the left-hand navigation pane.
The Cost Dashboard
When you open Cost, the dashboard displays two headline figures at the top of the screen:
| Field | Description |
|---|---|
| Total Budget Available | The total budget allocated to the platform for the current period, shown alongside its allocation type (e.g., Annually 2026). |
| Total Budget Used | The cumulative spend to date, with the percentage utilised and the remaining balance displayed alongside. |
These figures update in real time as resources are consumed. The donut chart shows the proportion of the total budget that has been used against what remains available. The horizontal bar chart breaks spend down by group (organisational unit), with each bar split into Used (darker fill) and Remaining (lighter fill) segments.
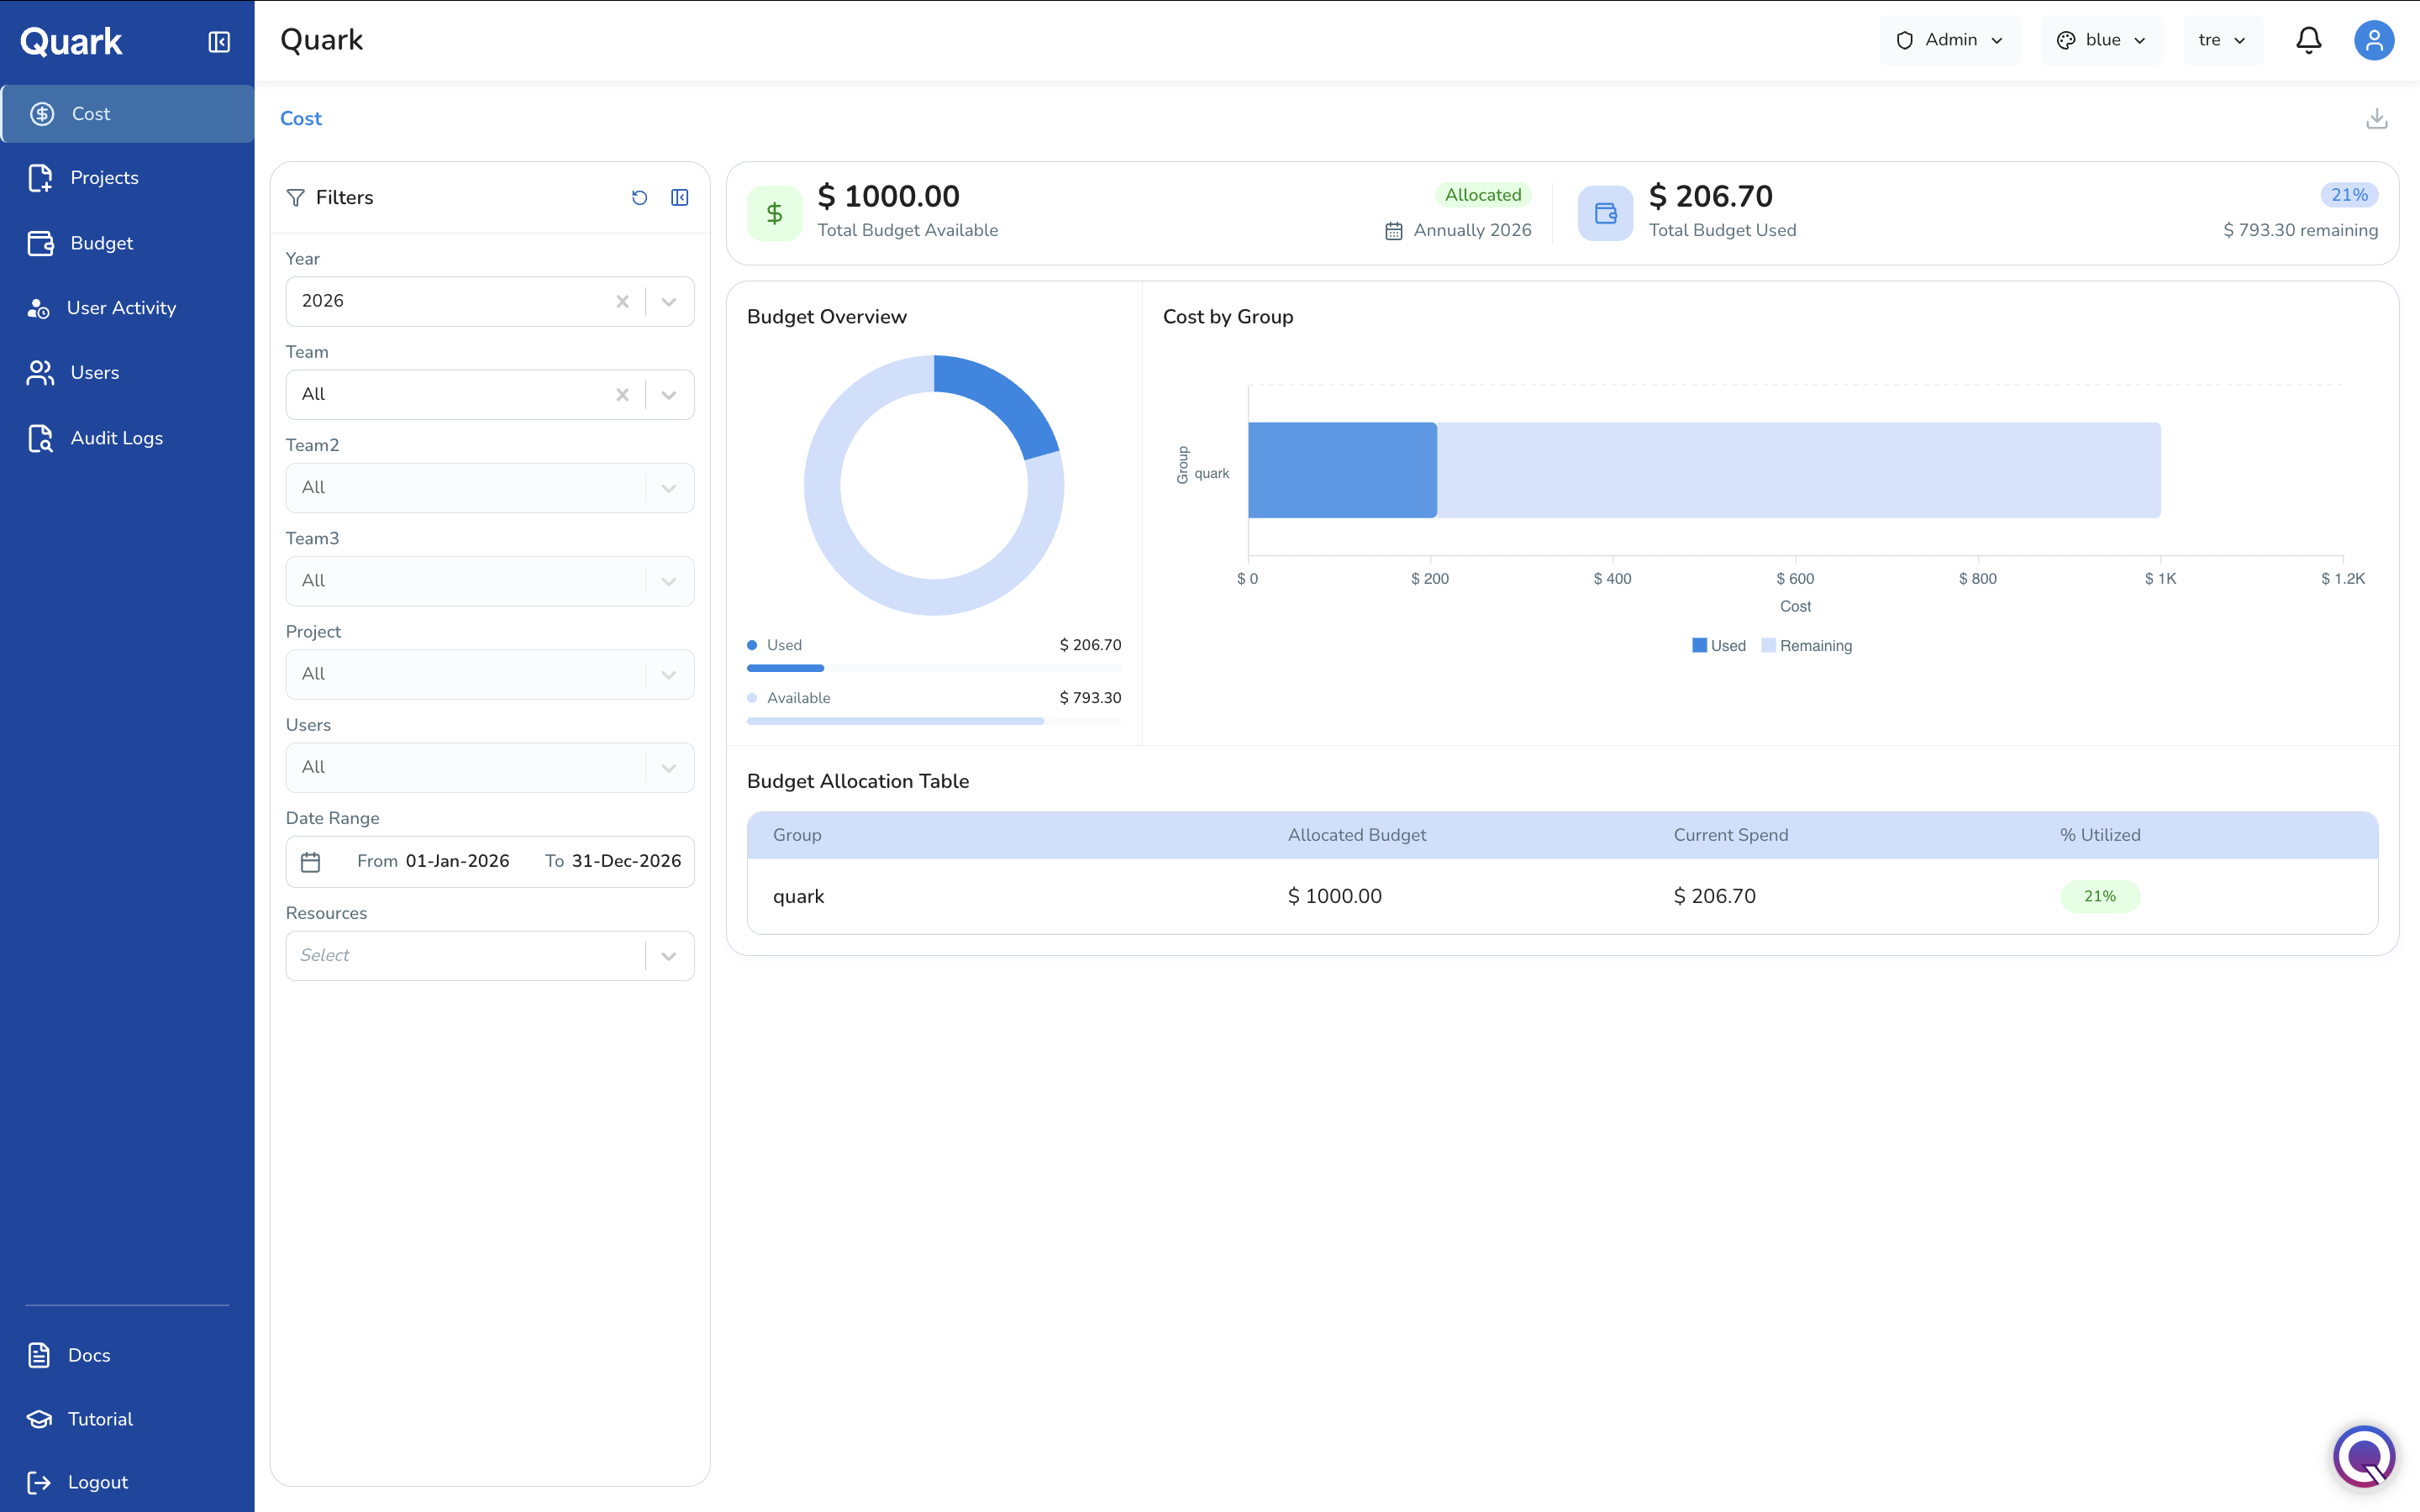
Budget Allocation Table
Below the charts, the Budget Allocation Table provides a row-by-row breakdown of spend by group:
| Column | Description |
|---|---|
| Group | The organisational group or unit. |
| Allocated Budget | The total budget assigned to this group for the selected period. |
| Current Spend | The amount consumed to date within the filtered period. |
| % Utilized | Current spend as a percentage of the allocated budget, shown as a colour-coded badge. |
The percentage badge provides a quick visual signal: low utilisation appears in a neutral colour; high utilisation closer to the budget cap is highlighted to draw attention.
Filtering the Cost View
The left-hand filter panel lets you drill into expenditure at different levels of granularity. Filters are additive — apply multiple together to narrow the view precisely:
- Filter by Year
- Filter by Team: three team filter levels (Team, Team2, Team3) allow you to reflect your organisation's hierarchy — for example, a division, a department within it, and a sub-team within that.
- Filter by Project
- Filter by Users
- Filter by Date Range: the default range spans the full selected year; narrow it to a month, quarter, or any custom window to align with your reporting cycle.
- Filter by Resources: break down costs by resource type (Pipelines, Workstations, Workspaces, Apps).
Exporting Cost Data
Use the download icon in the top-right corner of the Cost screen to export the current view as a report. The export reflects whatever filters are currently active.
What's Next
- Budget — if the Cost view reveals a group approaching its cap, review and adjust budget policies here.
- User Activity — cross-reference cost trends with user activity to identify which users or pipeline runs are driving spend.
- Platform Audit Logs — for unexpected cost spikes, correlate the relevant date range in the audit log to trace the specific actions responsible.