Clusters
Overview
The Clusters section is where the Infrastructure Administrator creates and manages the Kubernetes clusters that underpin every workload on the platform, configures observability stacks to monitor them, installs add-ons that extend their capabilities, and provisions the load balancers that route traffic to platform services.
The Clusters section is organised into four tabs: Clusters, Observability, Addons, and Load Balancers. Each tab has its own list view and creation flow, but they are all interconnected — a load balancer runs on a cluster, an observability stack monitors a cluster's node pool, and an add-on extends a cluster's storage or scheduling capabilities.
Navigation: Select Clusters from the left-hand navigation pane. The section expands to show Clusters, Observability, Addons, and Load Balancers as sub-items.
Clusters Tab
The Clusters Page
The Clusters tab lists all Kubernetes clusters registered on the platform. Each row shows:
| Column | Description |
|---|---|
| Name | The unique name of the cluster. |
| Status | Whether the cluster is Available or in an error state. |
| Sync | The result of the last synchronisation with the cluster — Success or a failure state. |
| Tags | The cluster engine type (e.g., EKS, GKE). |
| Version | The Kubernetes version the cluster is running. |
| Region | The cloud region in which the cluster is deployed. |
| Created At | The date and time the cluster was registered. |
| Created By | The user who created or imported the cluster. |
| Last Updated At | The date and time the cluster was most recently modified. |
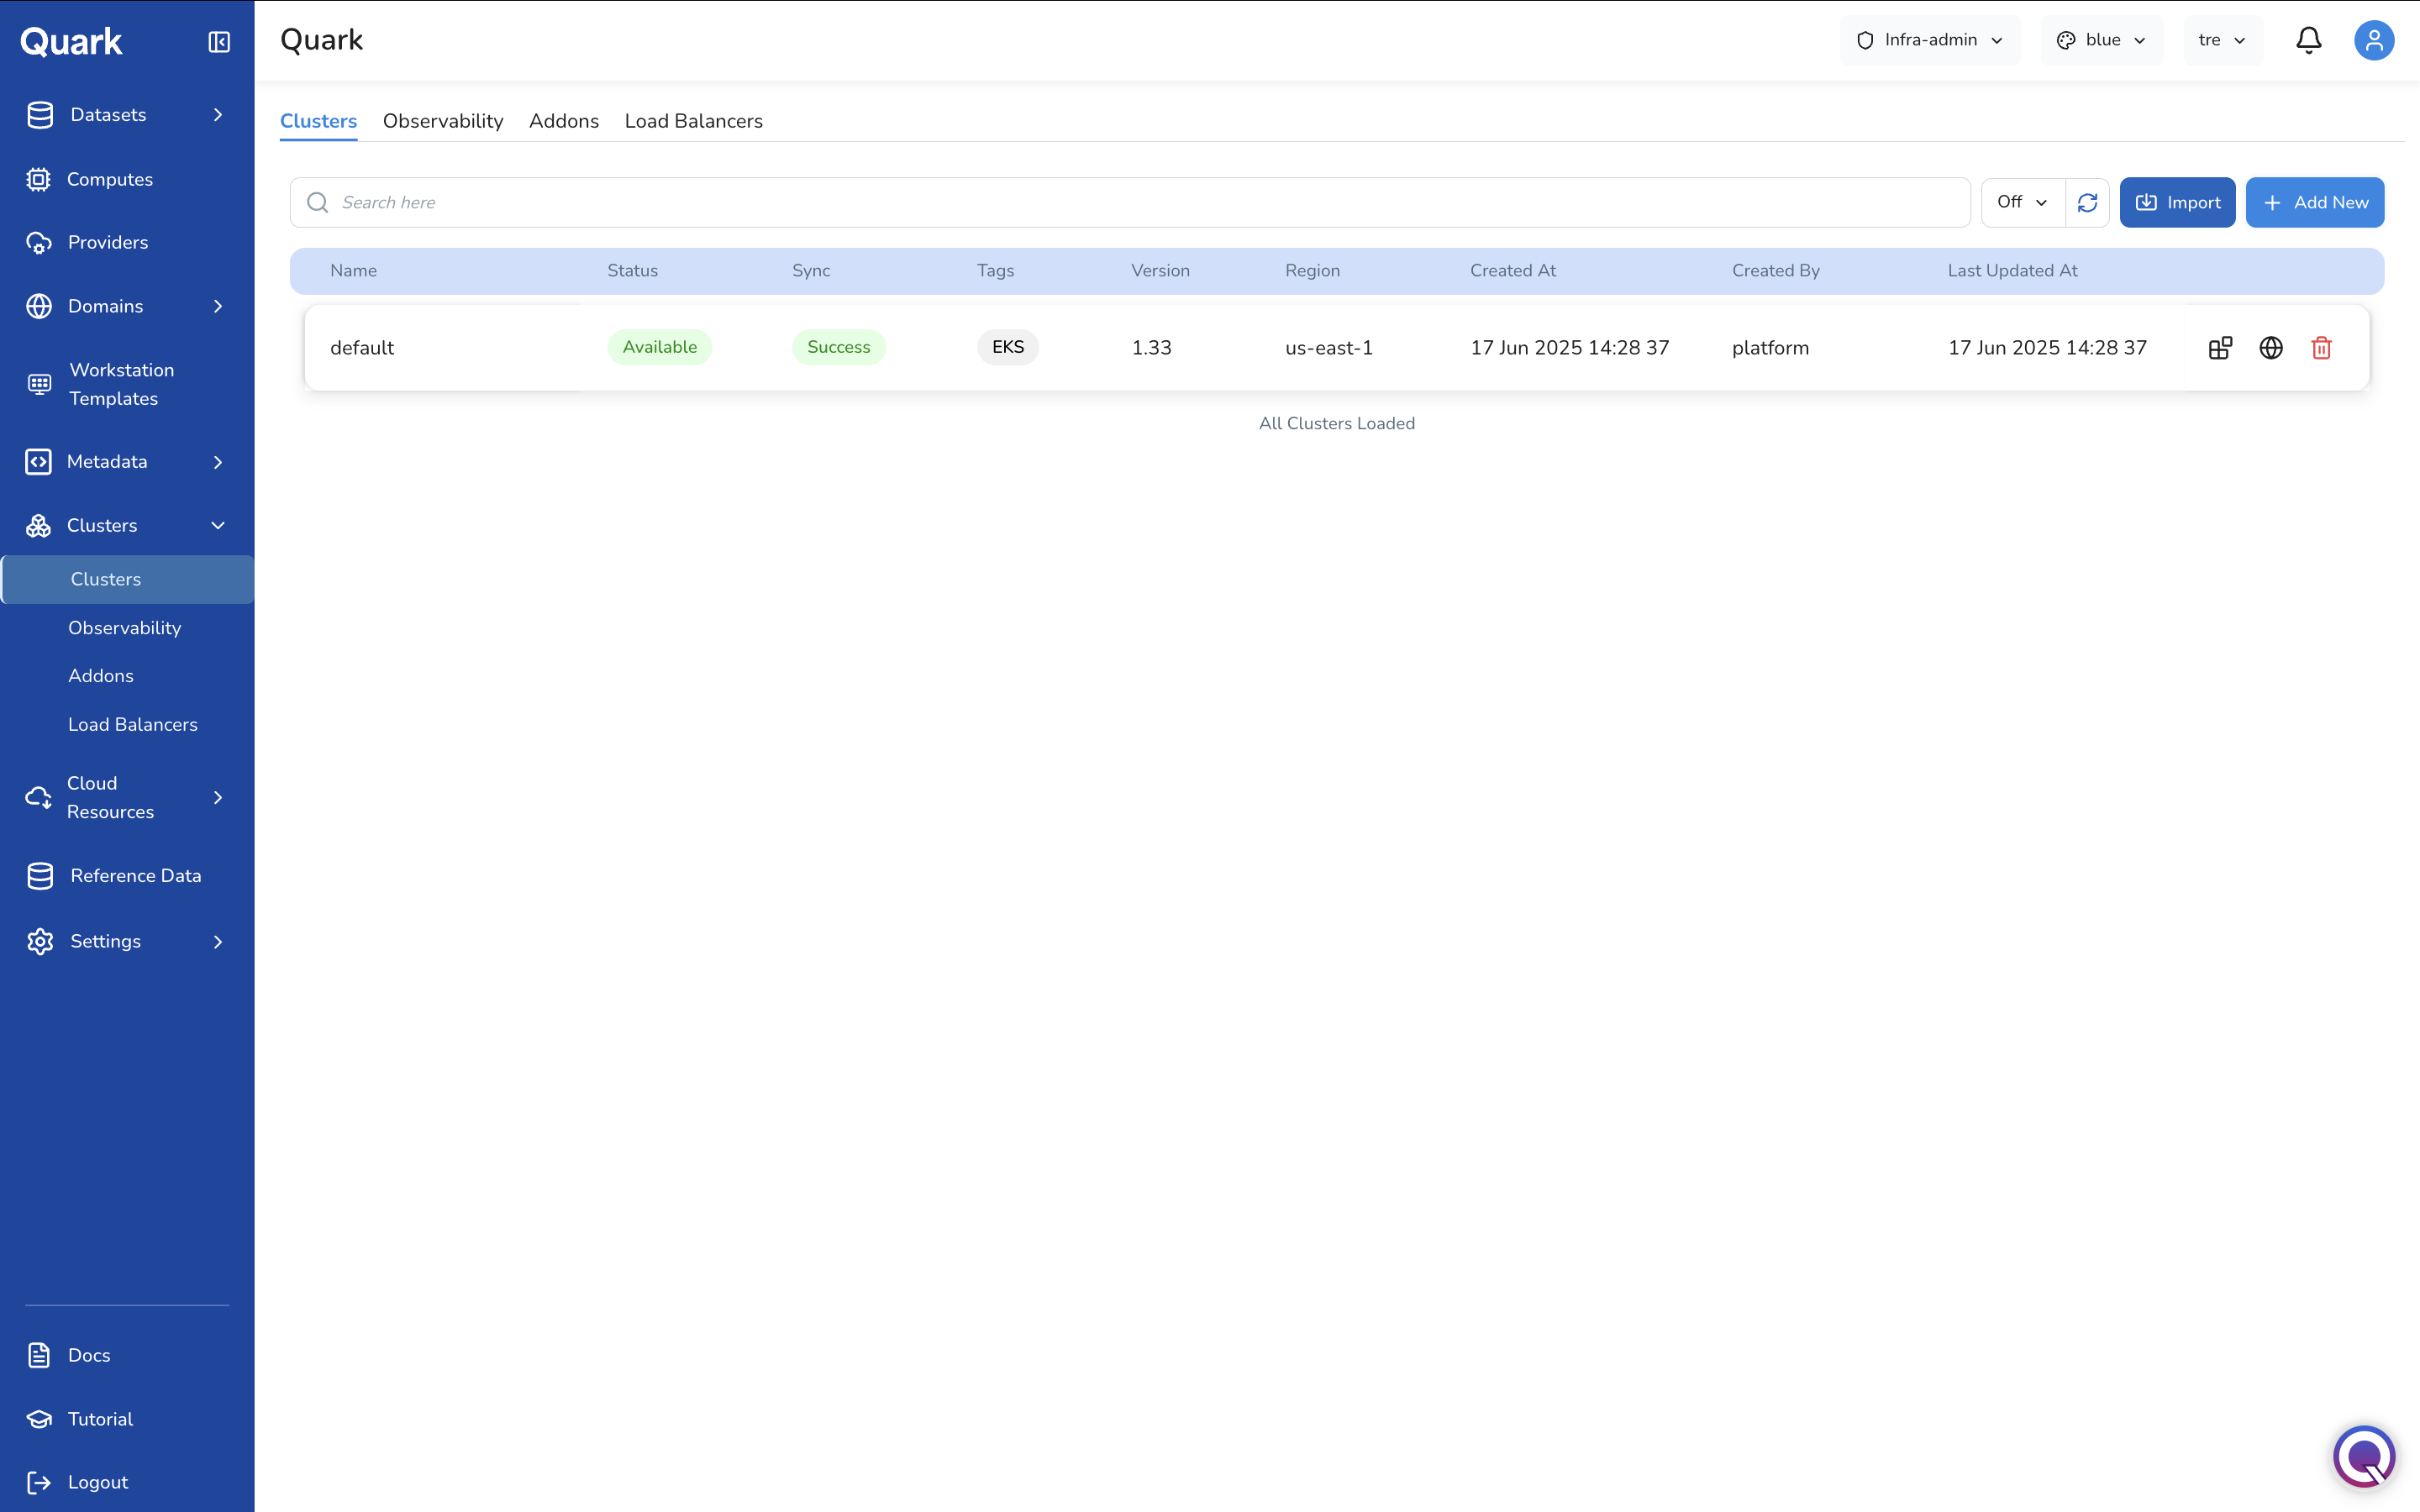
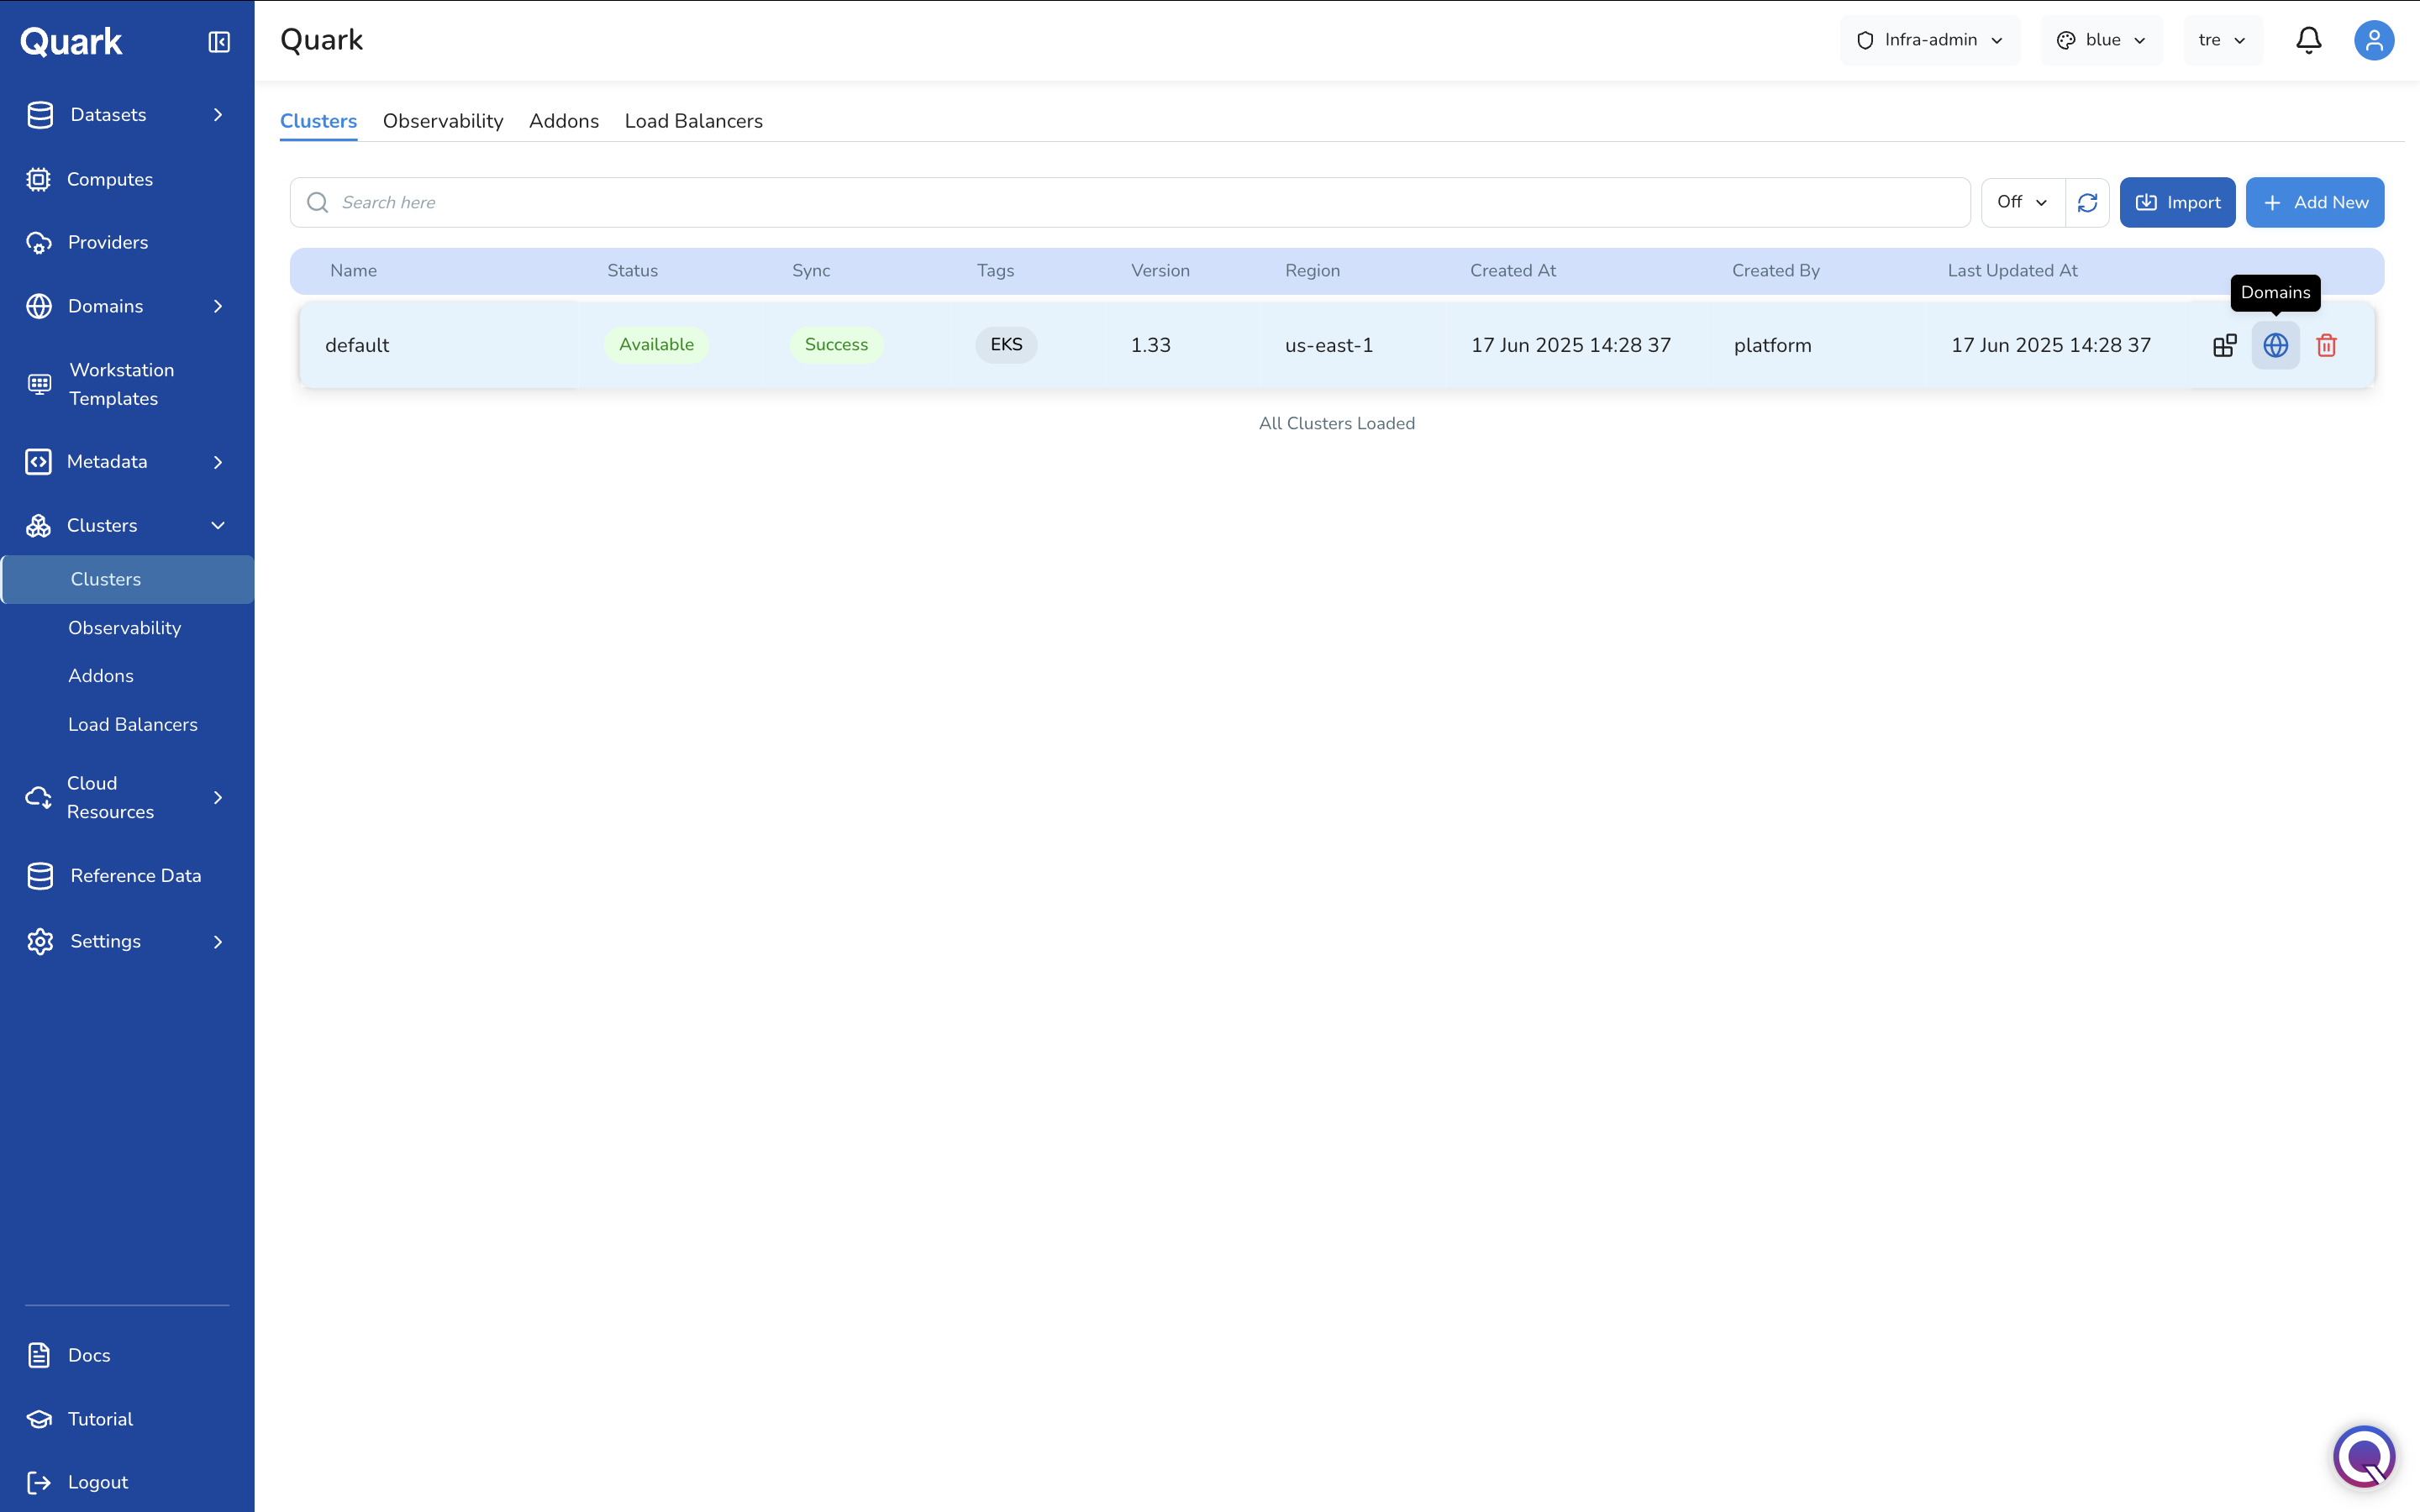
Each cluster row has three action icons on the right:
| Icon | Action |
|---|---|
| Node Pools (grid icon) | Opens a side panel showing the active node pools on this cluster. From this panel, the Infrastructure Administrator can also add a new node pool to the cluster without leaving the Clusters list. |
| Domains (globe icon) | Opens a domains panel for this cluster, showing all domains associated with it. Provides an option to add a new domain directly from this panel. |
| Delete (red trash icon) | Removes the cluster from the platform. |
Import vs Add New
The Clusters tab offers two ways to register a cluster:
- Import — Connects an existing Kubernetes cluster that is already running in a cloud provider. Quark reads the cluster's existing configuration and registers it for platform use. Use this when the cluster infrastructure has been provisioned outside the platform.
- Add New — Provisions a brand new cluster through the platform. Select from EKS (Amazon Elastic Kubernetes Service), GKE (Google Kubernetes Engine), or Custom (a self-managed cluster). Use this when you need the platform to create and own the cluster lifecycle.
Importing a Cluster
- Click Import in the toolbar.
- The Import Cluster wizard opens with five steps: General → Nodepool → Domain → Settings → Review.
Step 1: General
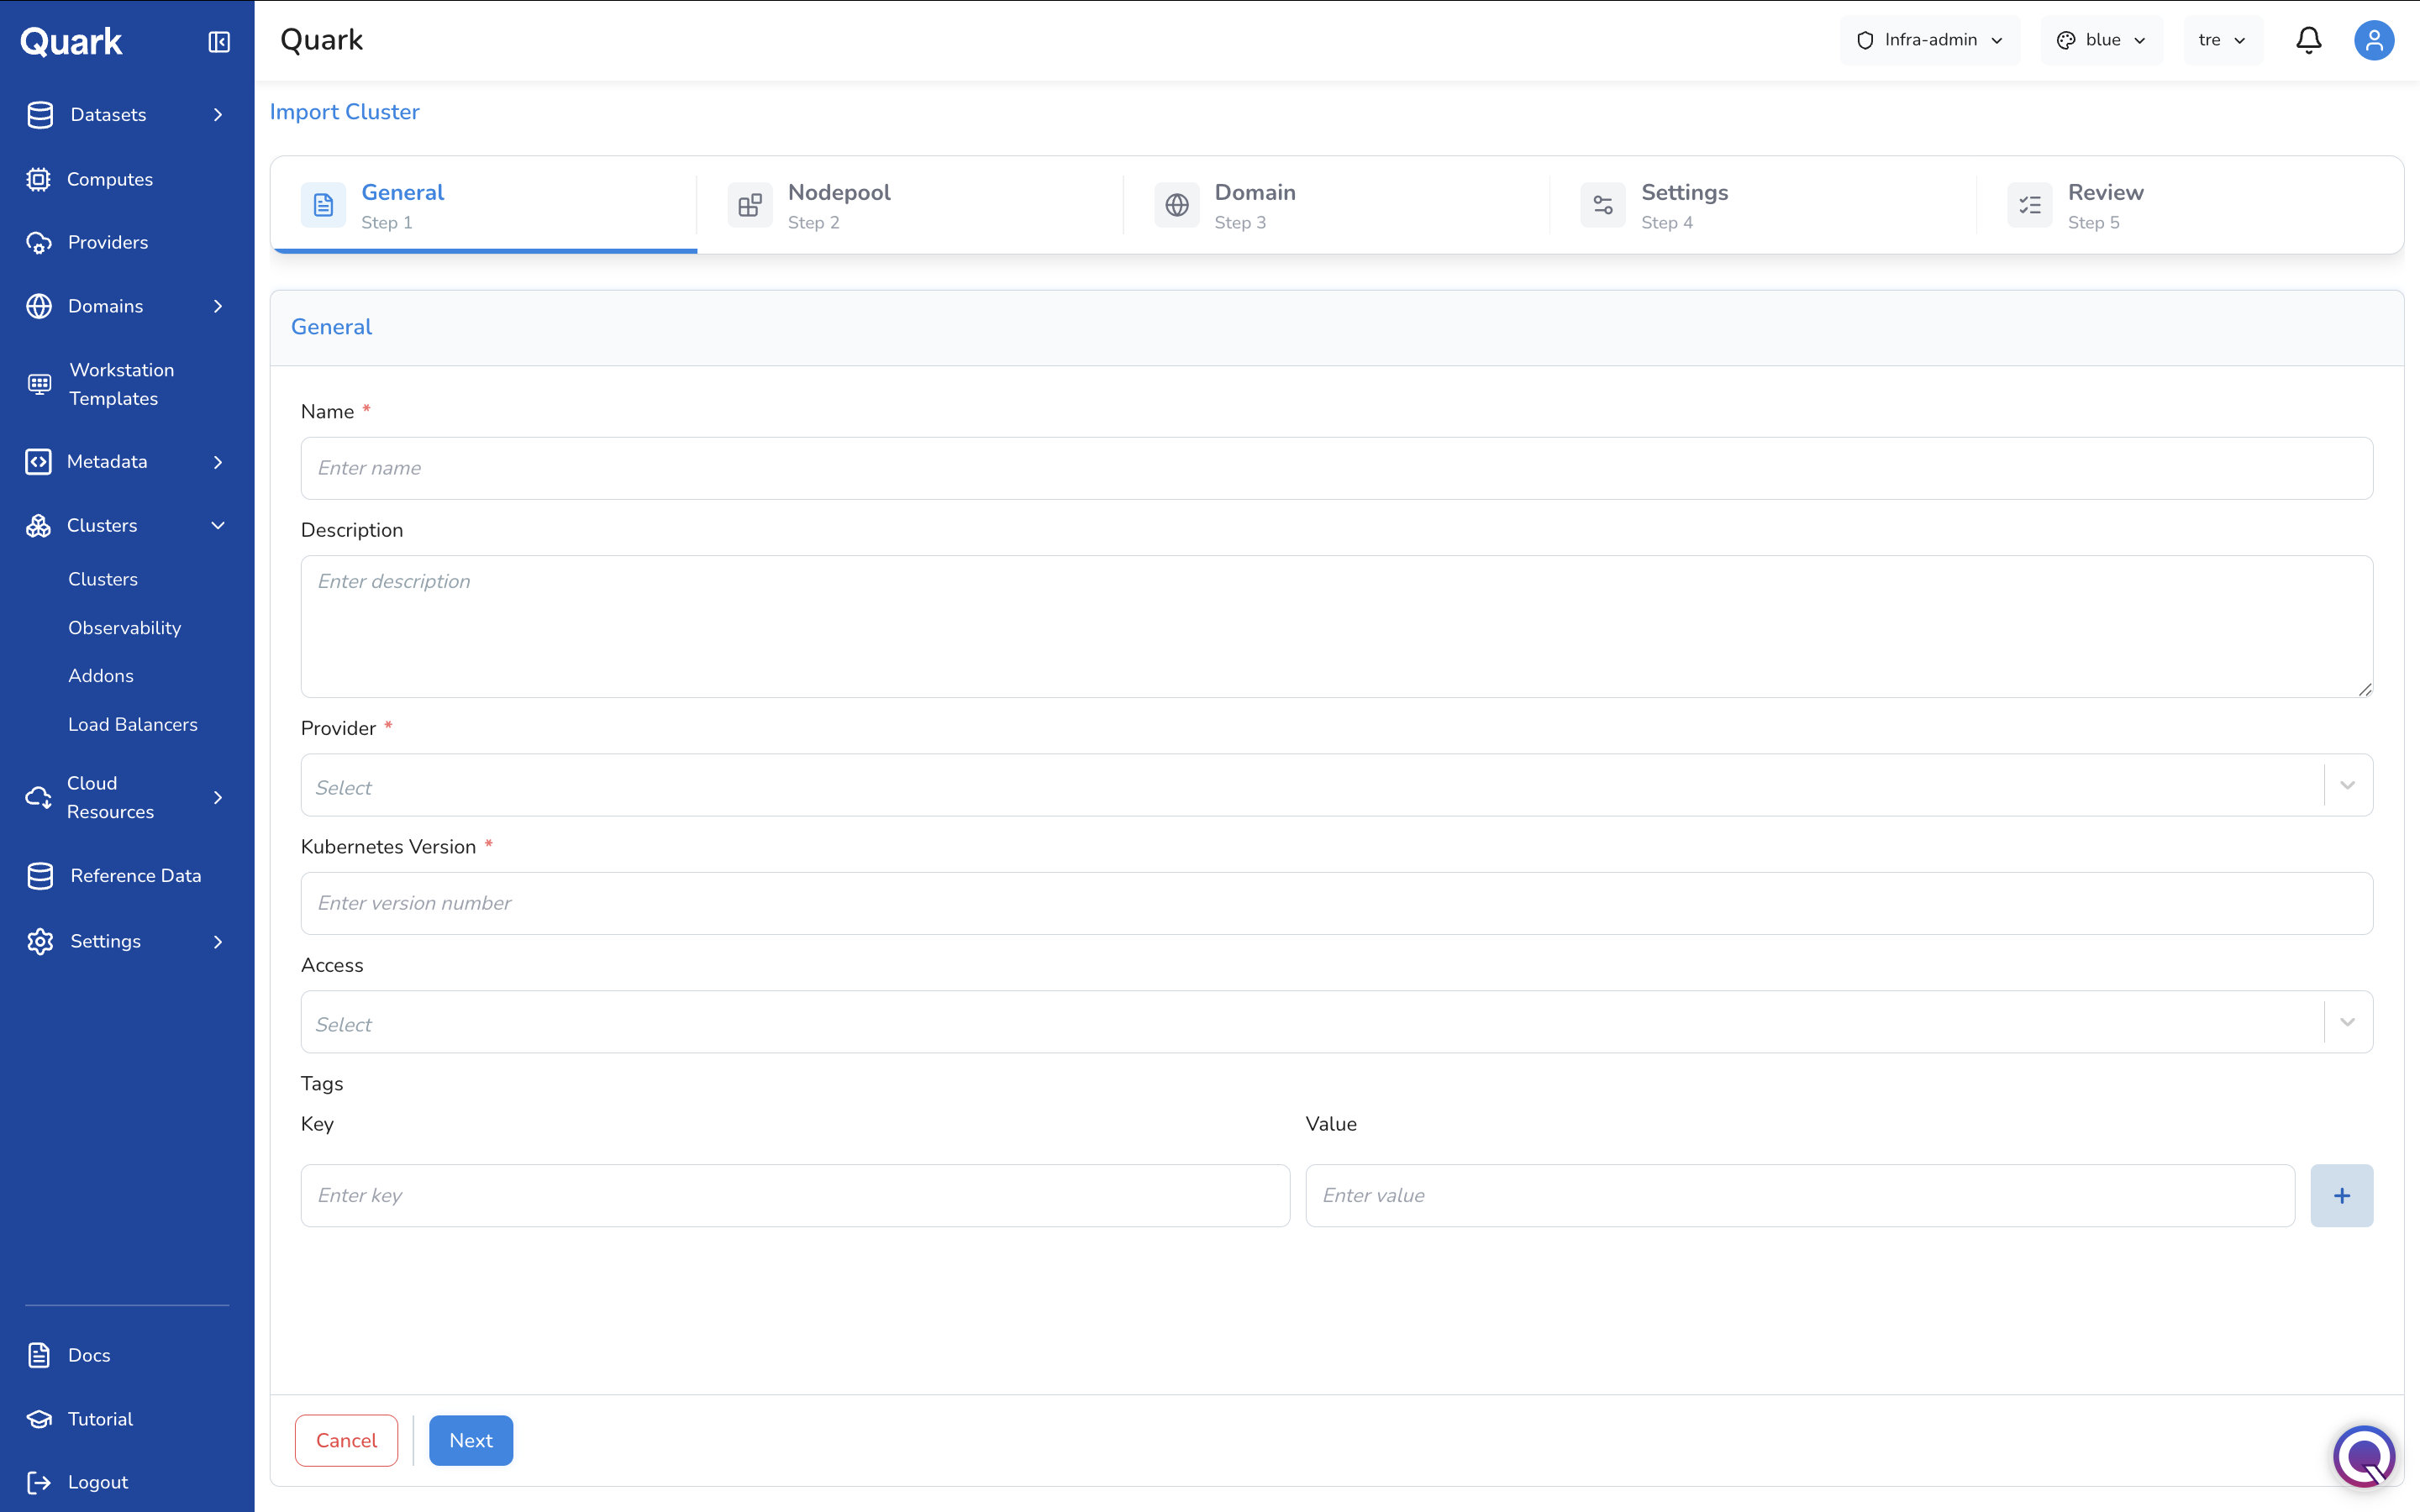
| Field | Description |
|---|---|
| Name (mandatory) | A unique name for this cluster entry on the platform. |
| Description | An optional description of this cluster's purpose or environment. |
| Provider (mandatory) | The connected cloud provider account where this cluster is running. Select from the providers registered in Providers. |
| Kubernetes Version (mandatory) | The Kubernetes version the existing cluster is running. Enter the version number exactly as it appears in your cluster (e.g., 1.33). |
| Access | The access mode for the cluster's Control Plane / API Server endpoint. |
| Tags | Optional key-value pairs for organisational labelling of this cluster. |
Step 2: Nodepool
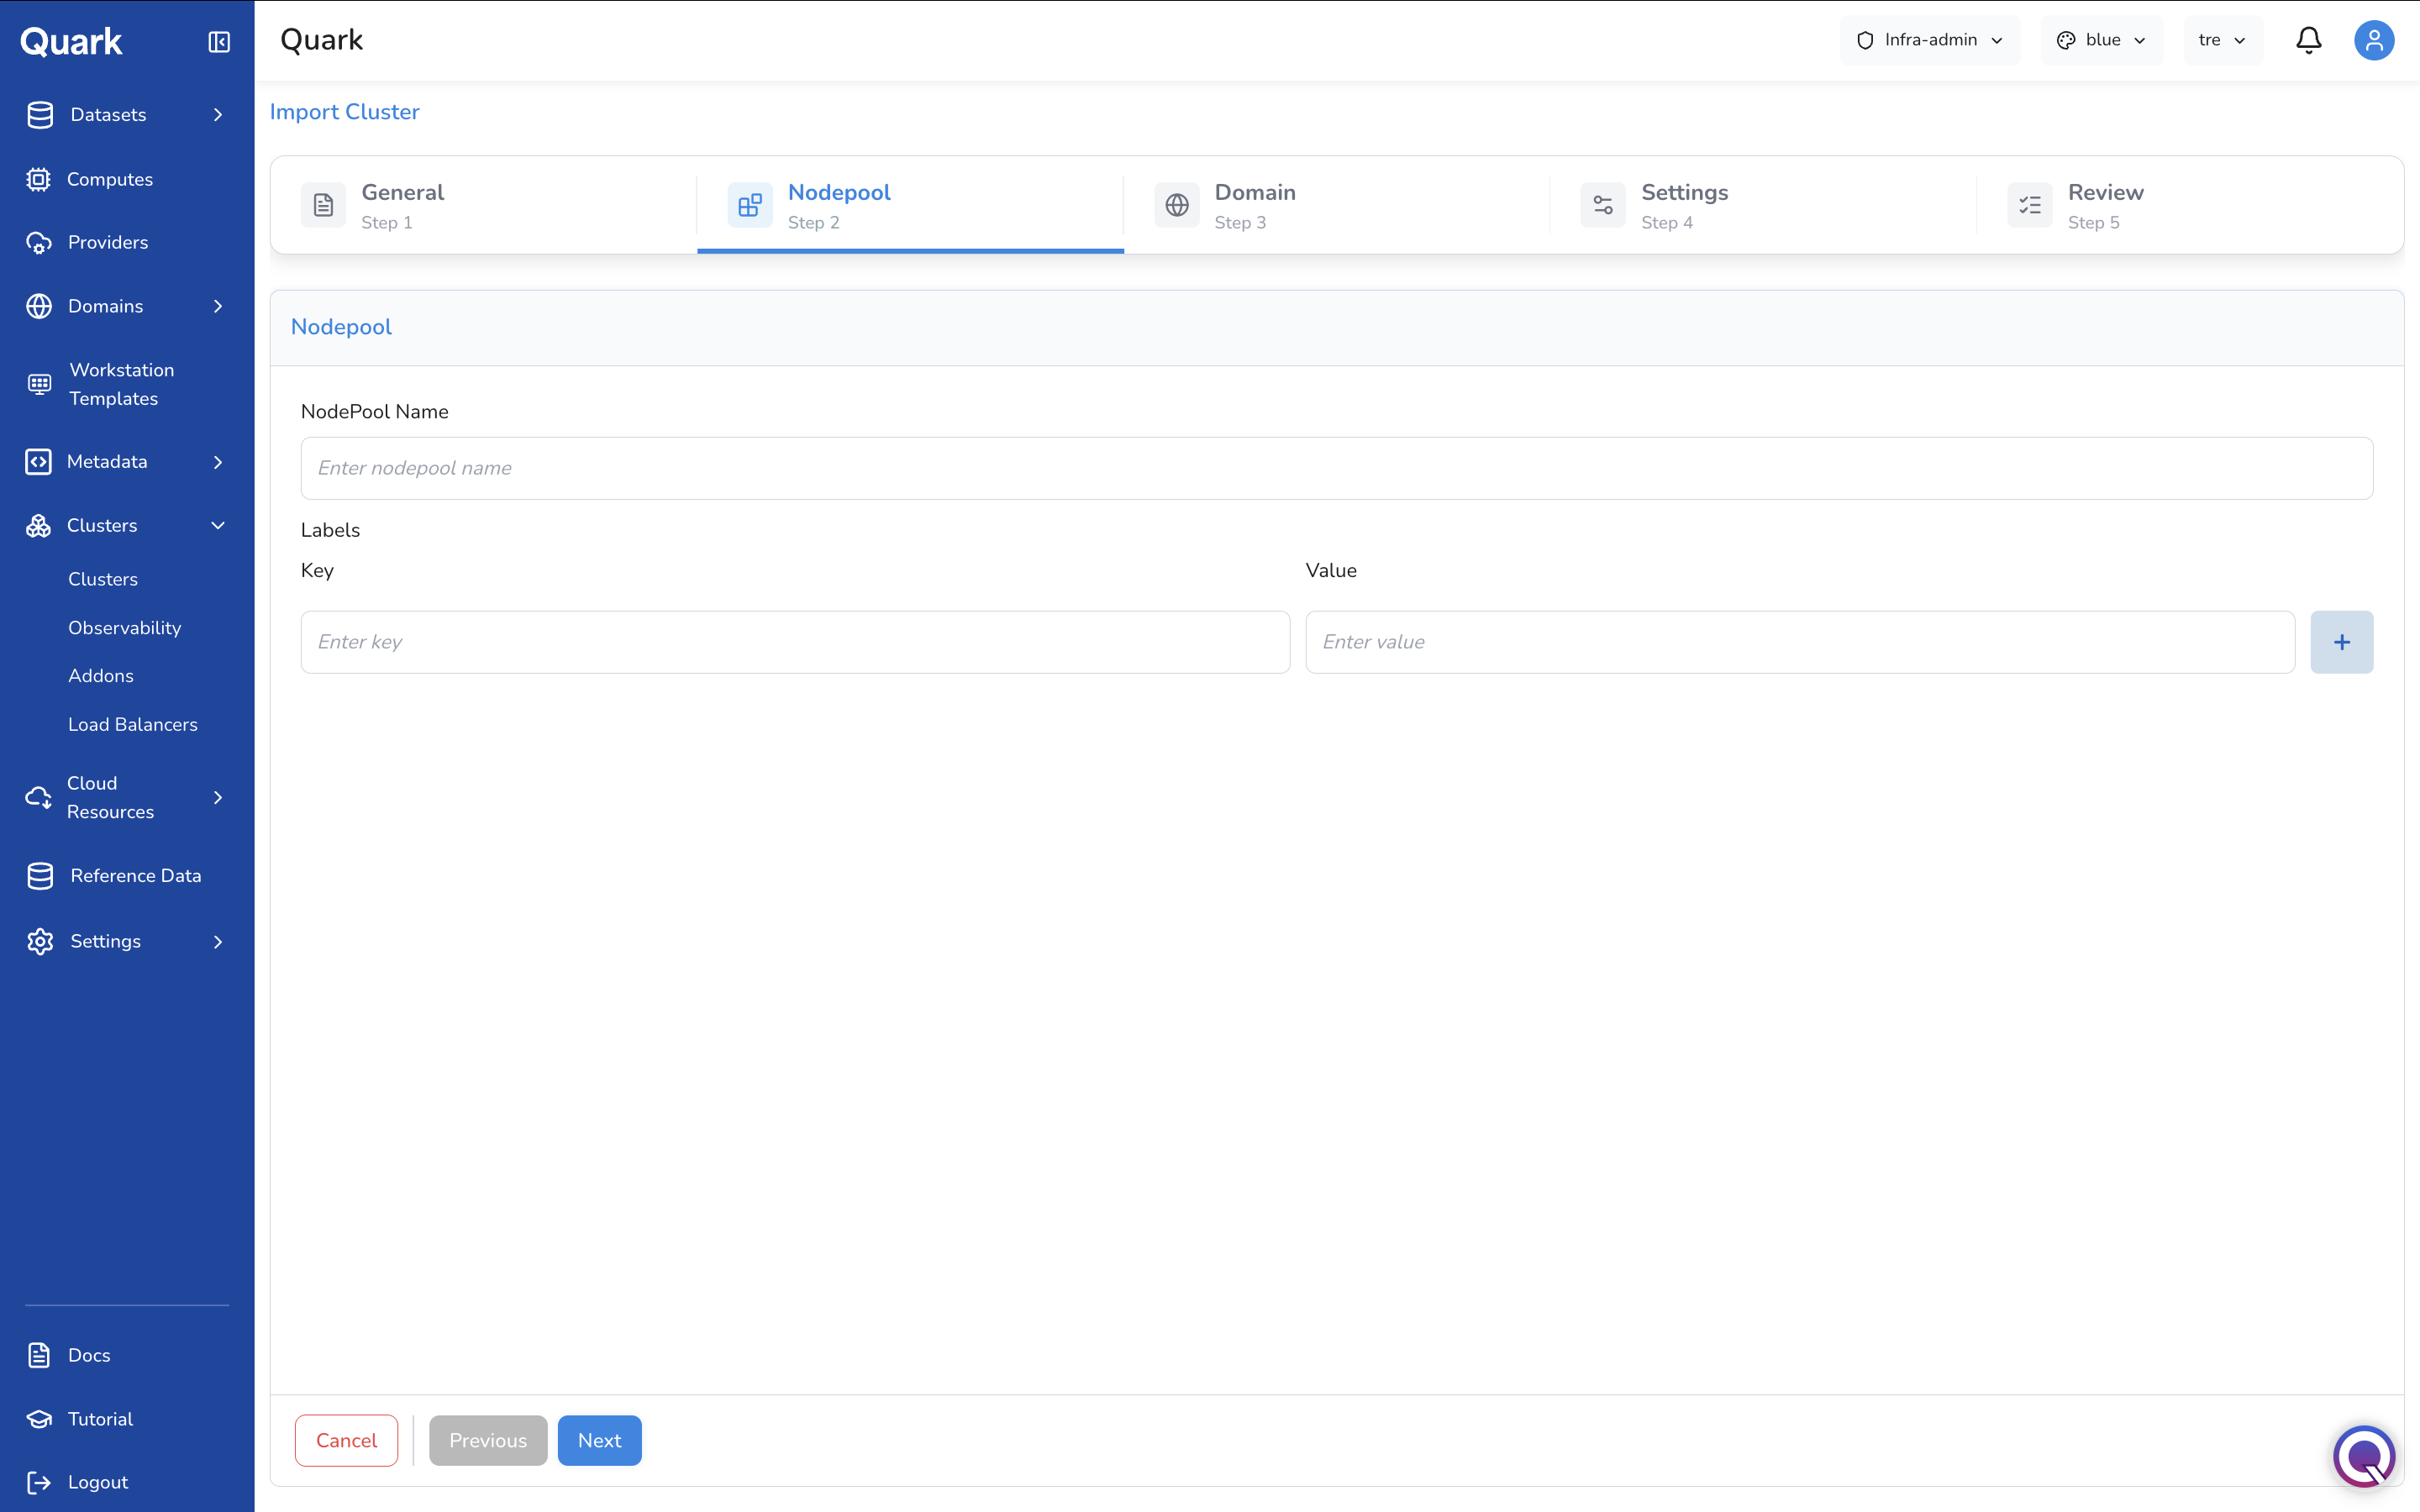
| Field | Description |
|---|---|
| NodePool Name | The name of the primary node pool on the imported cluster. |
| Labels | Optional key-value label pairs to associate with the node pool. |
Step 3: Domain
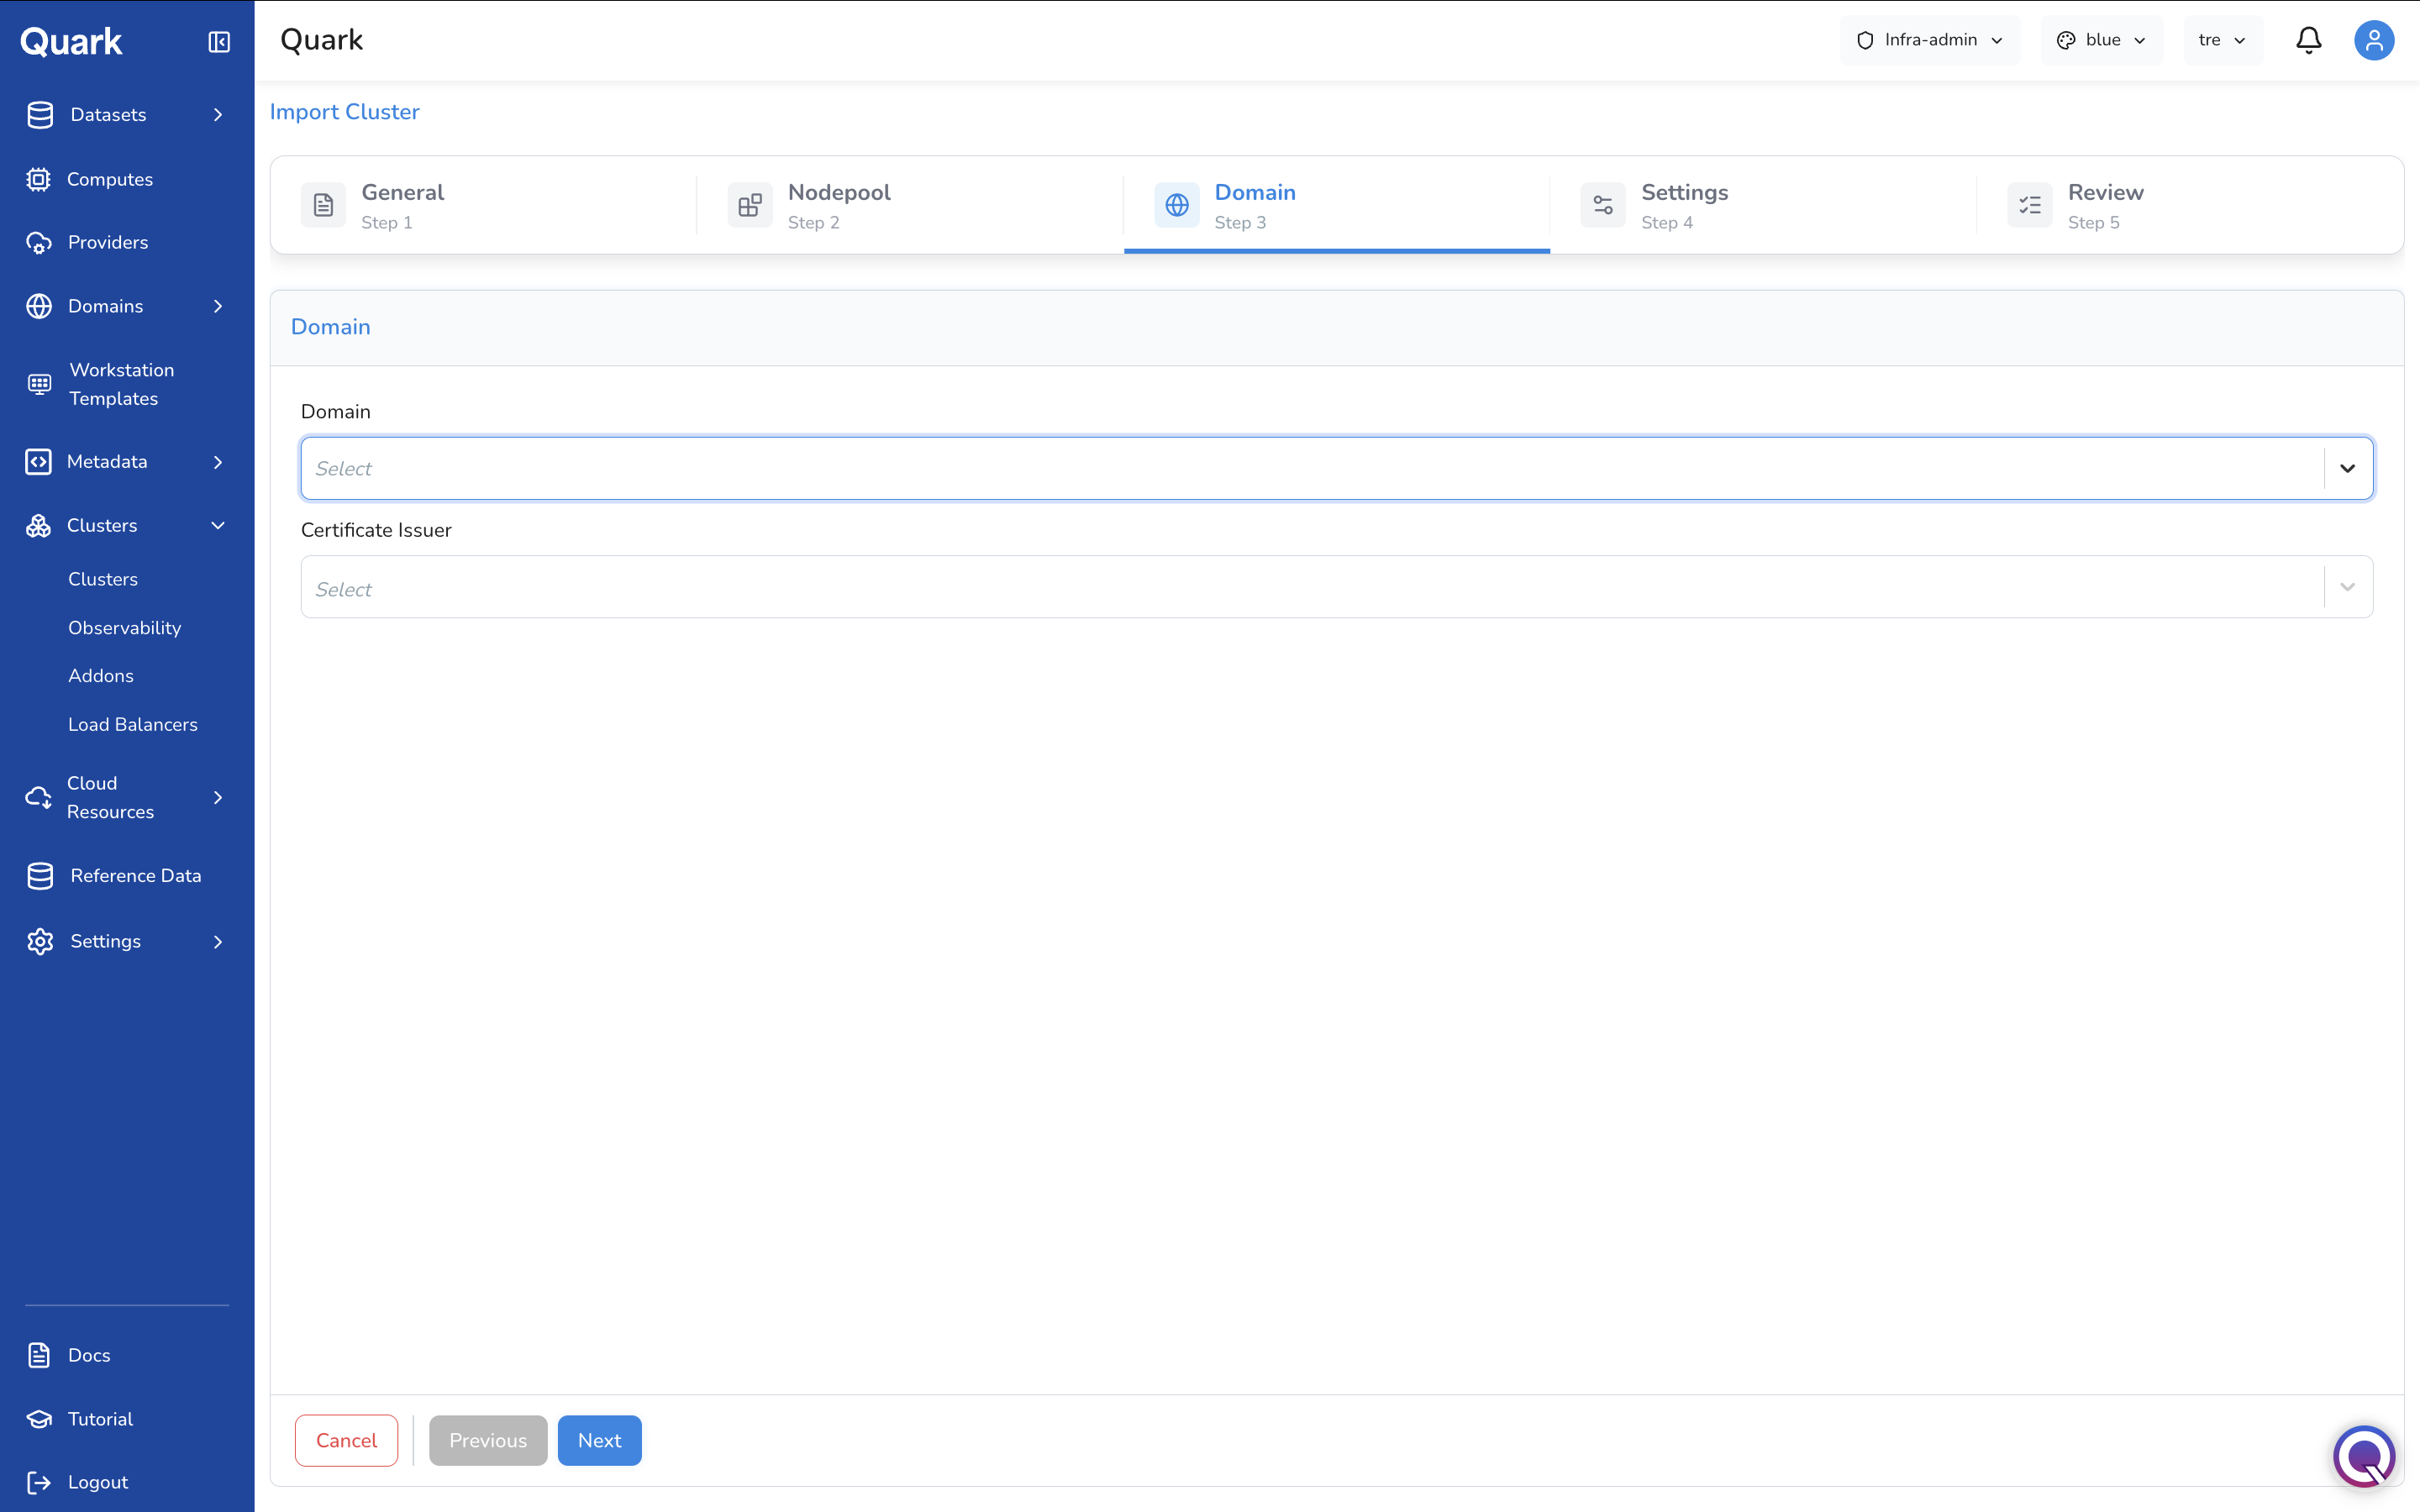
| Field | Description |
|---|---|
| Domain | The domain to associate with this cluster for routing platform services. Select from the domains registered in Domains. |
| Certificate Issuer | The certificate issuer that will handle TLS for services on this cluster. Select from the issuers configured in Domains → Certificate Issuers. |
Step 4: Settings
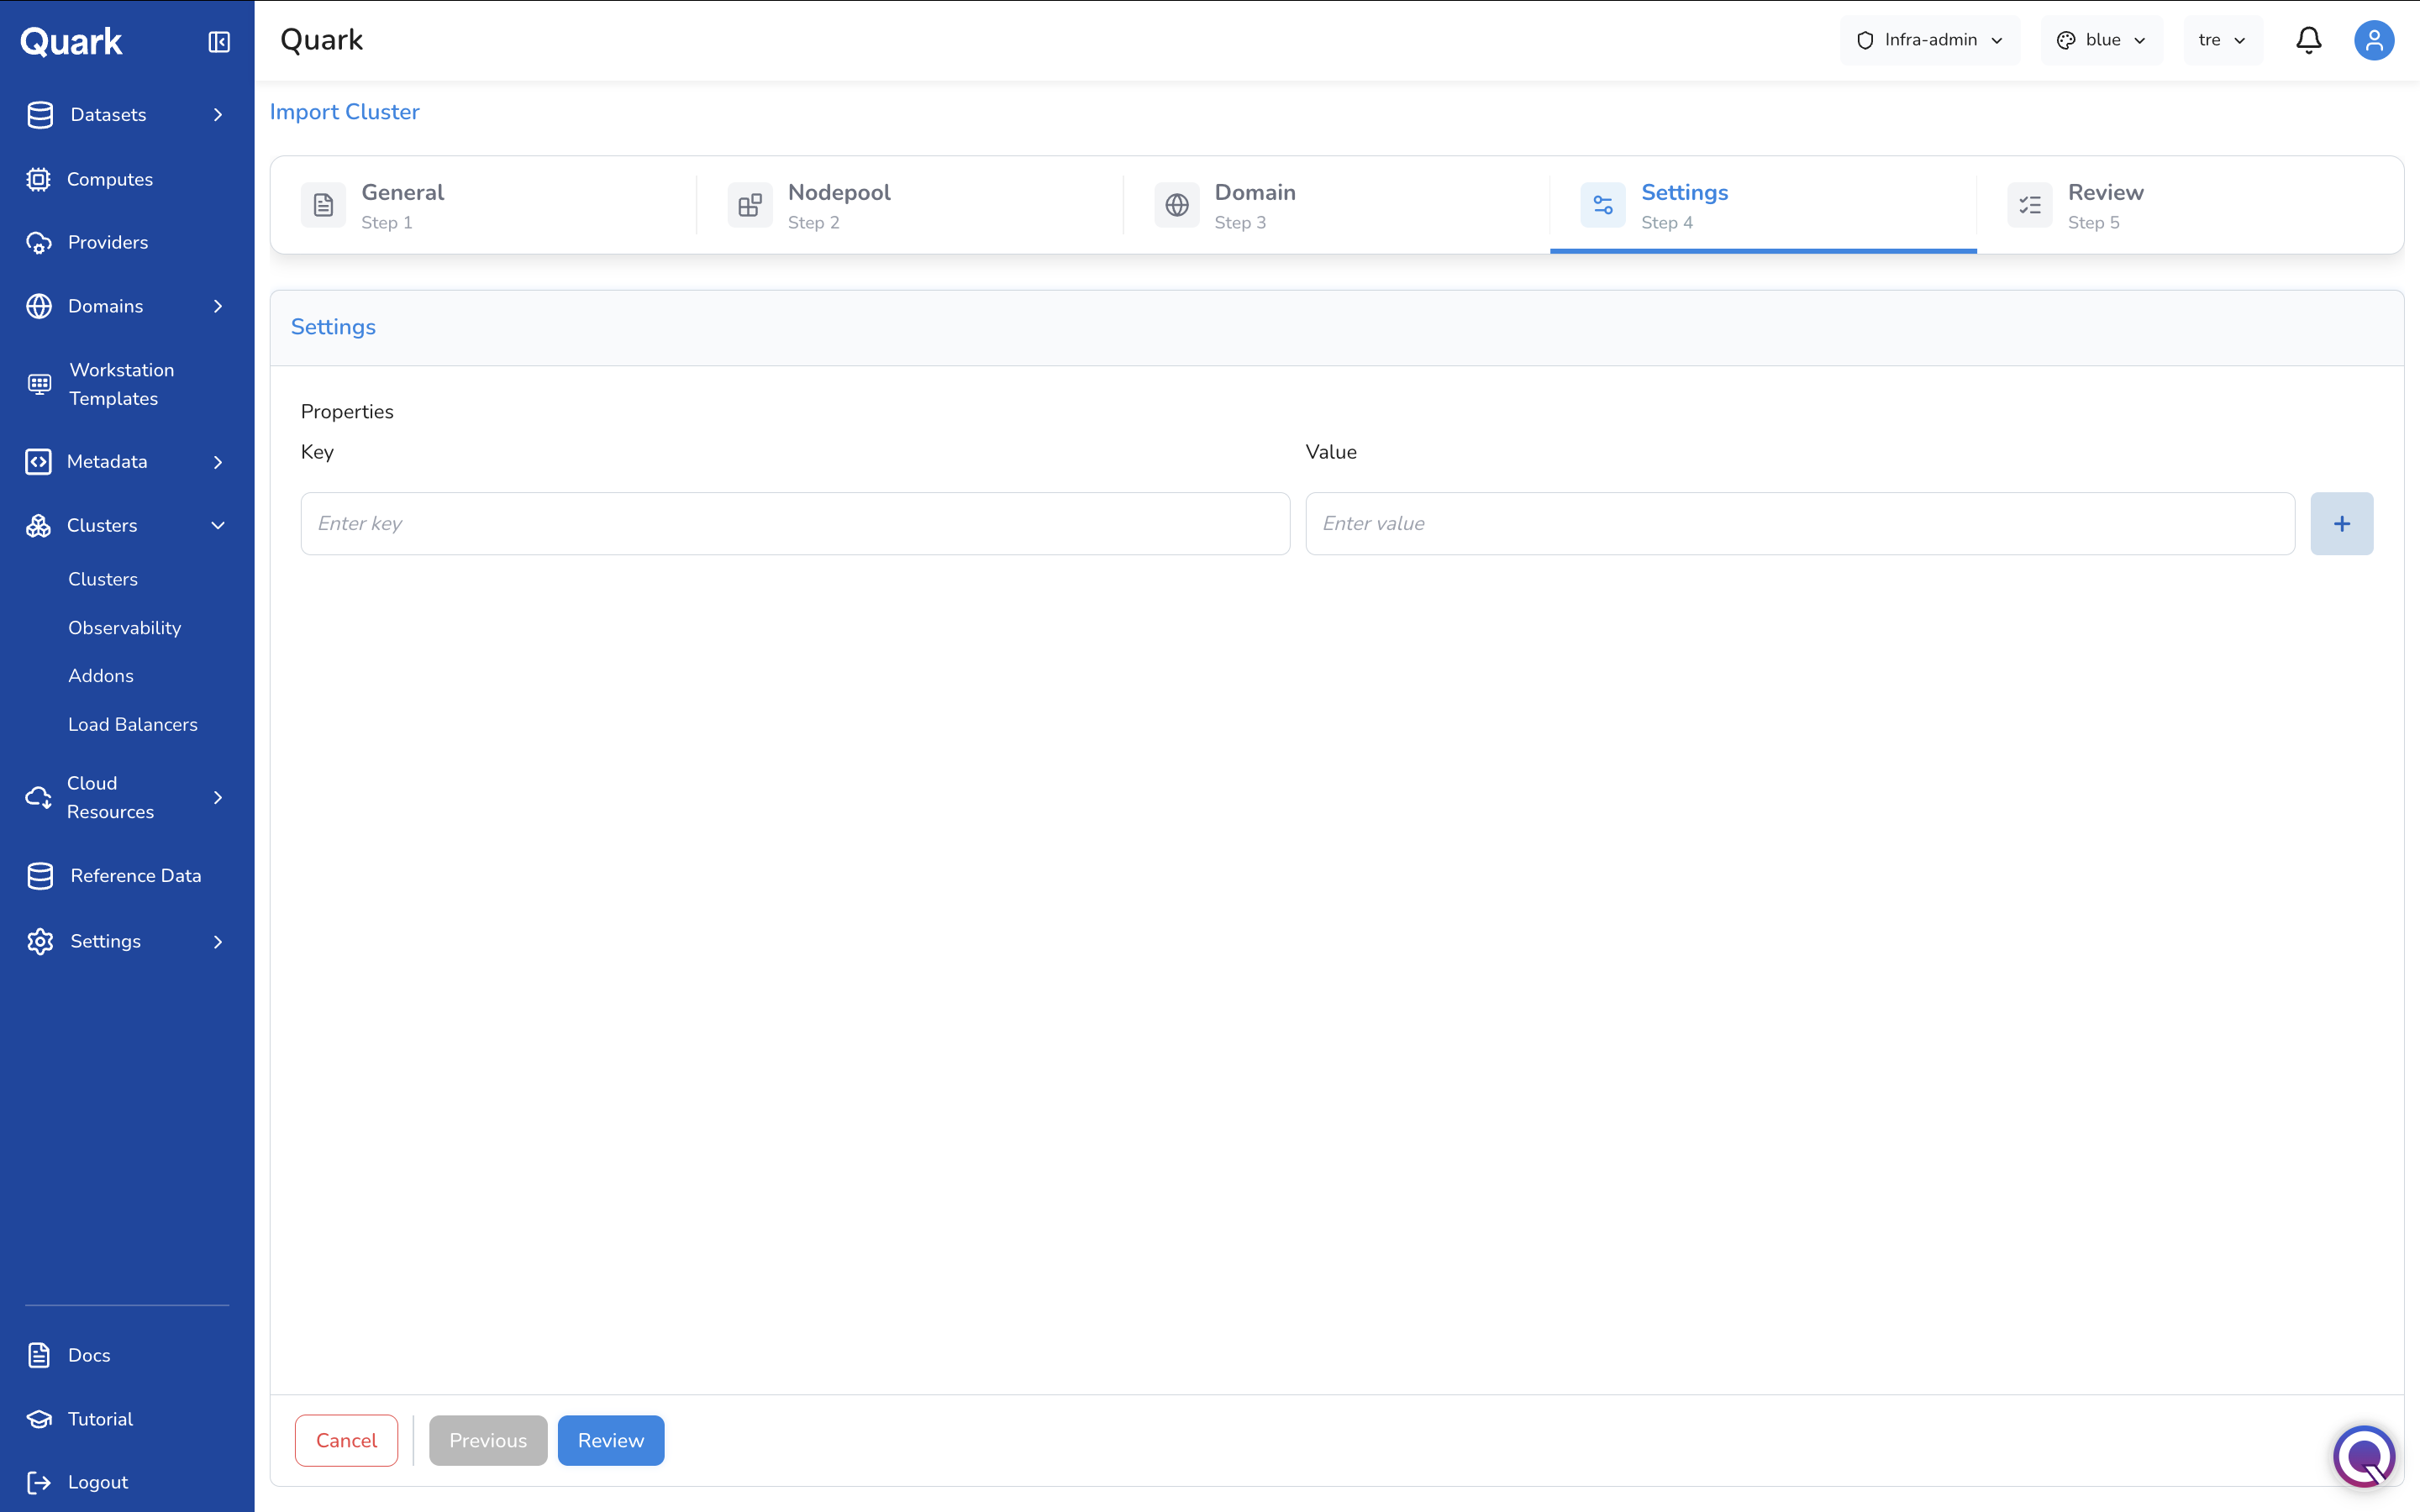
| Field | Description |
|---|---|
| Properties | Optional key-value properties to associate with this cluster for configuration or identification purposes. |
Step 5: Review
Review all configuration details, then click Create to register the imported cluster.
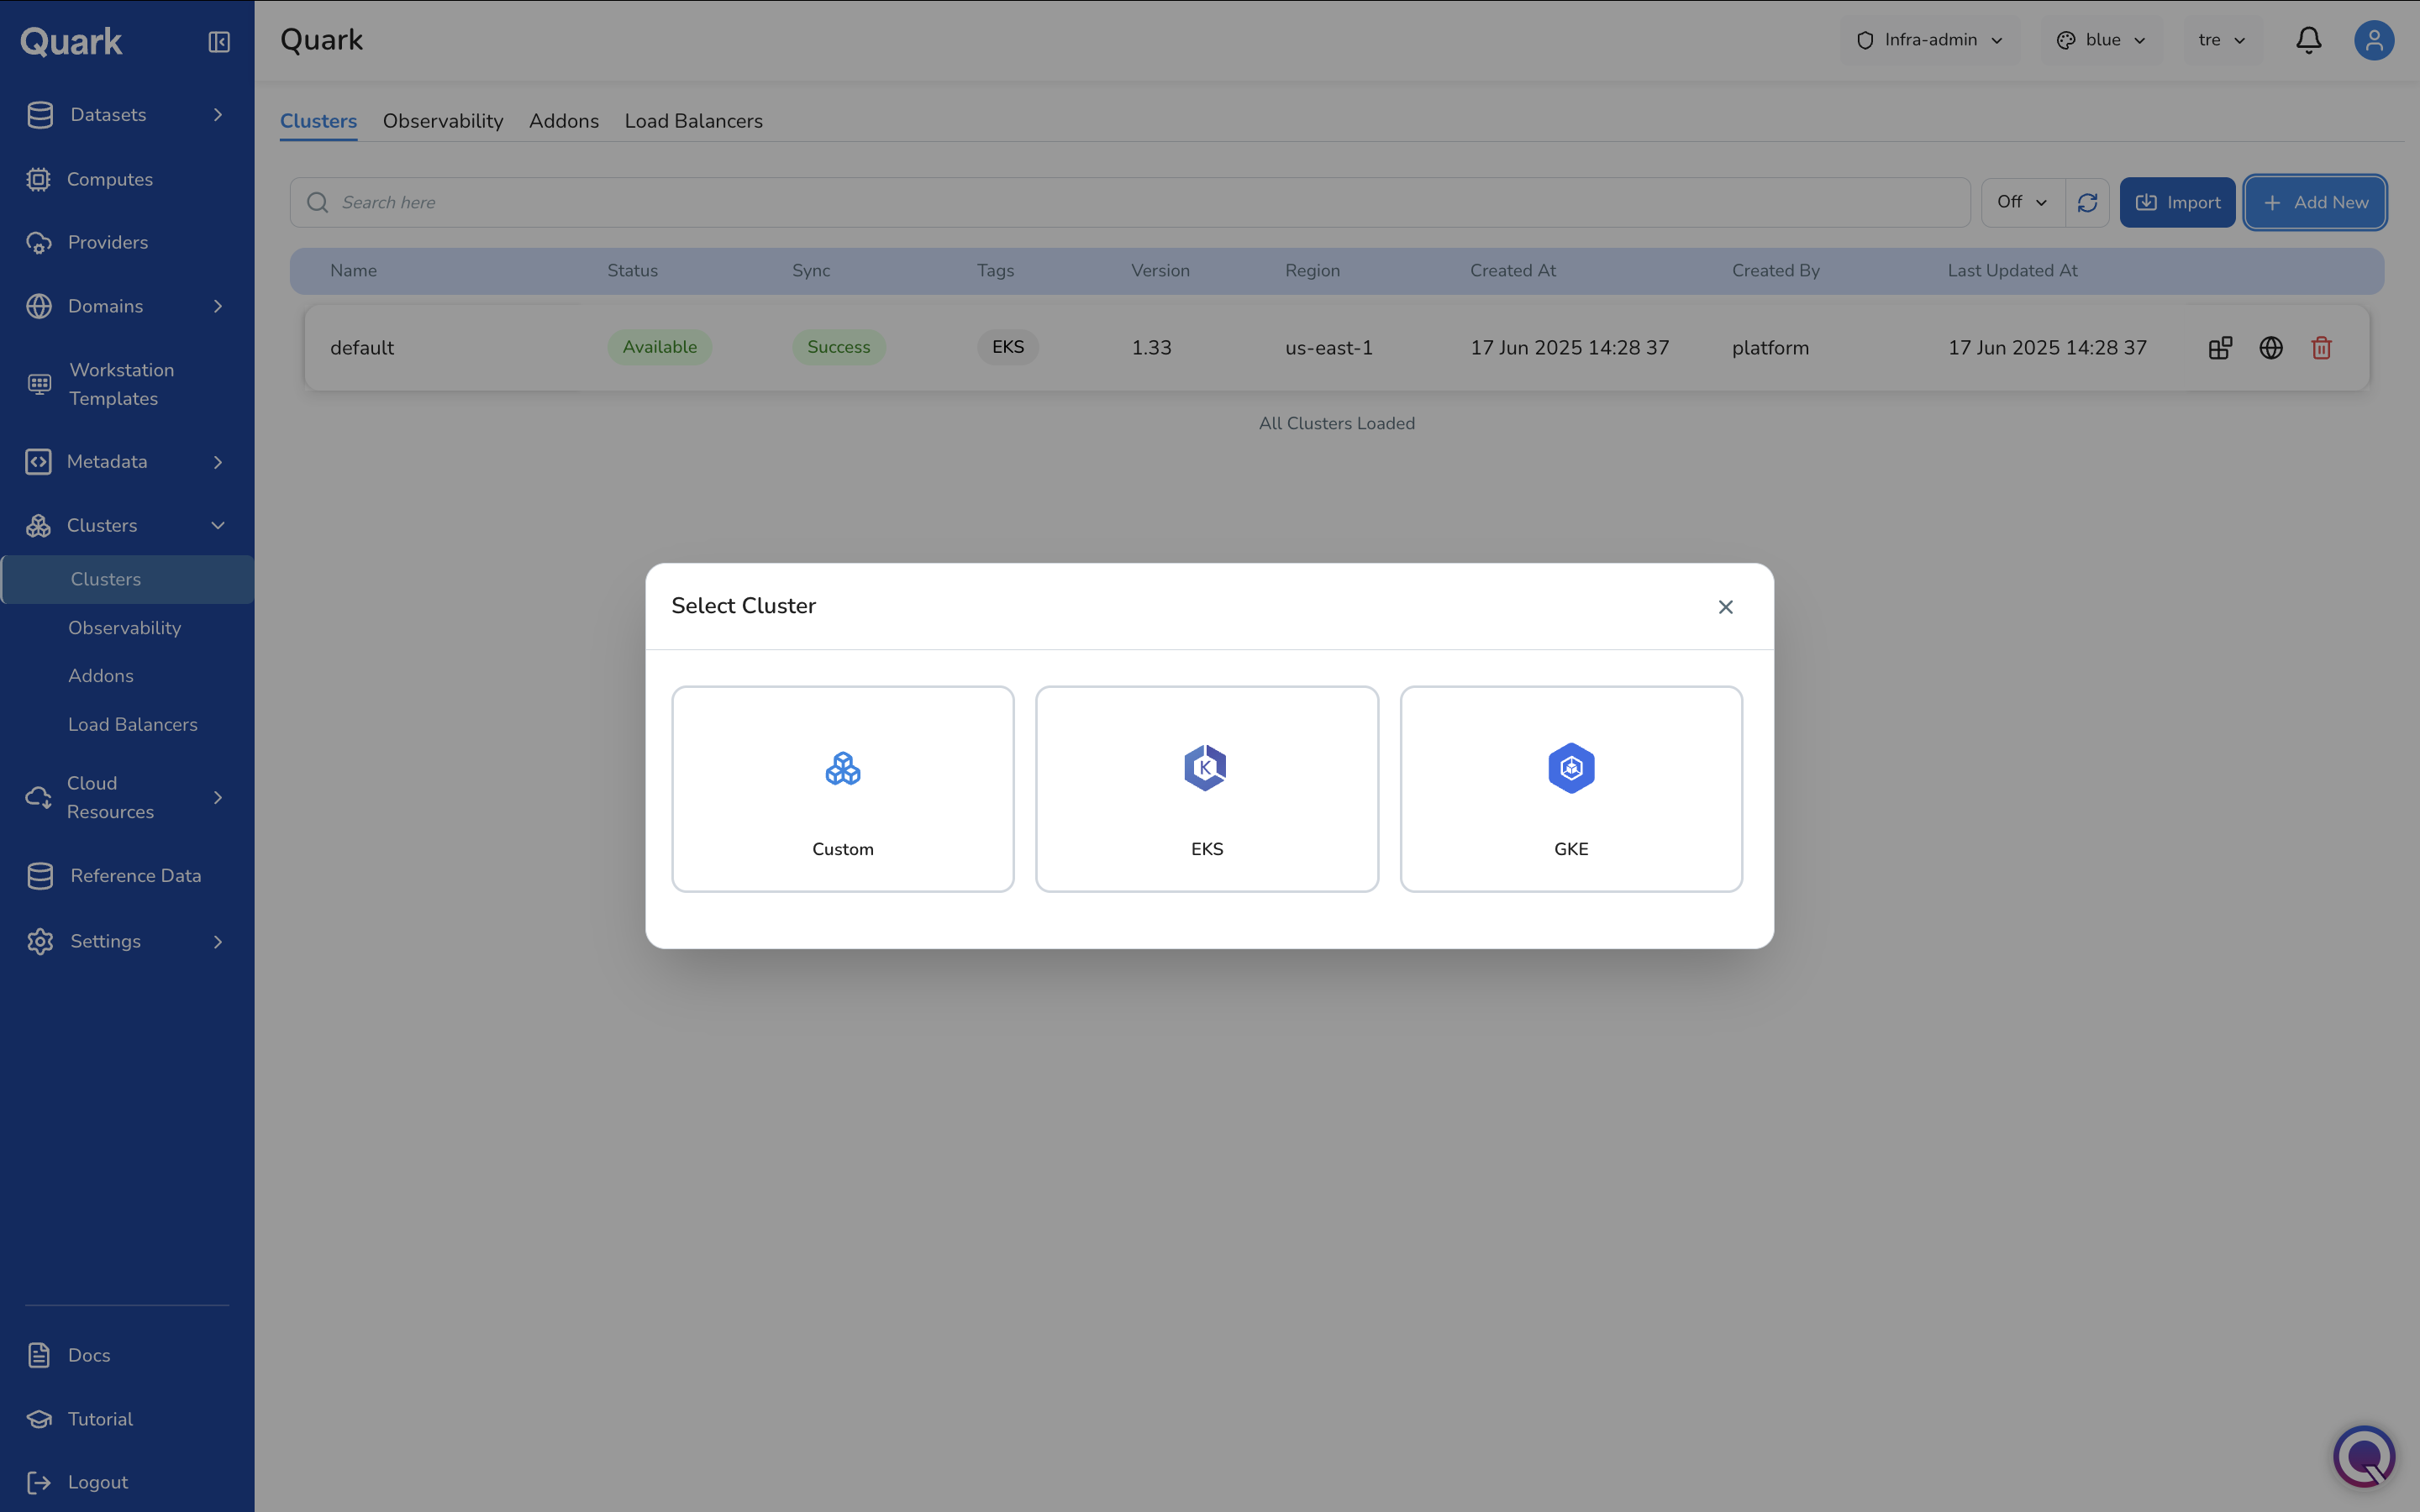
Creating a New Cluster
- Click + Add New in the toolbar.
-
The Select Cluster modal appears with three engine options: Custom, EKS, GKE.
-
Select the appropriate engine. The wizard opens for that cluster type.
The example below walks through creating an EKS cluster, which has six steps: General → Network → Capacity → Domain → Settings → Review.
Step 1: General
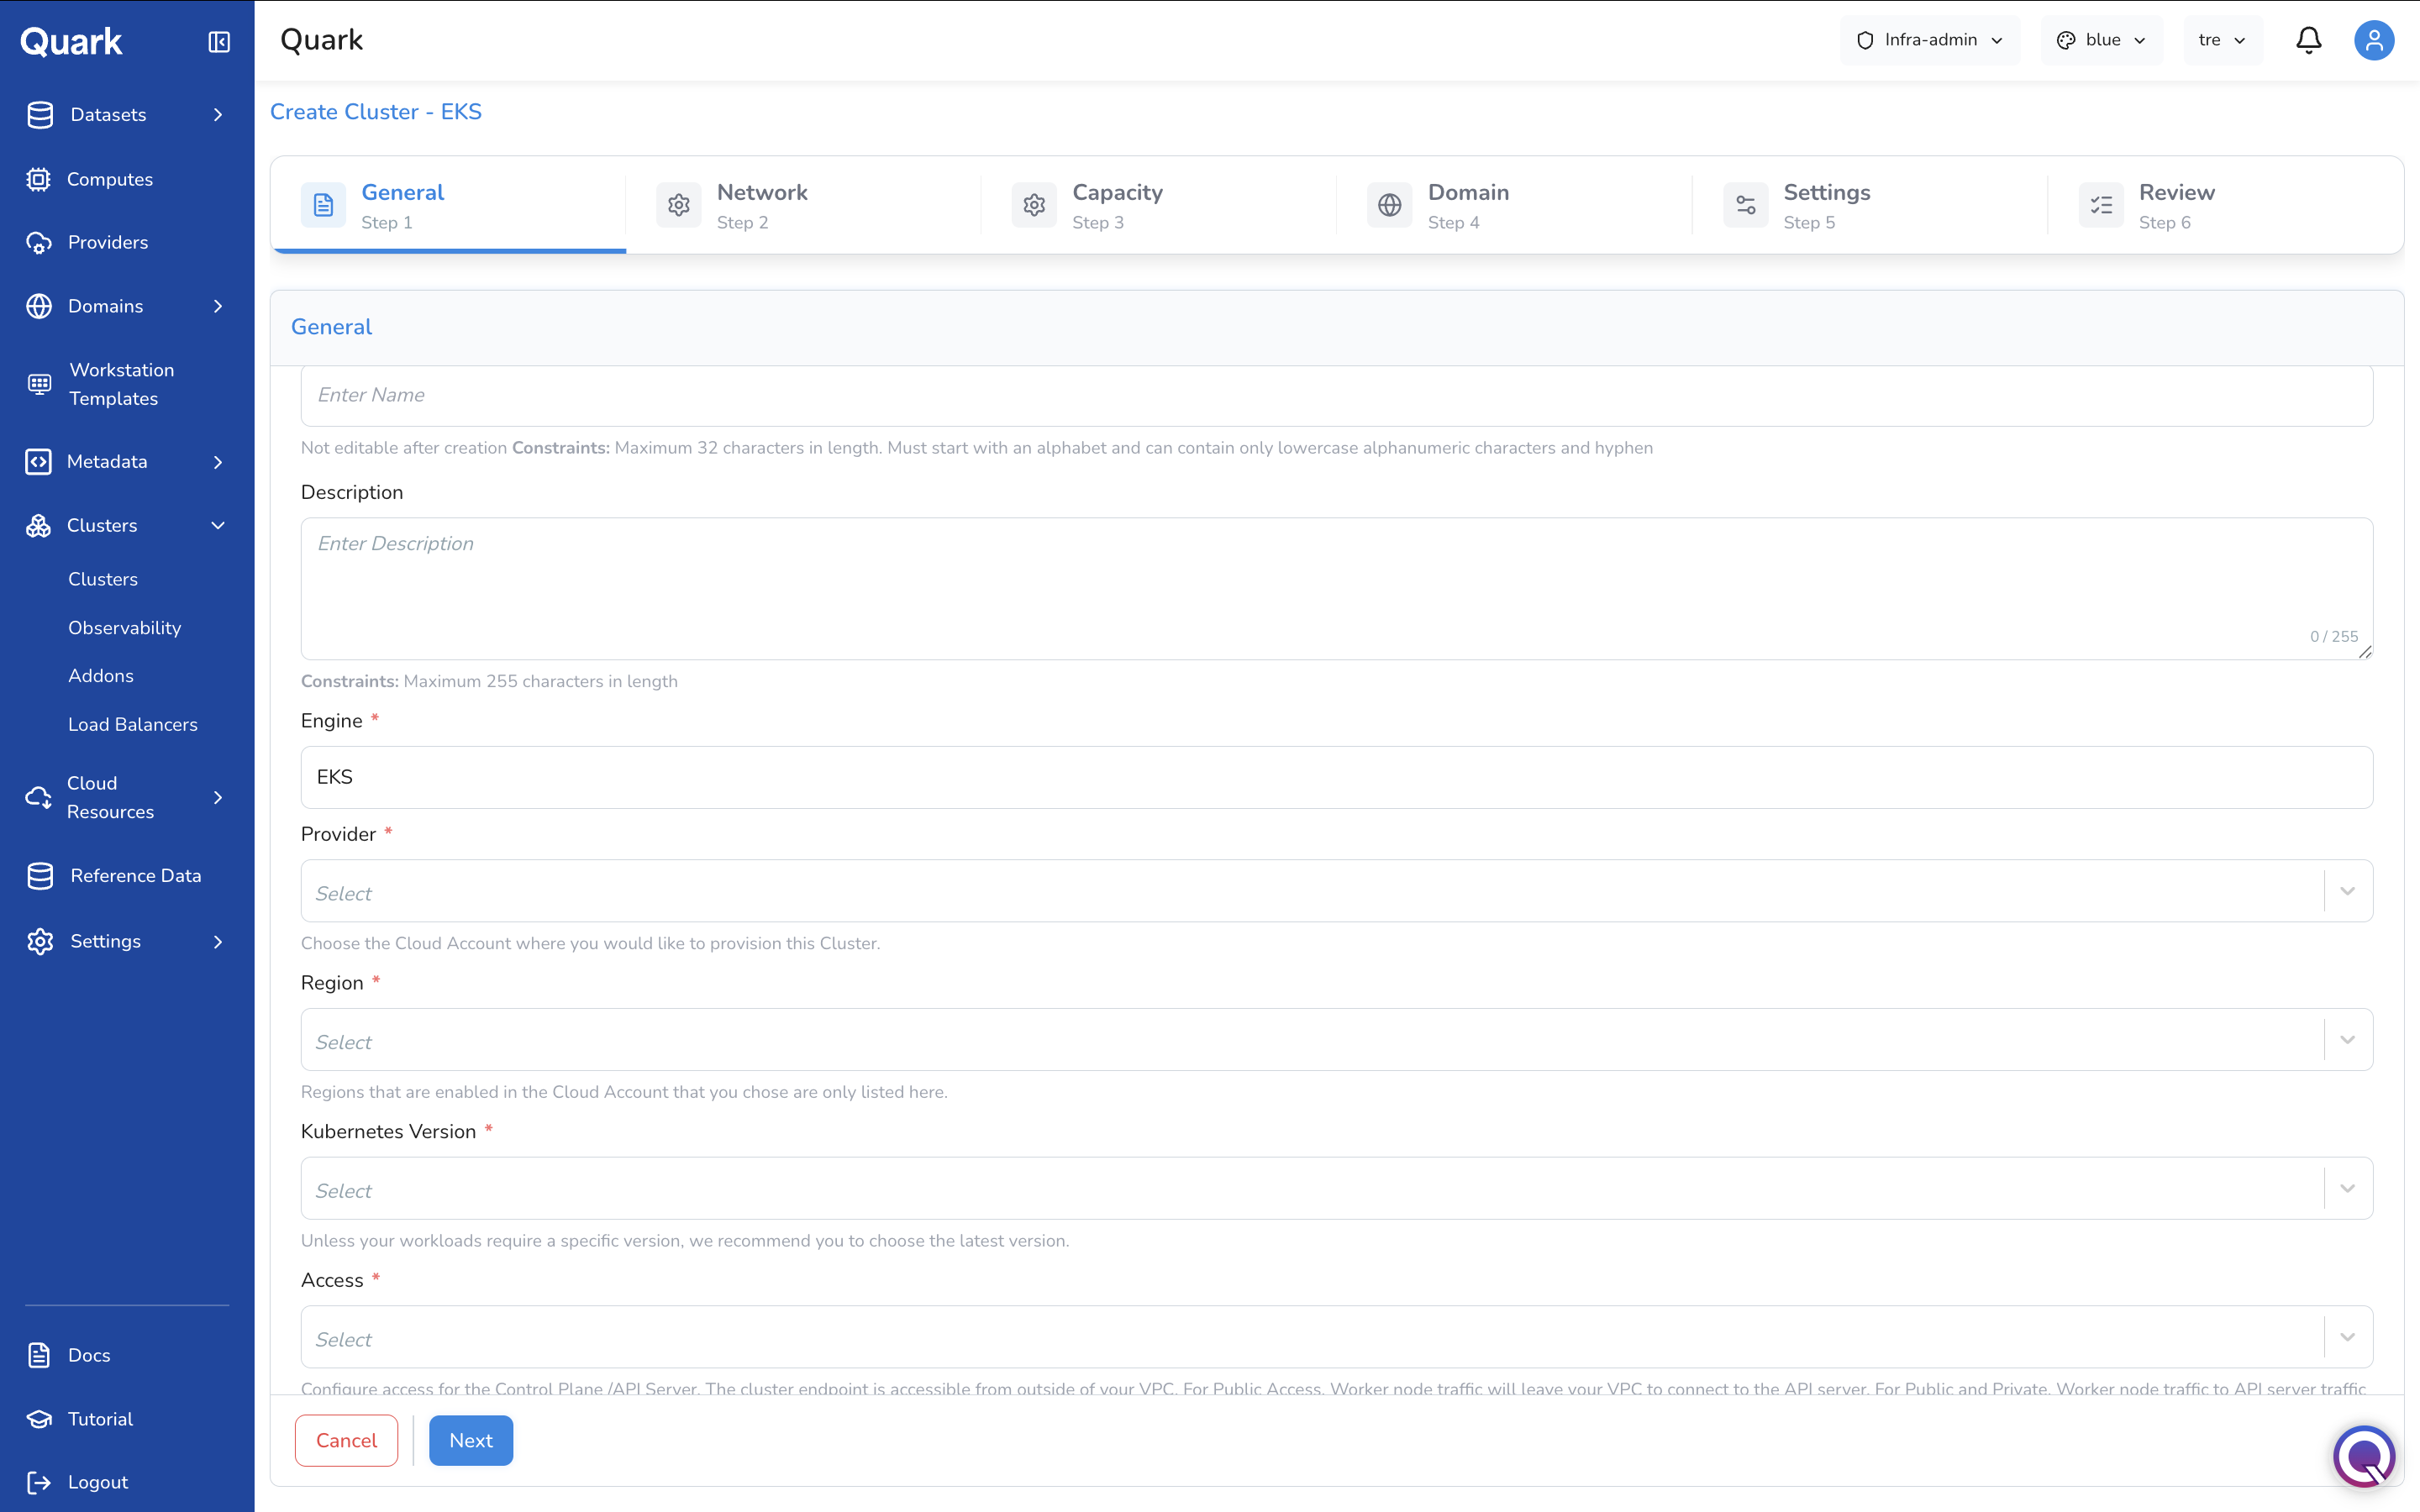
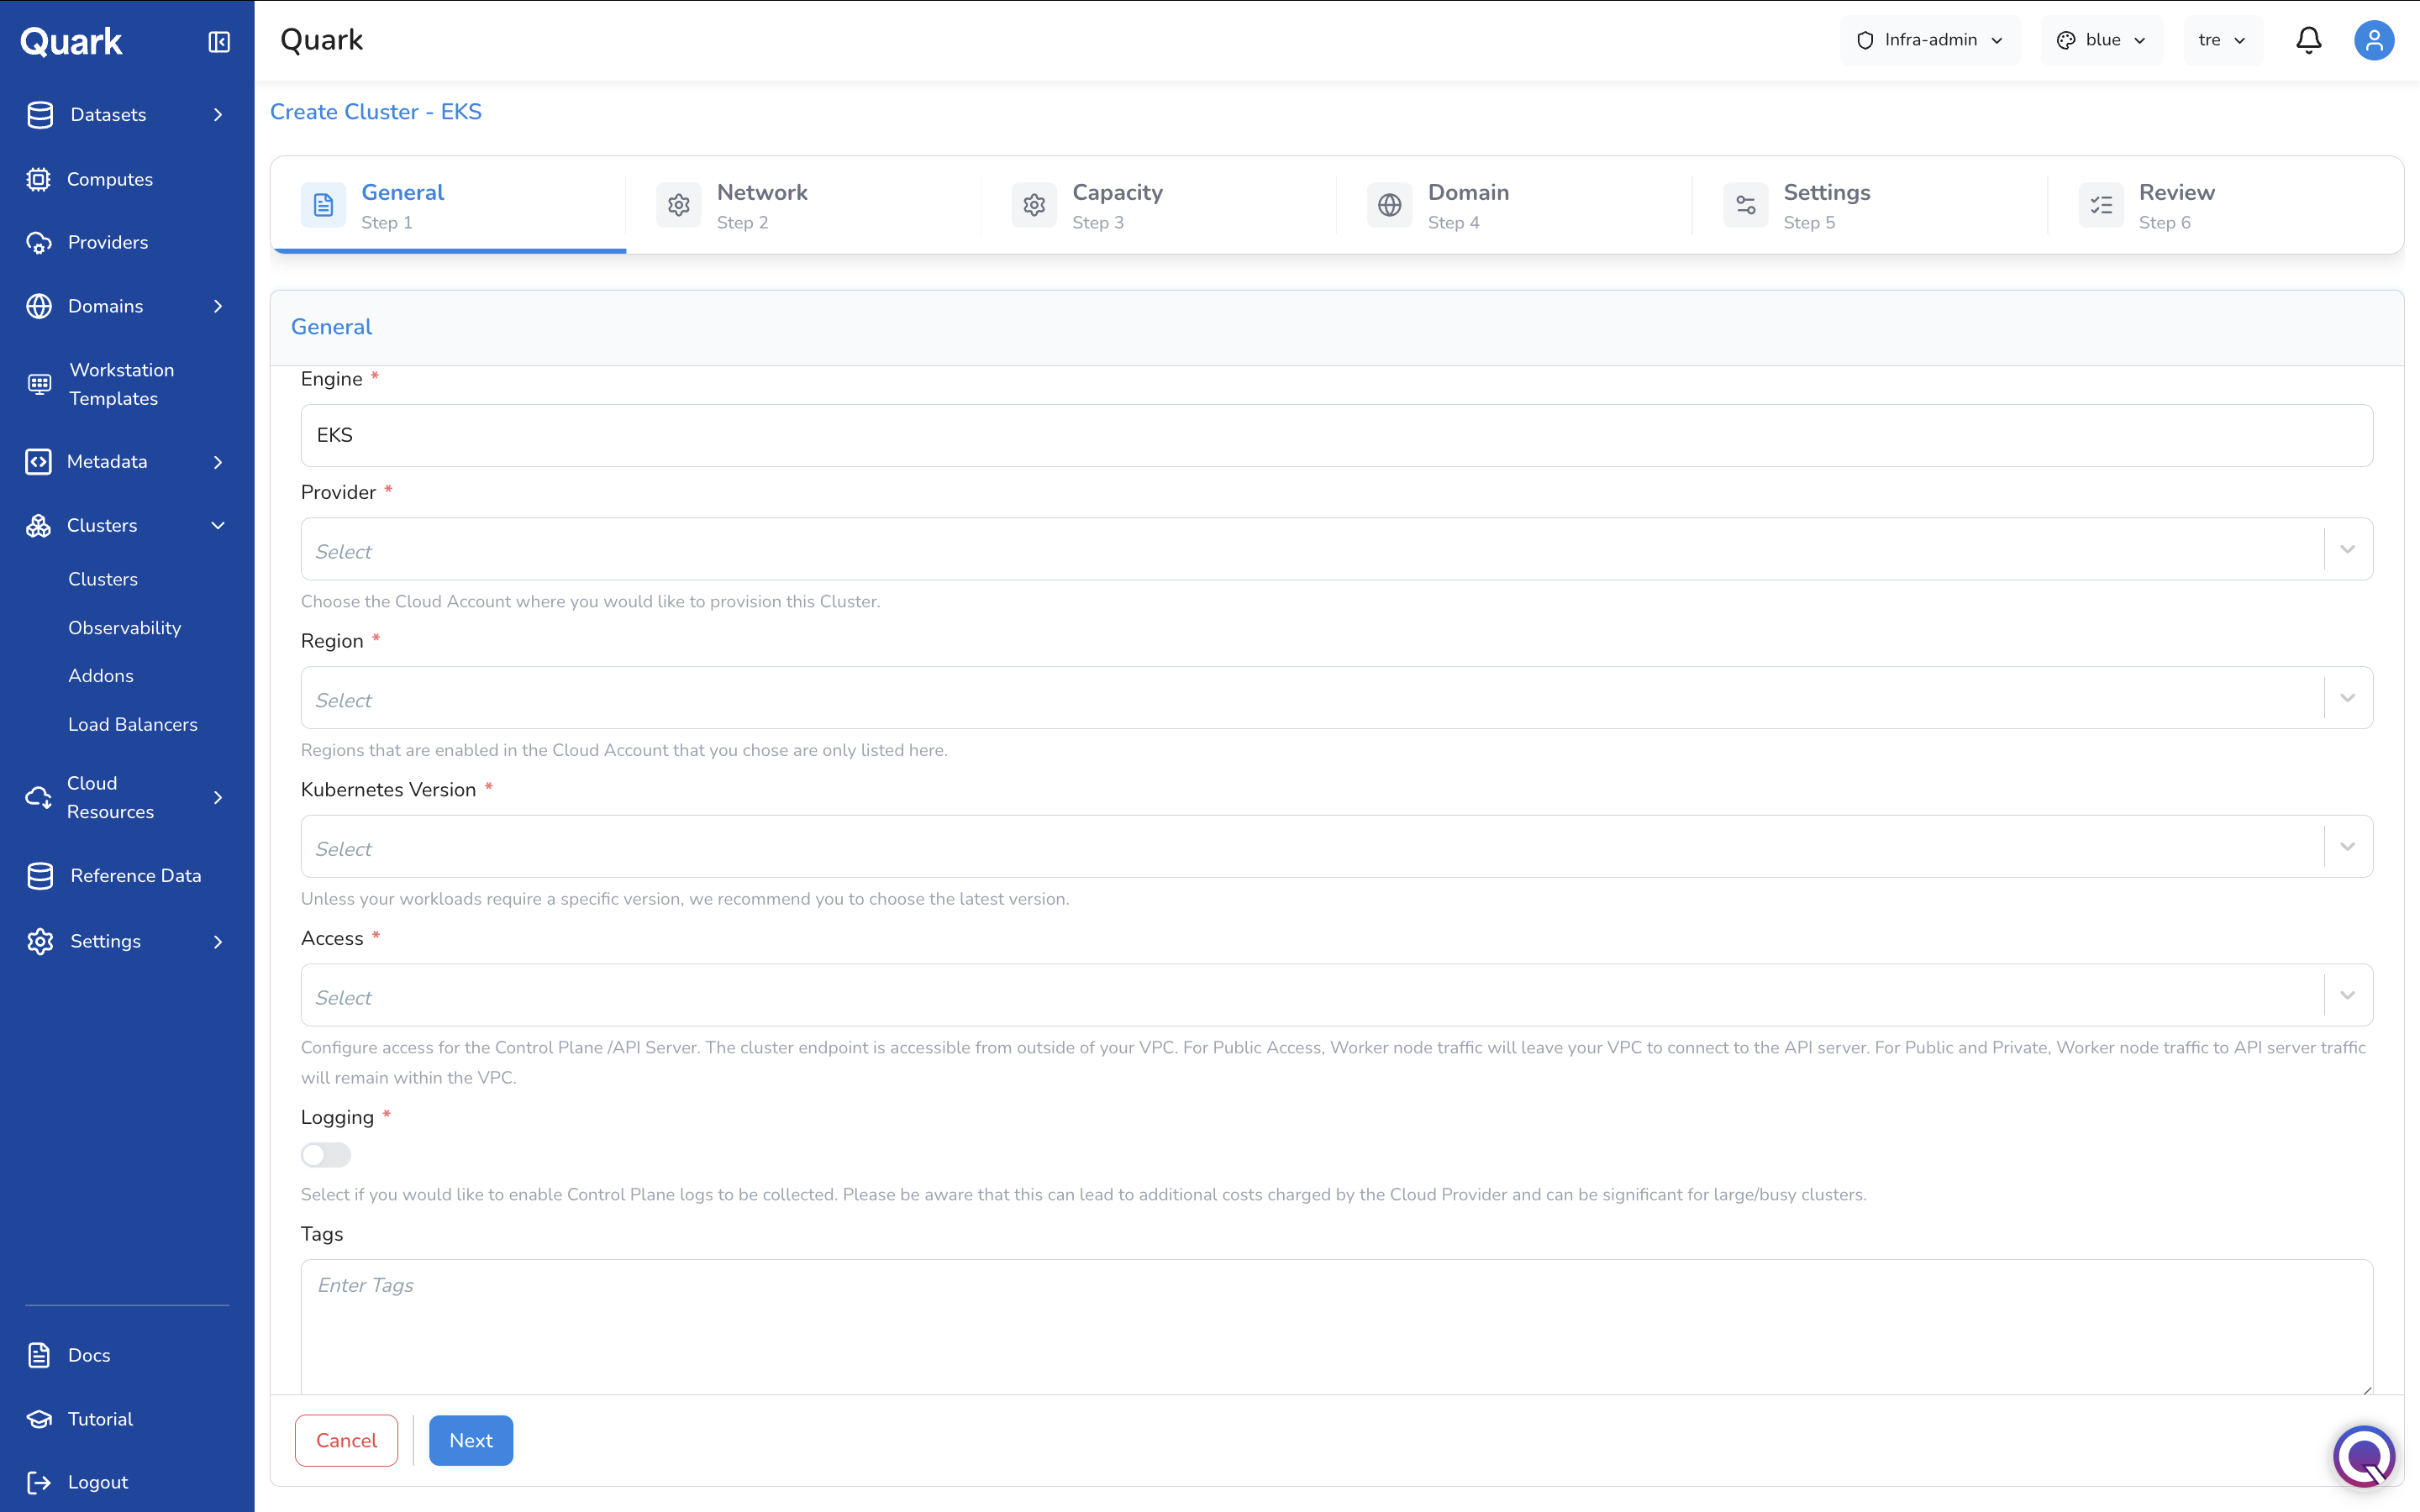
| Field | Description |
|---|---|
| Name (mandatory) | A unique name for this cluster. Maximum 32 characters. Must start with a letter and contain only lowercase alphanumeric characters and hyphens. Not editable after creation. |
| Description | An optional description. Maximum 255 characters. |
| Engine | Auto-populated with the selected engine type (e.g., EKS). Read-only. |
| Provider (mandatory) | The connected AWS cloud account where this cluster will be provisioned. Only regions enabled for the selected provider are available in the Region field. |
| Region (mandatory) | The AWS region where the cluster will be created. Only regions allowed by the selected Provider are listed. |
| Kubernetes Version (mandatory) | The Kubernetes version to deploy. Unless a workload requires a specific version, select the latest available. |
| Access (mandatory) | The access mode for the Control Plane / API Server. Public — the cluster endpoint is accessible from outside your VPC; worker node traffic leaves the VPC to reach the API server. Public and Private — the endpoint is publicly accessible but worker node traffic to the API server remains within the VPC. |
| Logging (mandatory) | Toggle to enable Control Plane log collection. Enabling this incurs additional cloud provider costs, which can be significant for large or busy clusters. |
| Tags | Optional tags to associate with the cluster in the cloud provider. |
Step 2: Network
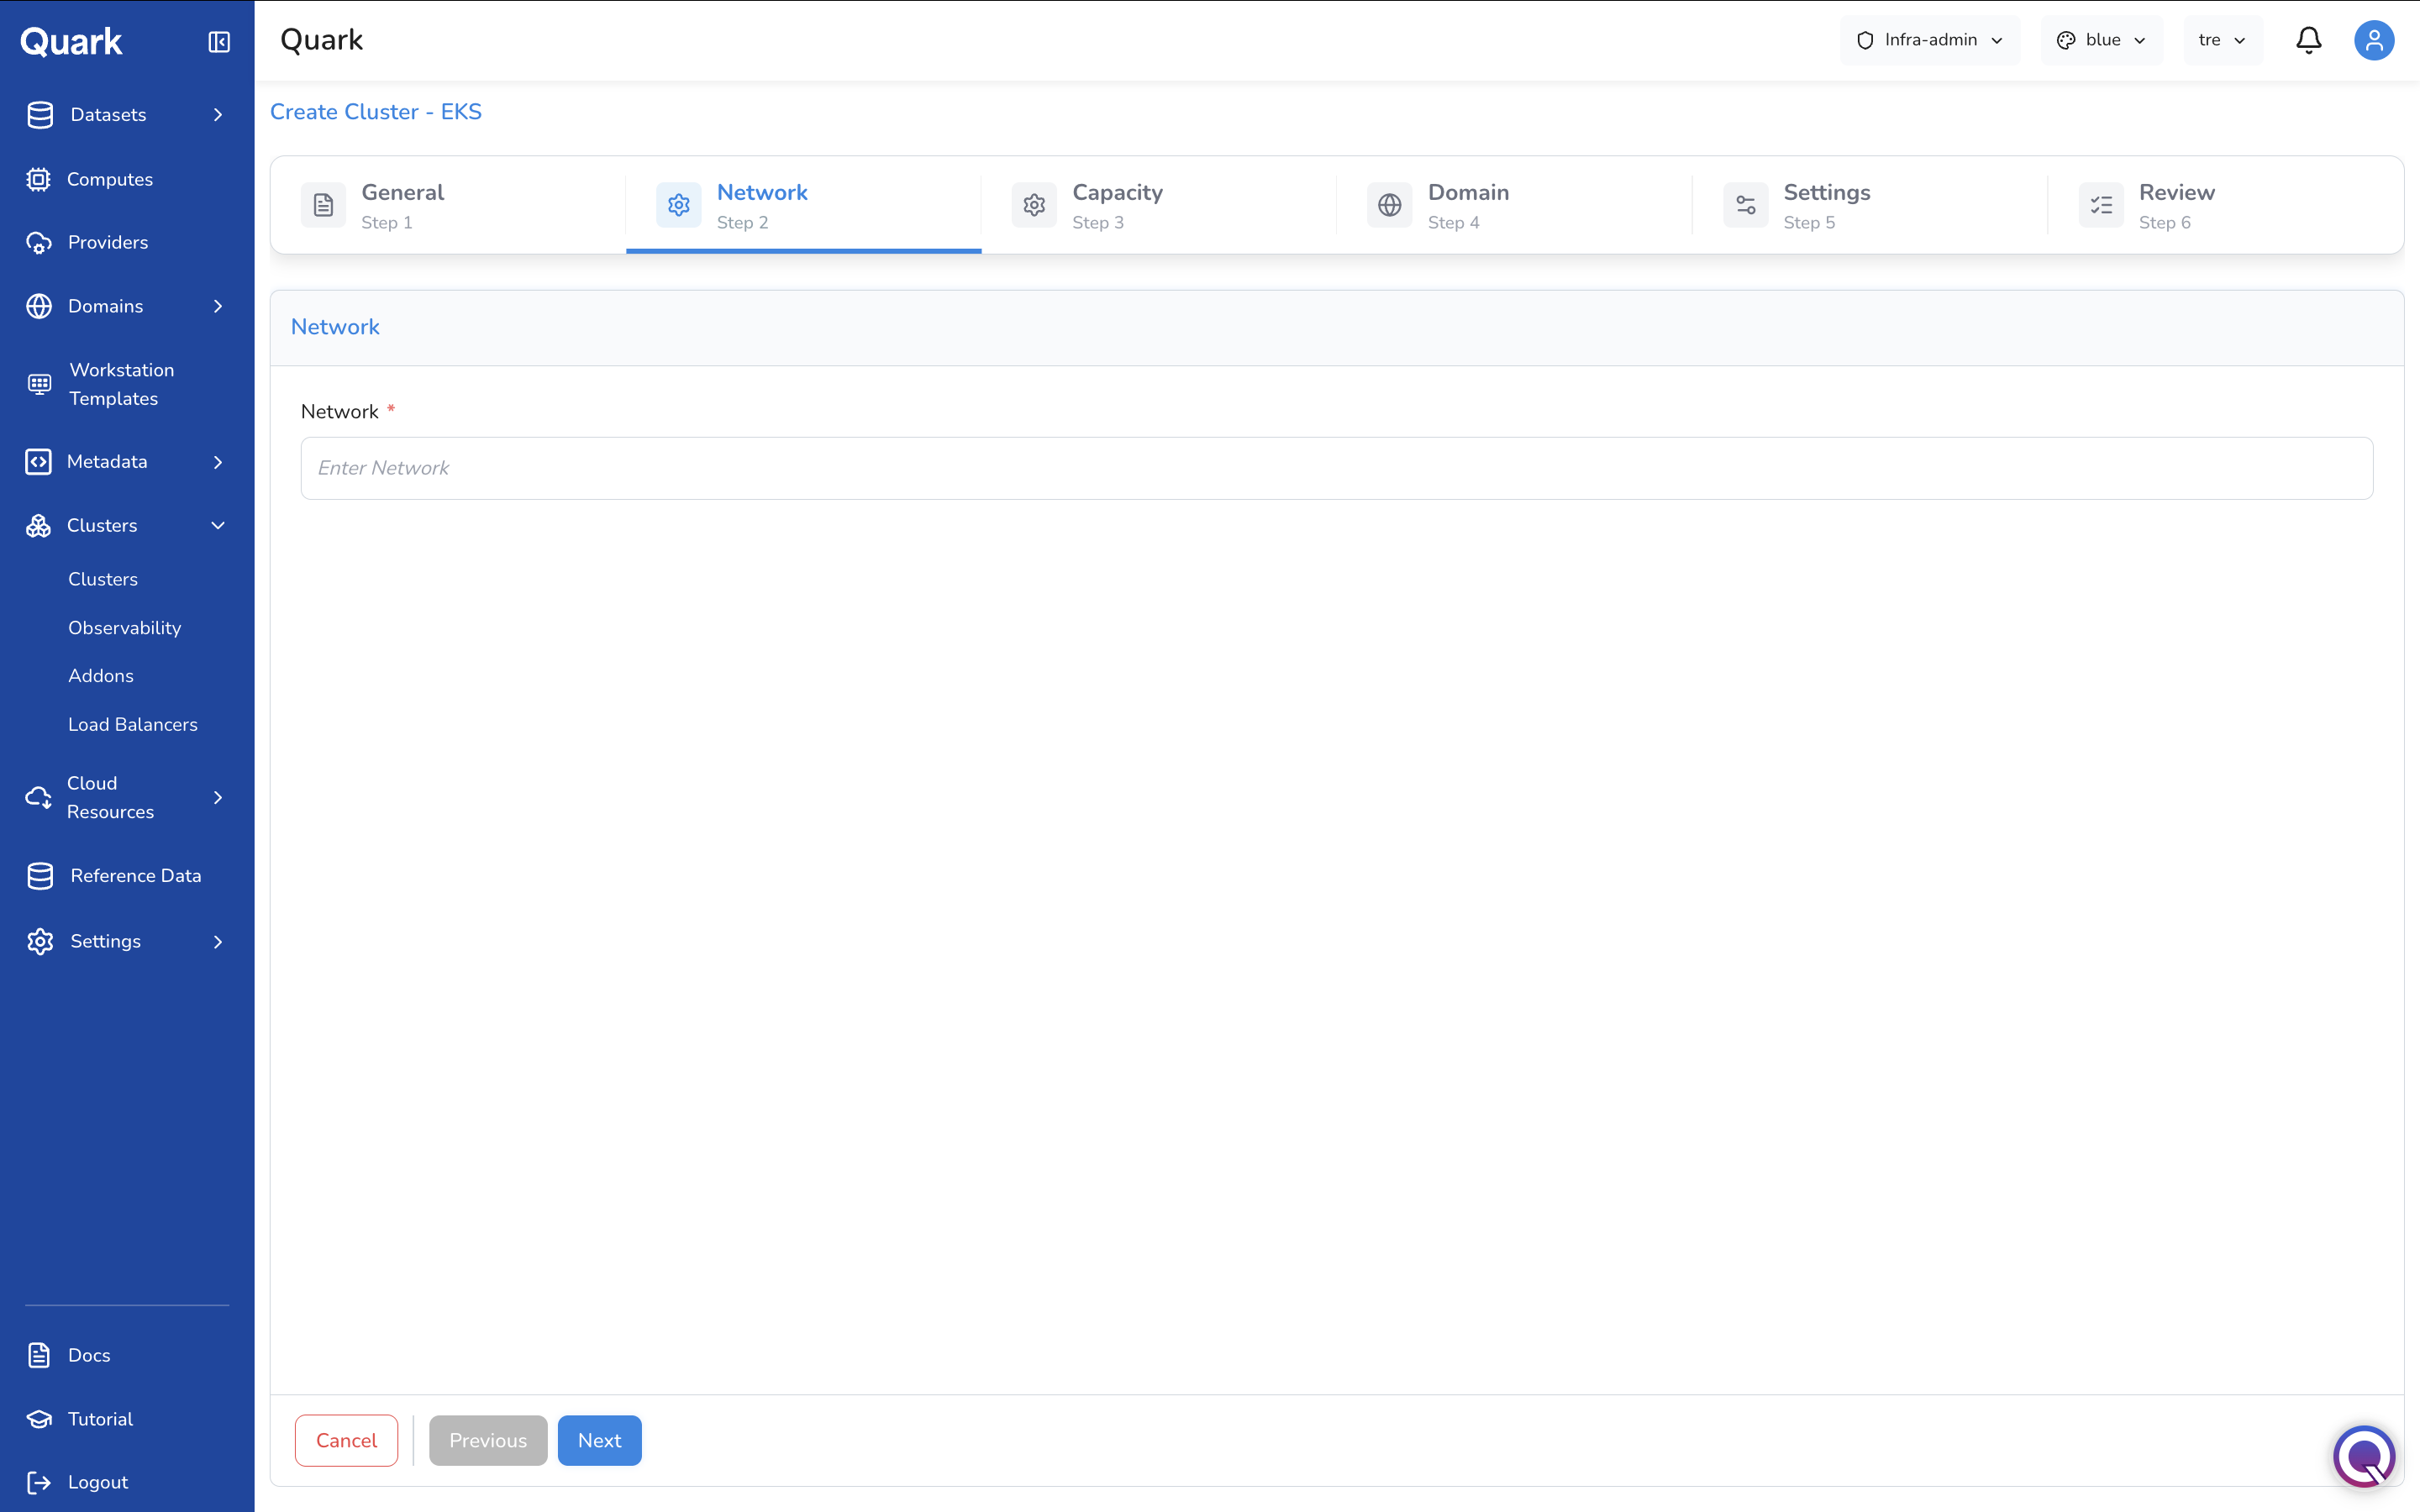
| Field | Description |
|---|---|
| Network (mandatory) | The VPC or network identifier where the cluster's nodes will be deployed. This is typically a VPC ID (e.g., vpc-0abc1234def56789a) from the cloud account selected in Step 1. The exact format depends on your cloud provider configuration. |
Step 3: Capacity
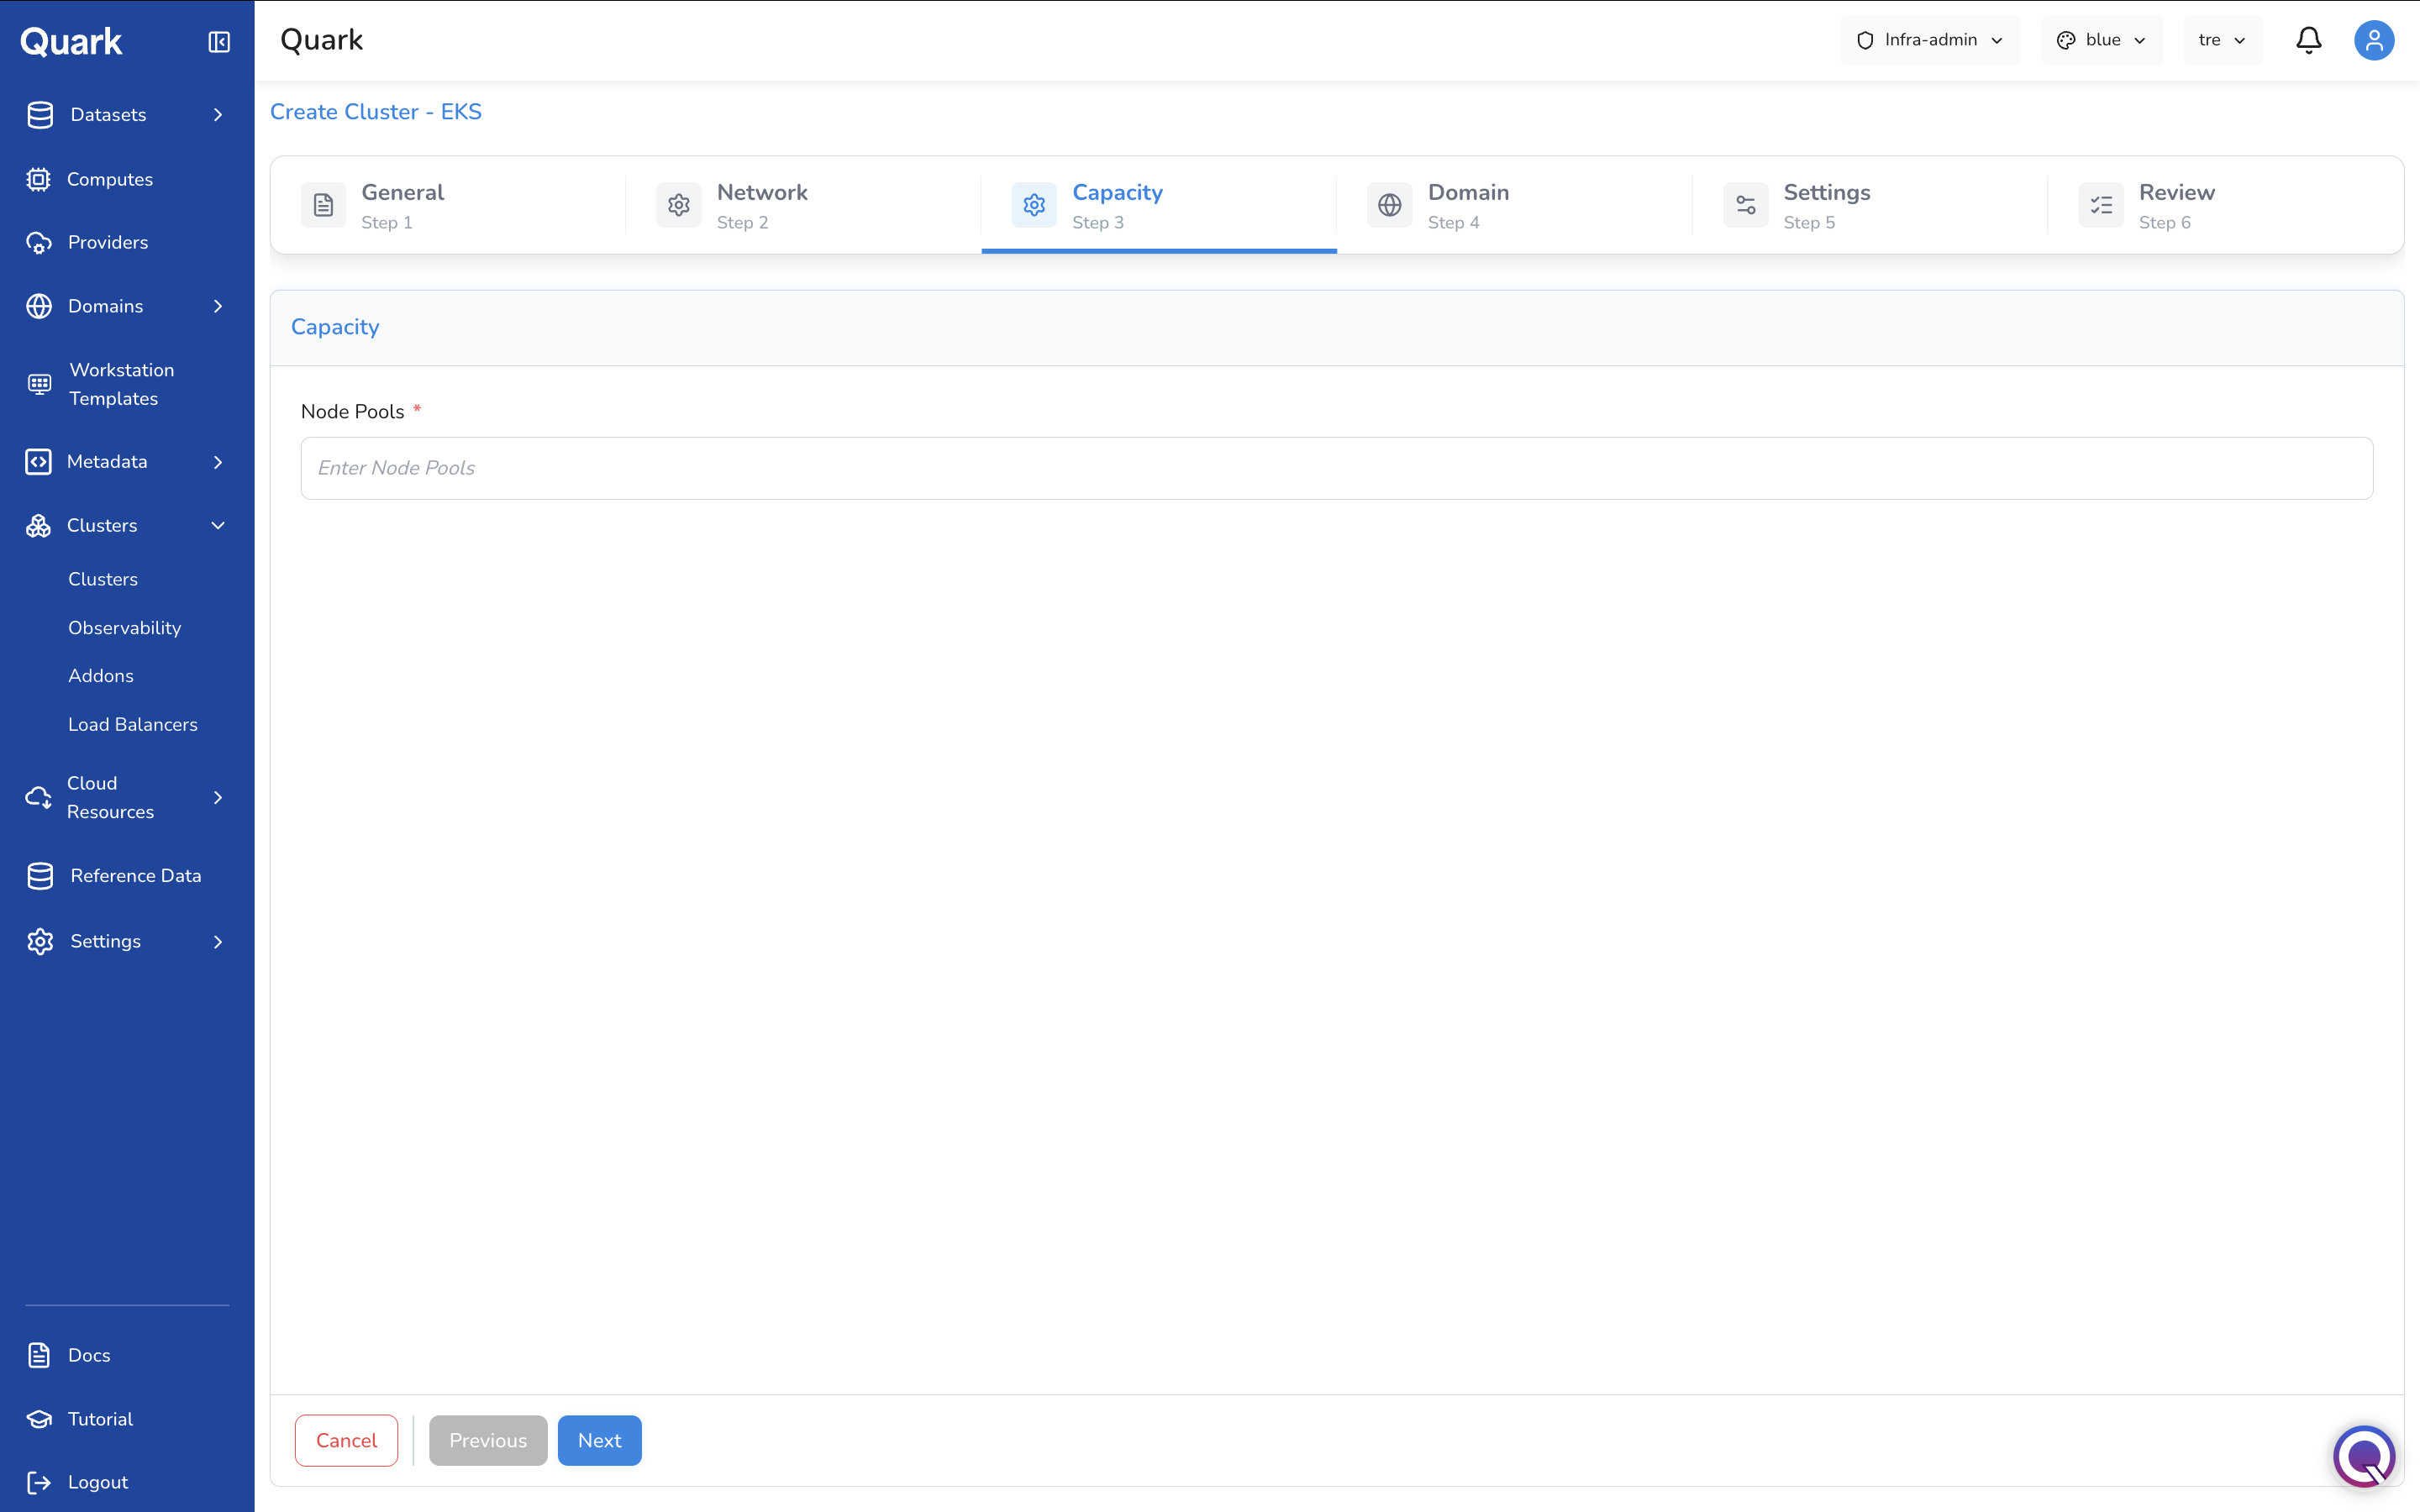
| Field | Description |
|---|---|
| Node Pools (mandatory) | The node pool or managed node group to associate with this cluster. This typically corresponds to a managed node group name or identifier in the selected AWS account. The exact format depends on your node group configuration. |
Step 4: Domain
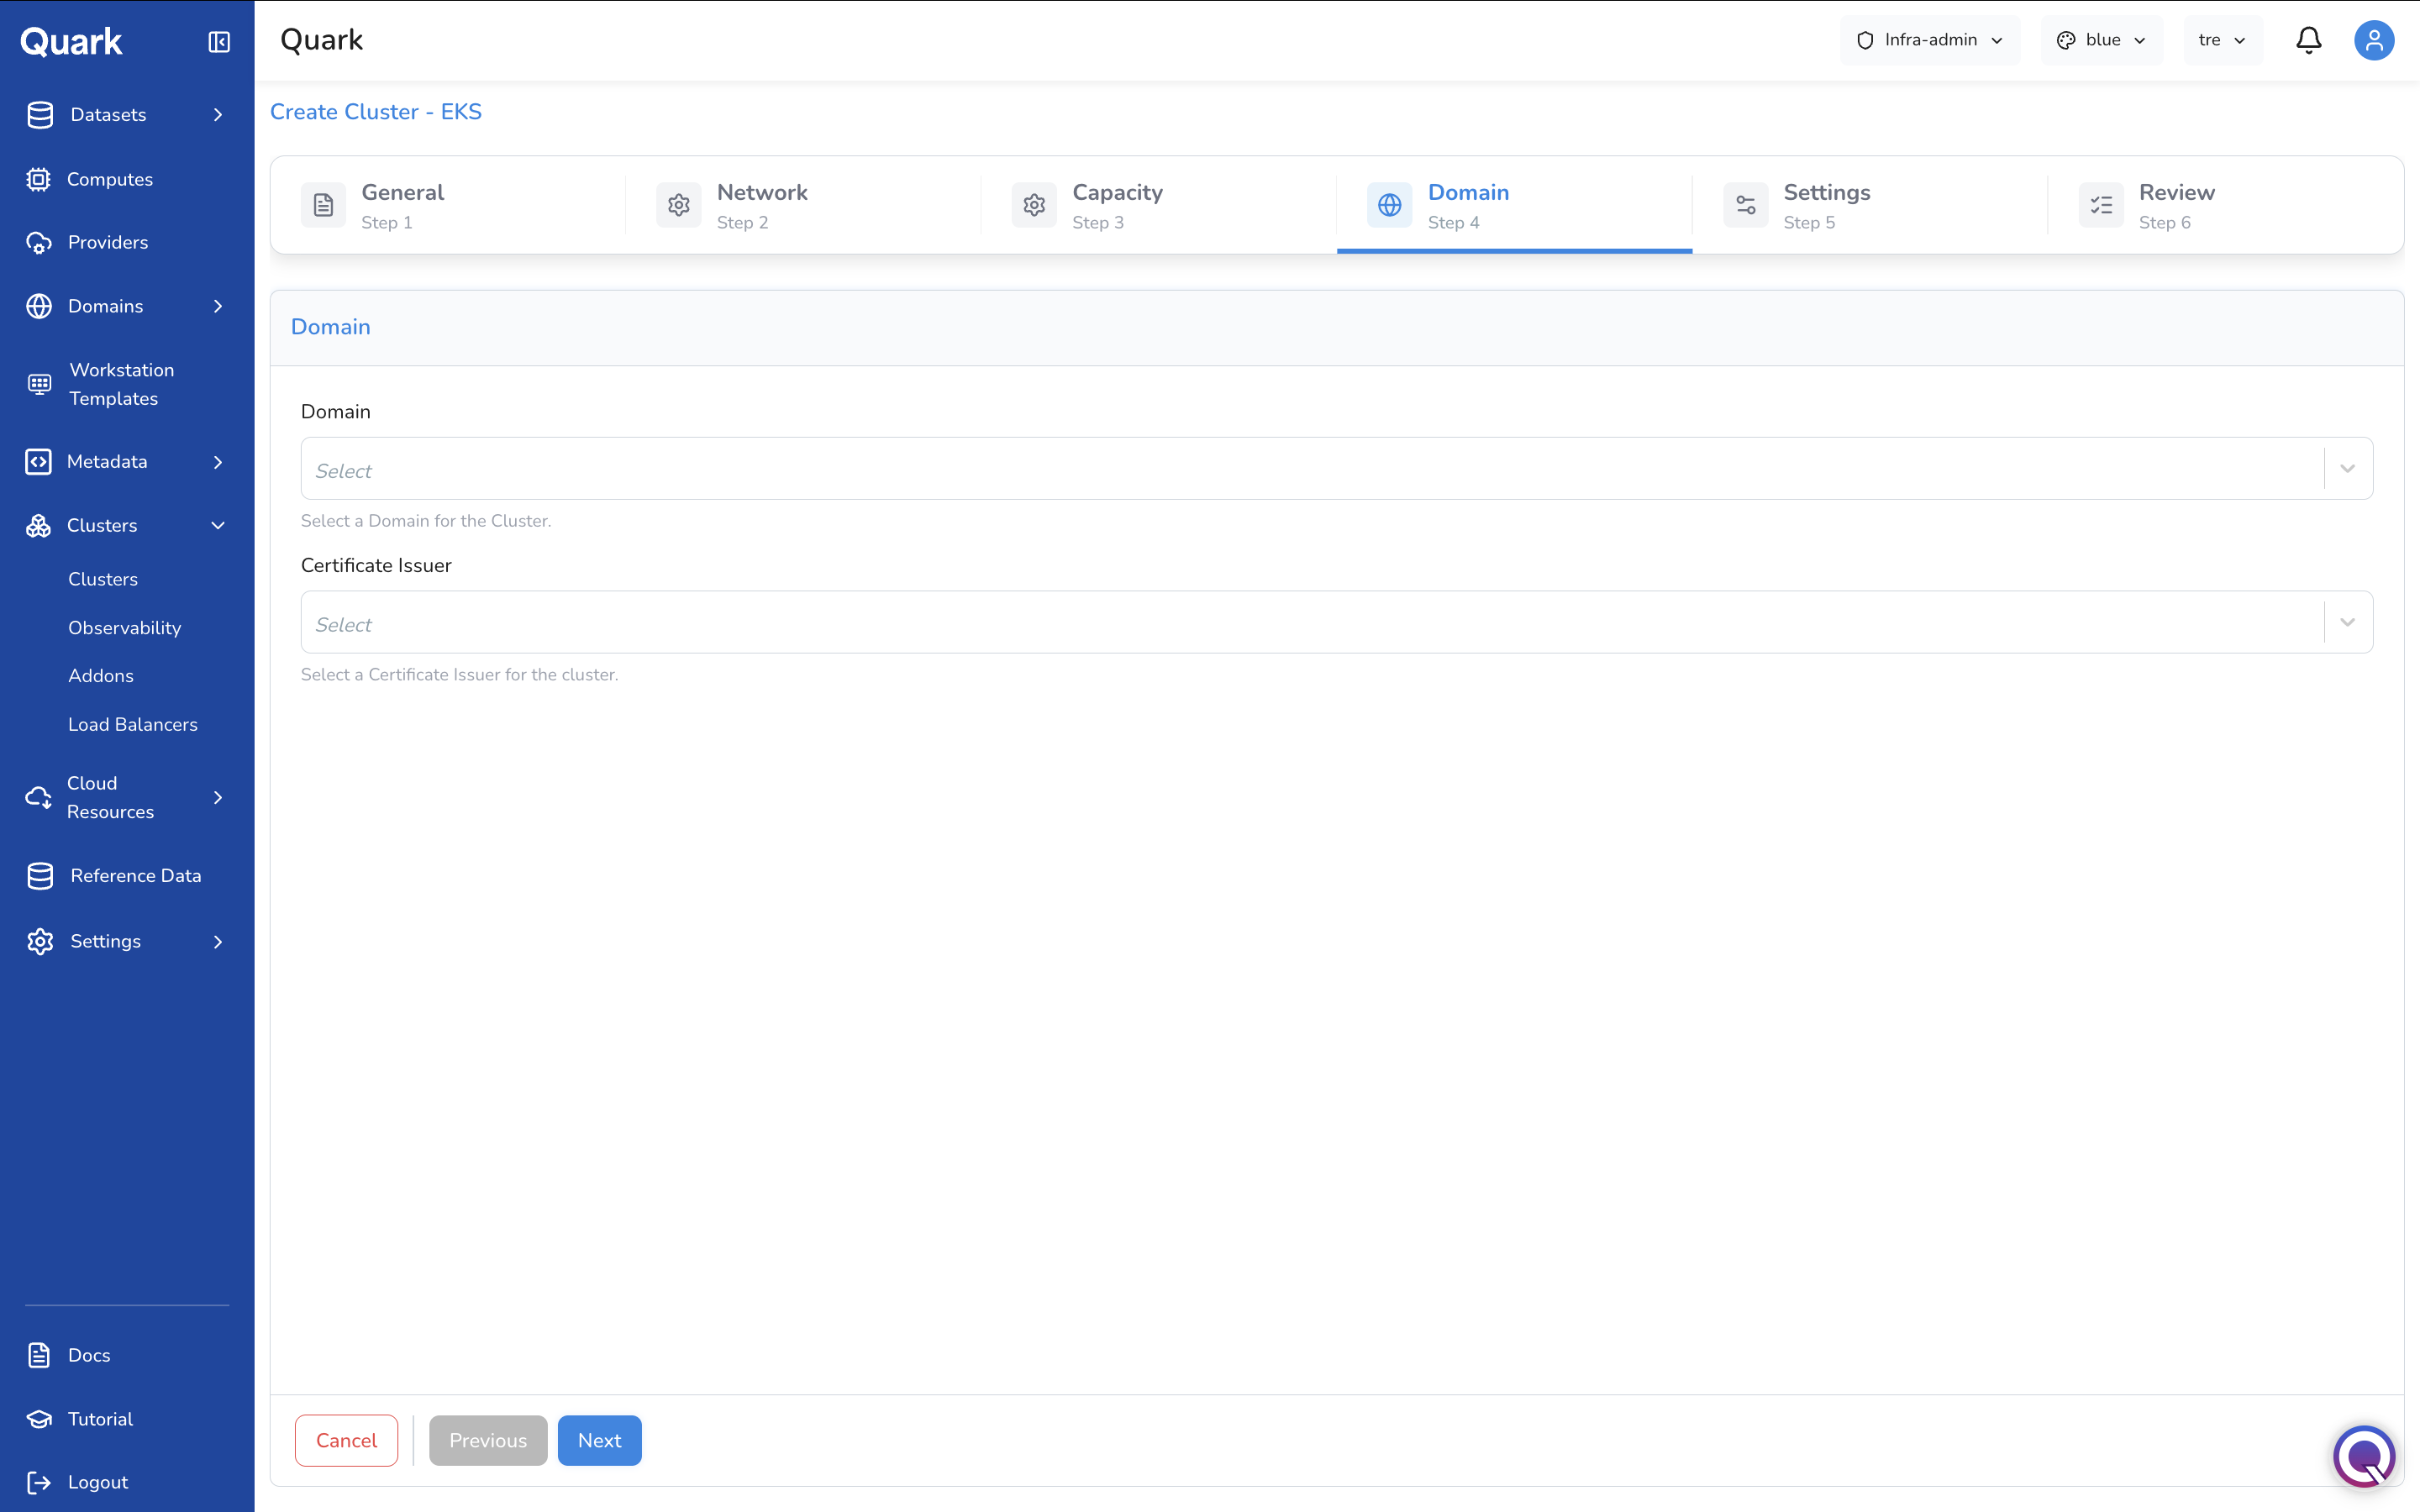
| Field | Description |
|---|---|
| Domain | The domain to associate with this cluster for platform service routing. Select from the domains registered in Domains. |
| Certificate Issuer | The certificate issuer to handle TLS for services running on this cluster. Select from the issuers configured in Domains → Certificate Issuers. |
Step 5: Settings
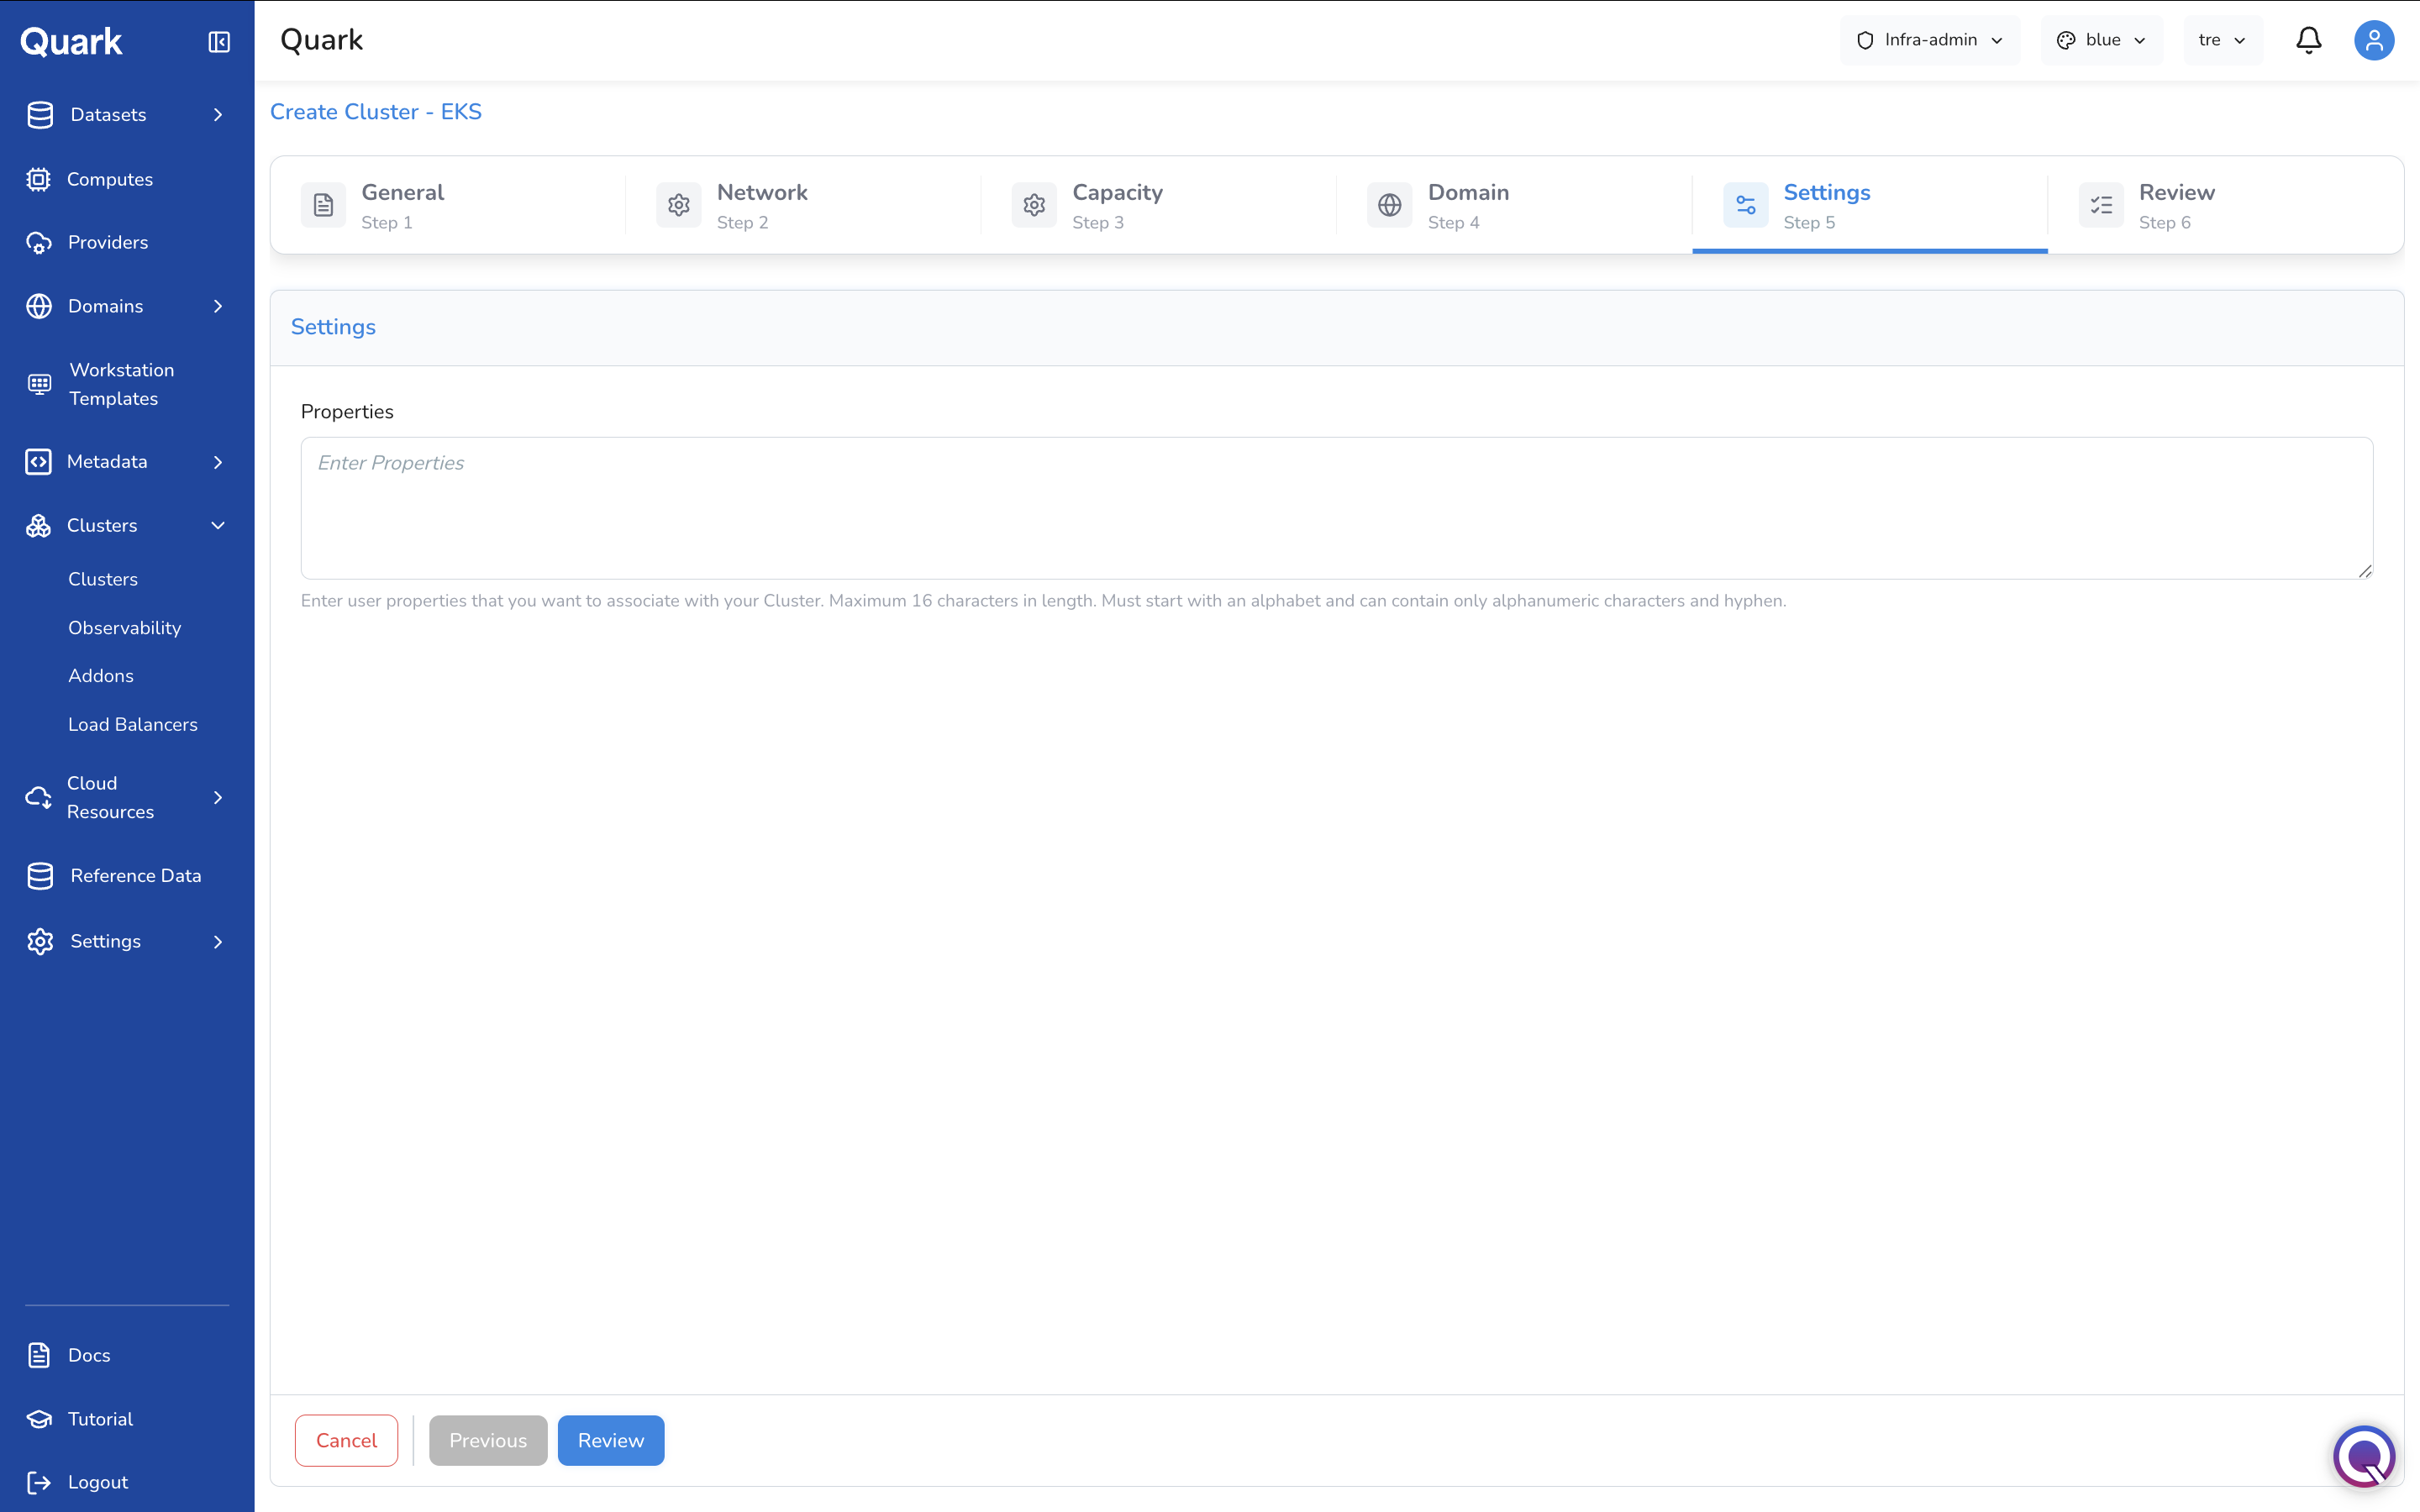
| Field | Description |
|---|---|
| Properties | Optional user-defined properties to associate with this cluster. Maximum 16 characters per property value. Must start with a letter and contain only alphanumeric characters and hyphens. |
Step 6: Review
Review all configuration details, then click Create to provision the cluster.
Observability Tab
The Observability Page
The Observability tab lists all monitoring stacks configured on the platform. Each row shows the stack name, its Status, Sync state, the Cluster it monitors, and creation metadata.
Adding an Observability Stack
- Navigate to the Observability tab.
- Click + Add New.
-
The Create Observability Stack modal appears with the available stack types.
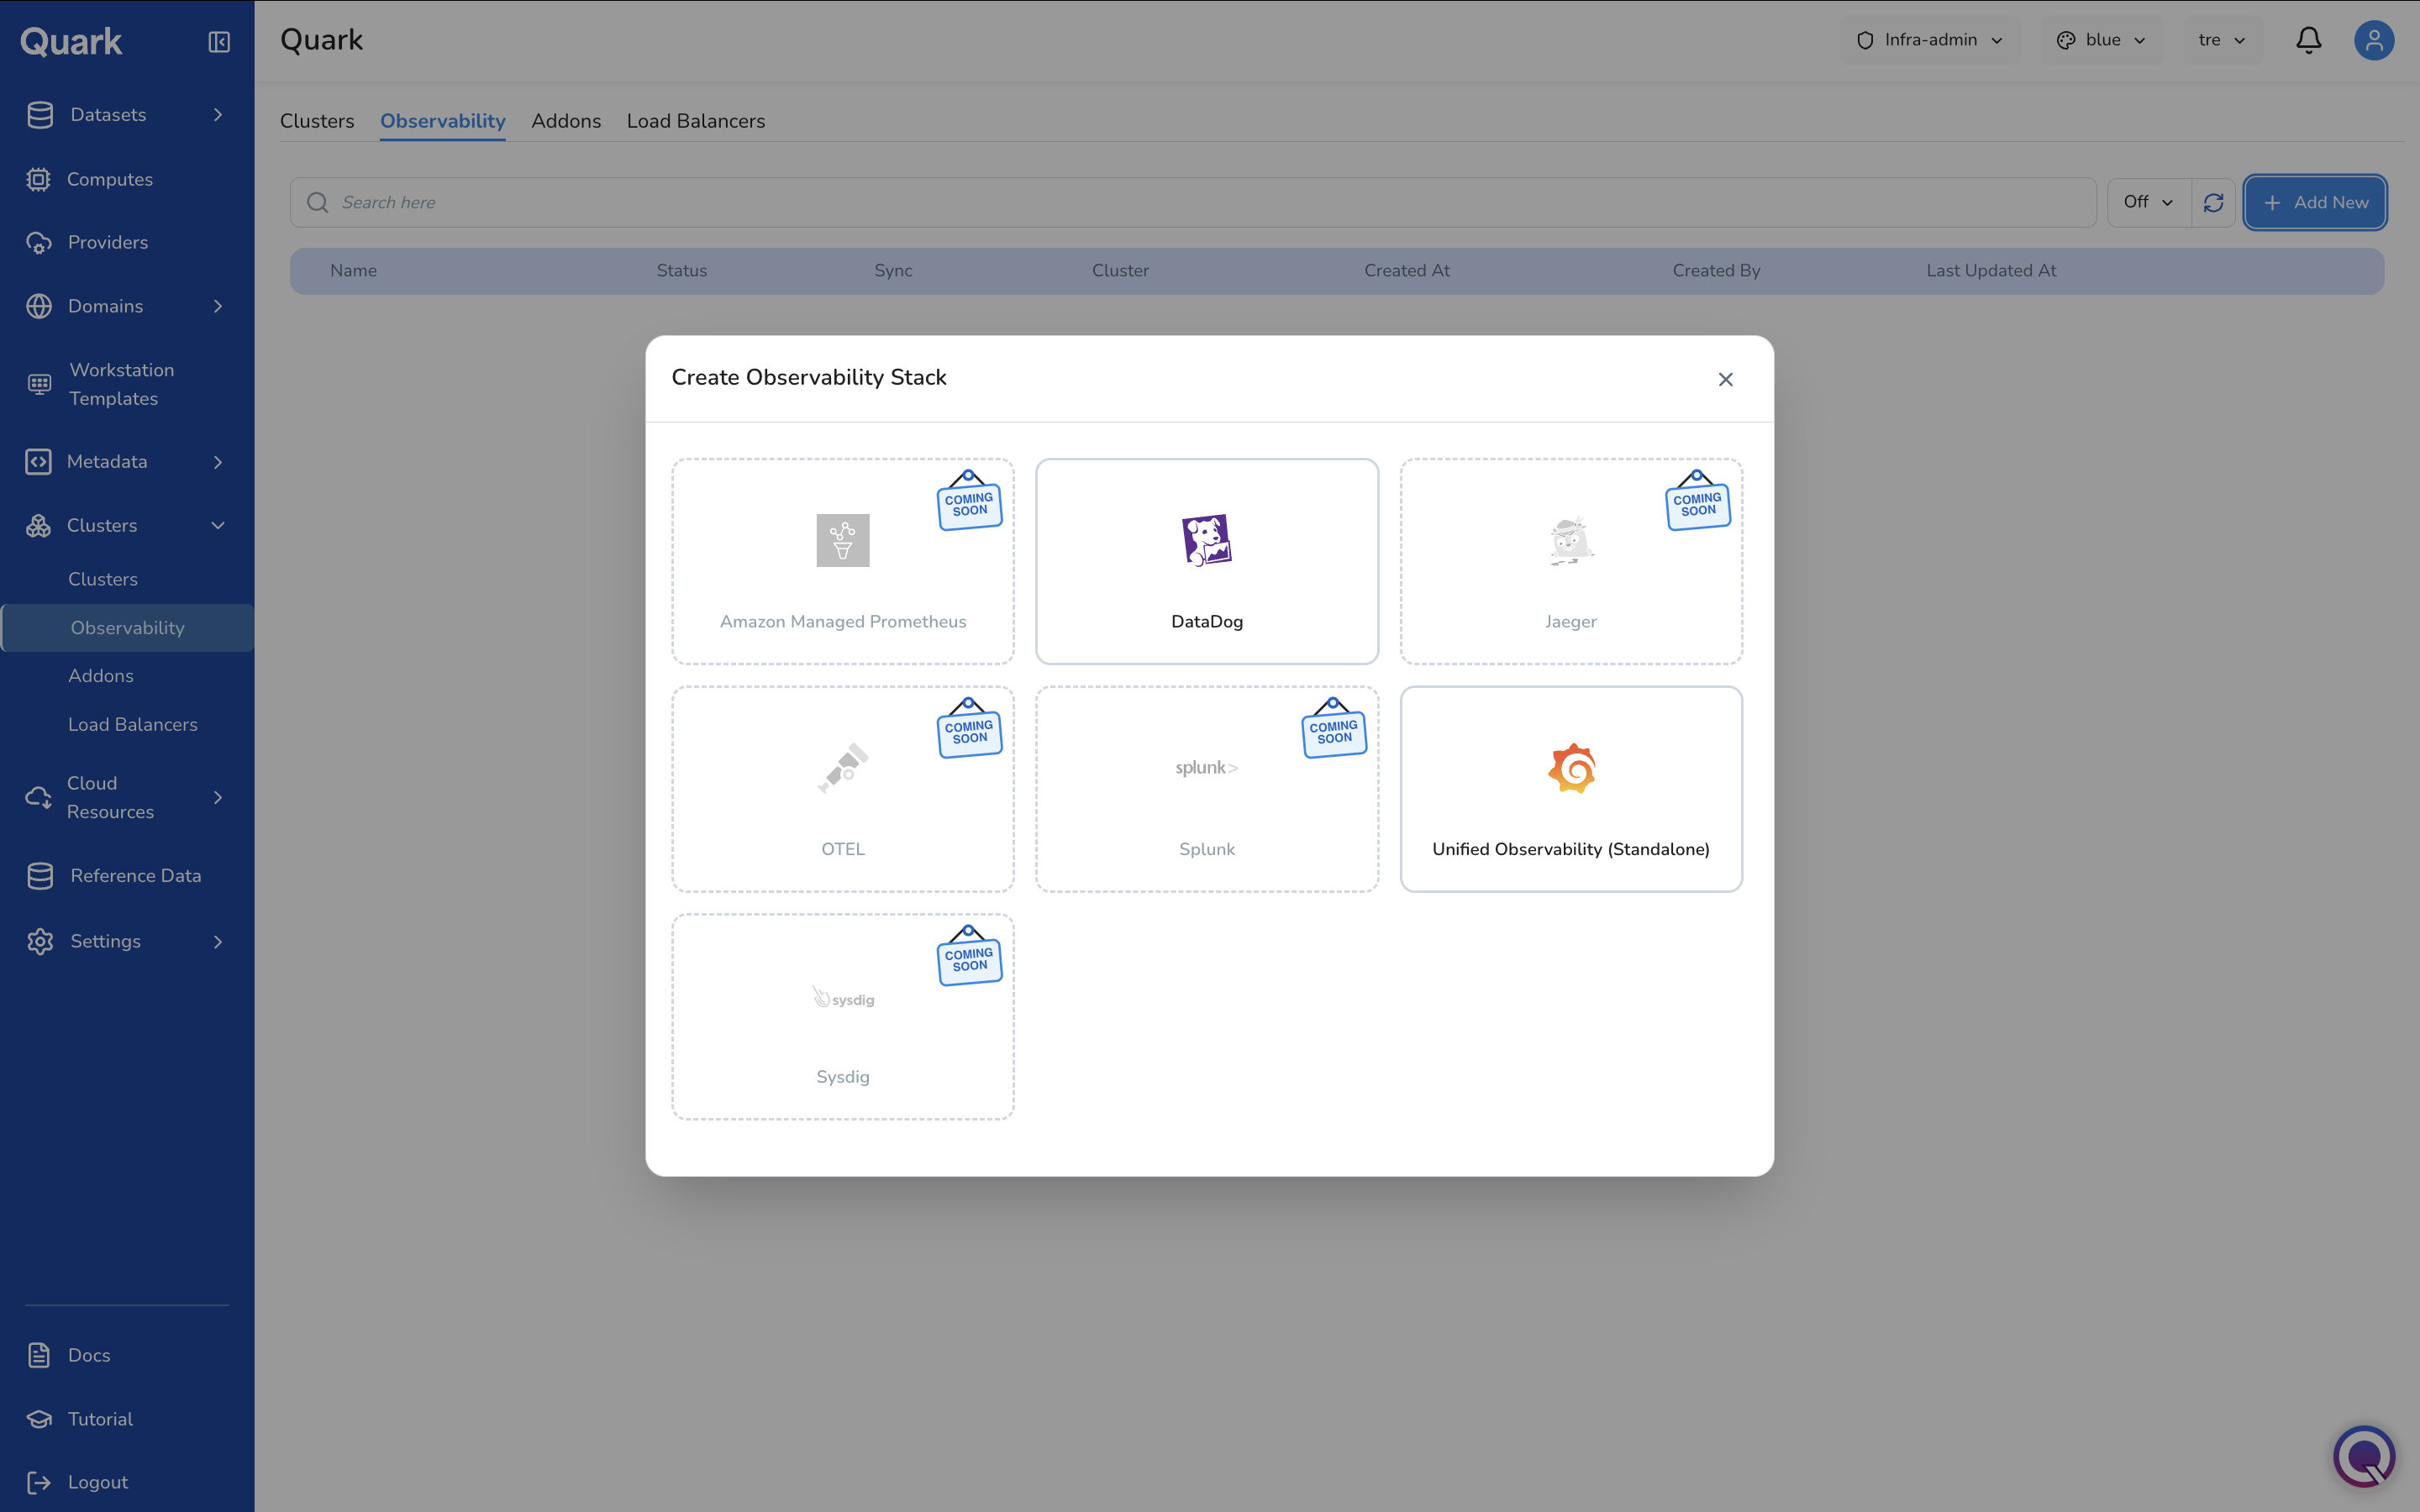
Currently available stack types:
Type Description DataDog Connects a DataDog monitoring account to receive metrics, logs, and traces from the cluster via the DataDog Operator. Requires a DataDog API key registered as a Provider. Unified Observability (Standalone) A self-contained observability stack deployed directly on the cluster, without an external monitoring platform dependency. Note: Additional stack types — including Amazon Managed Prometheus, Jaeger, OTEL, Splunk, and Sysdig — are currently in development and will be available in a future release.
-
Select the desired stack type. The wizard opens for that type.
The example below walks through creating a DataDog observability stack, which has four steps: General → Credentials → Values → Review.
Step 1: General
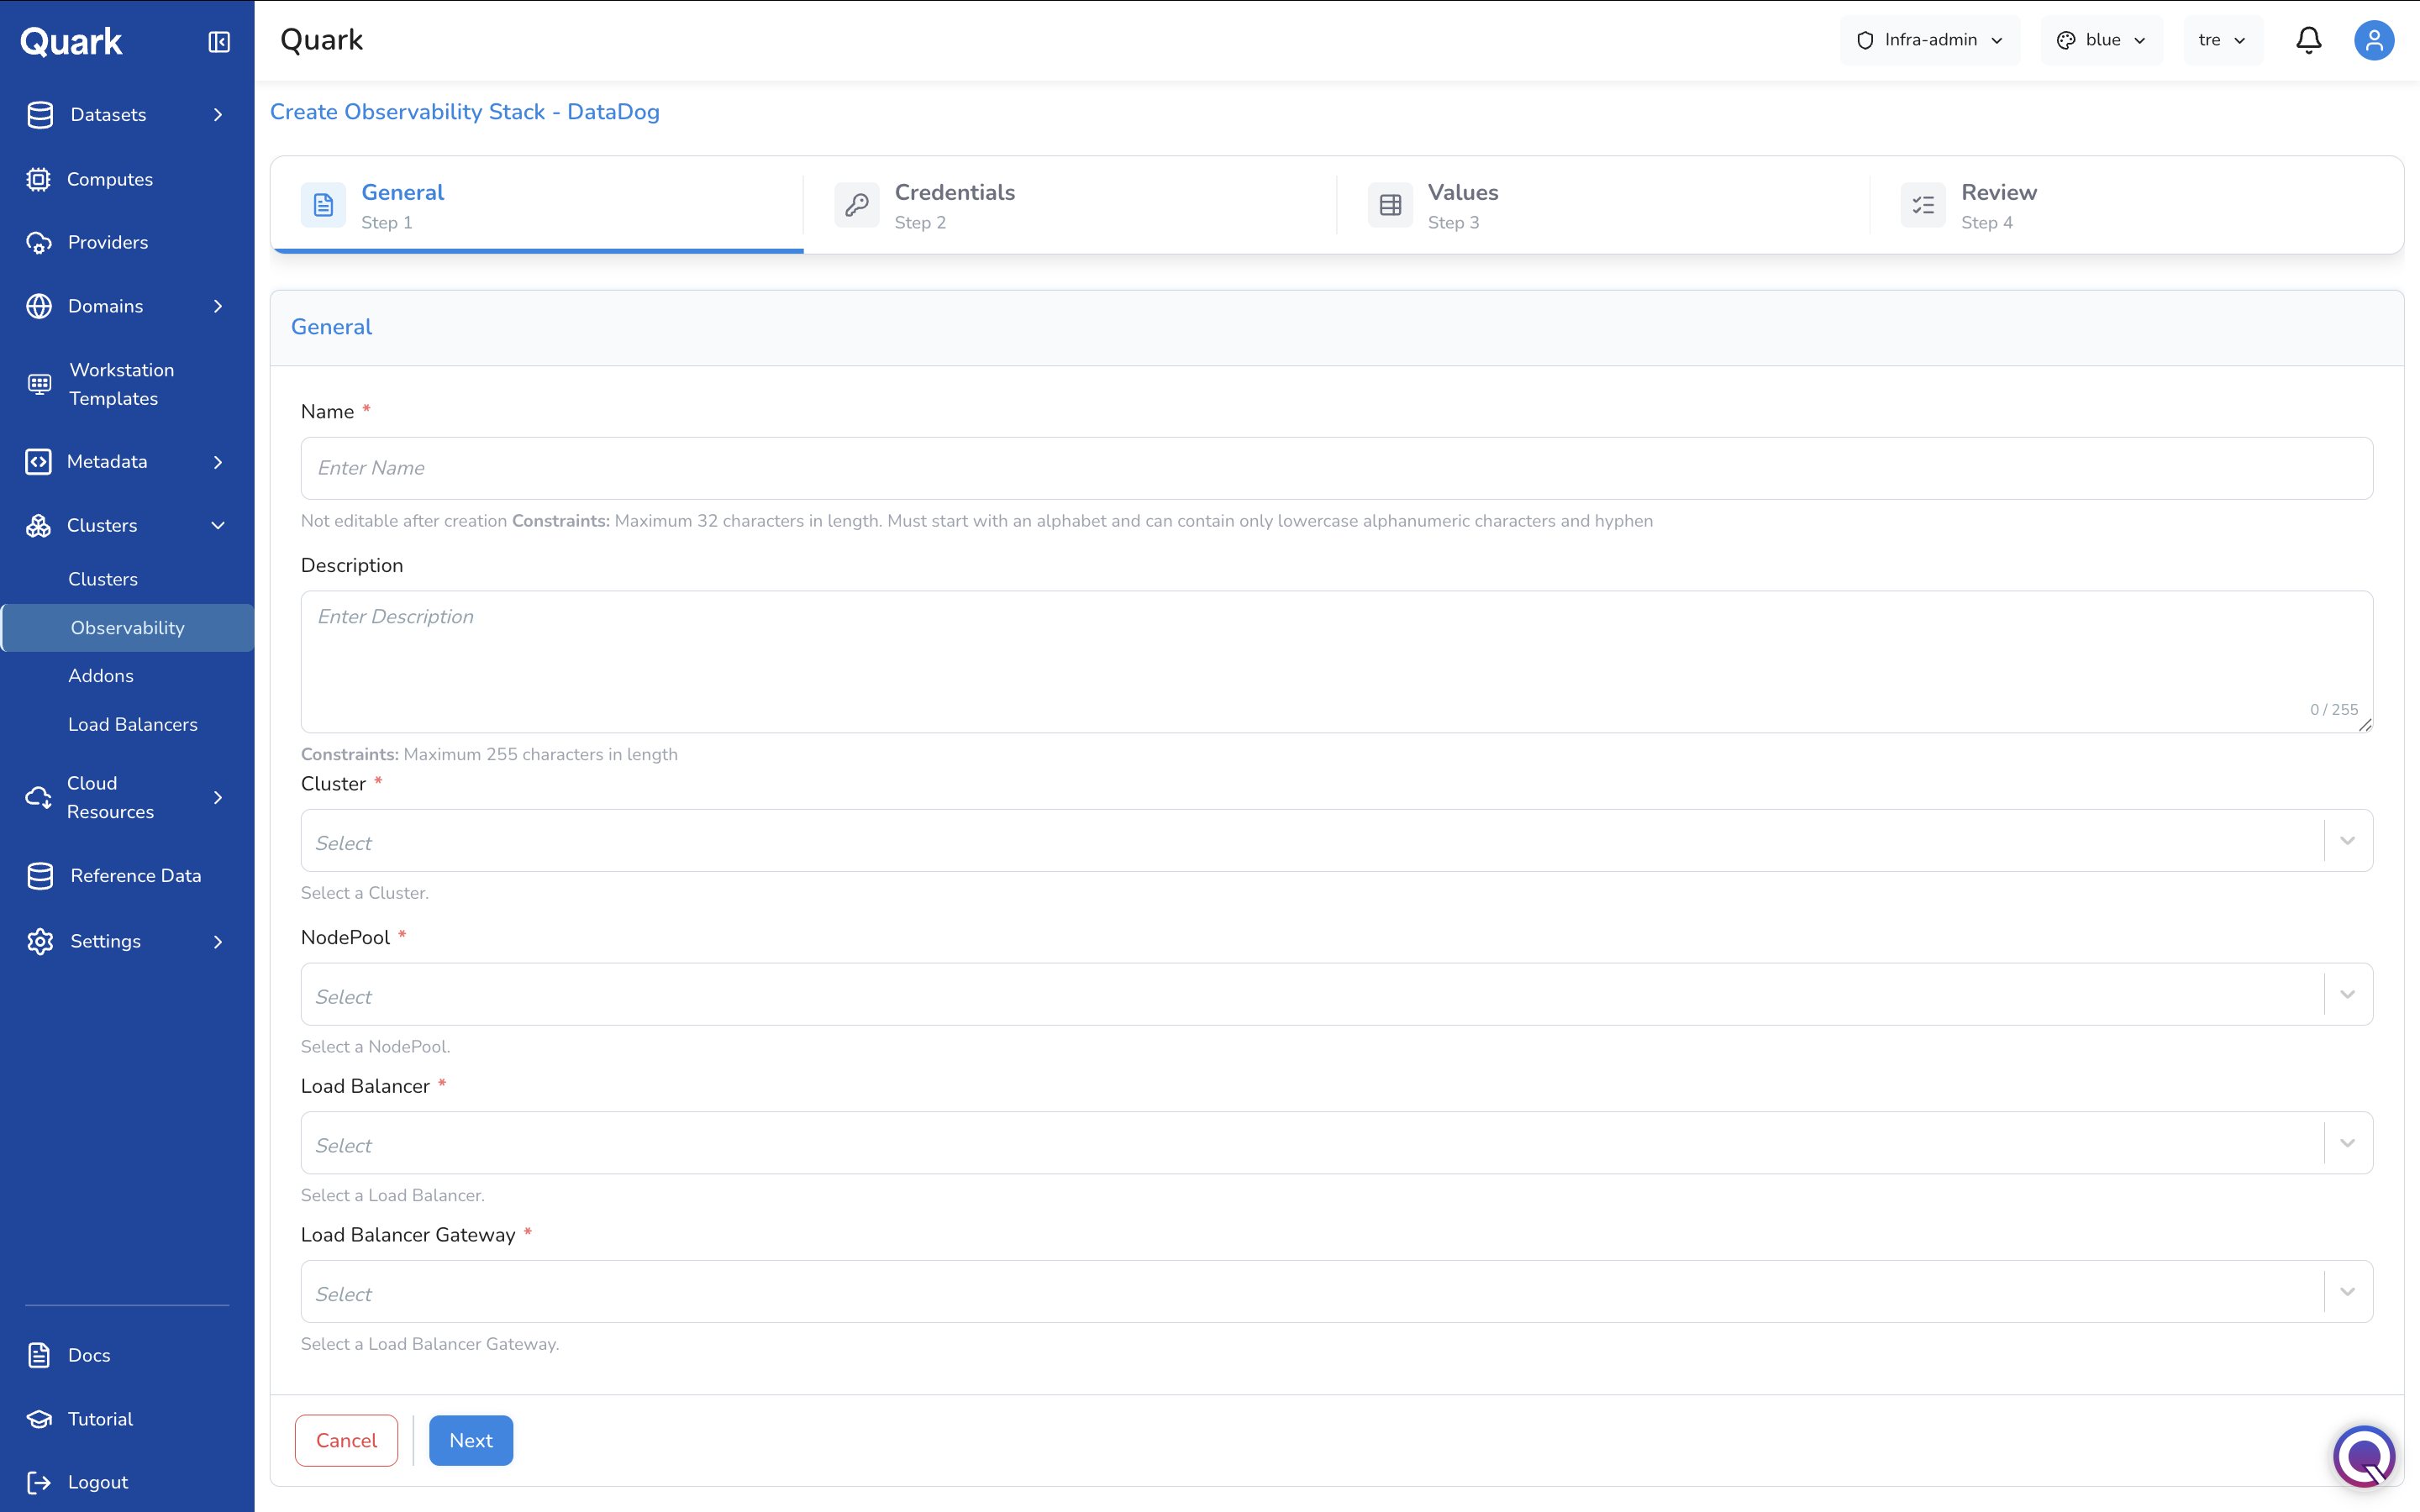
| Field | Description |
|---|---|
| Name (mandatory) | A unique name for this observability stack. Maximum 32 characters, lowercase alphanumeric and hyphens, not editable after creation. |
| Description | An optional description. Maximum 255 characters. |
| Cluster (mandatory) | The cluster this observability stack will monitor. |
| NodePool (mandatory) | The node pool within the cluster where the observability stack components will be deployed. |
| Load Balancer (mandatory) | The load balancer that will route traffic to the observability stack's endpoints. |
| Load Balancer Gateway (mandatory) | The gateway within the load balancer to use for routing observability traffic. |
Step 2: Credentials
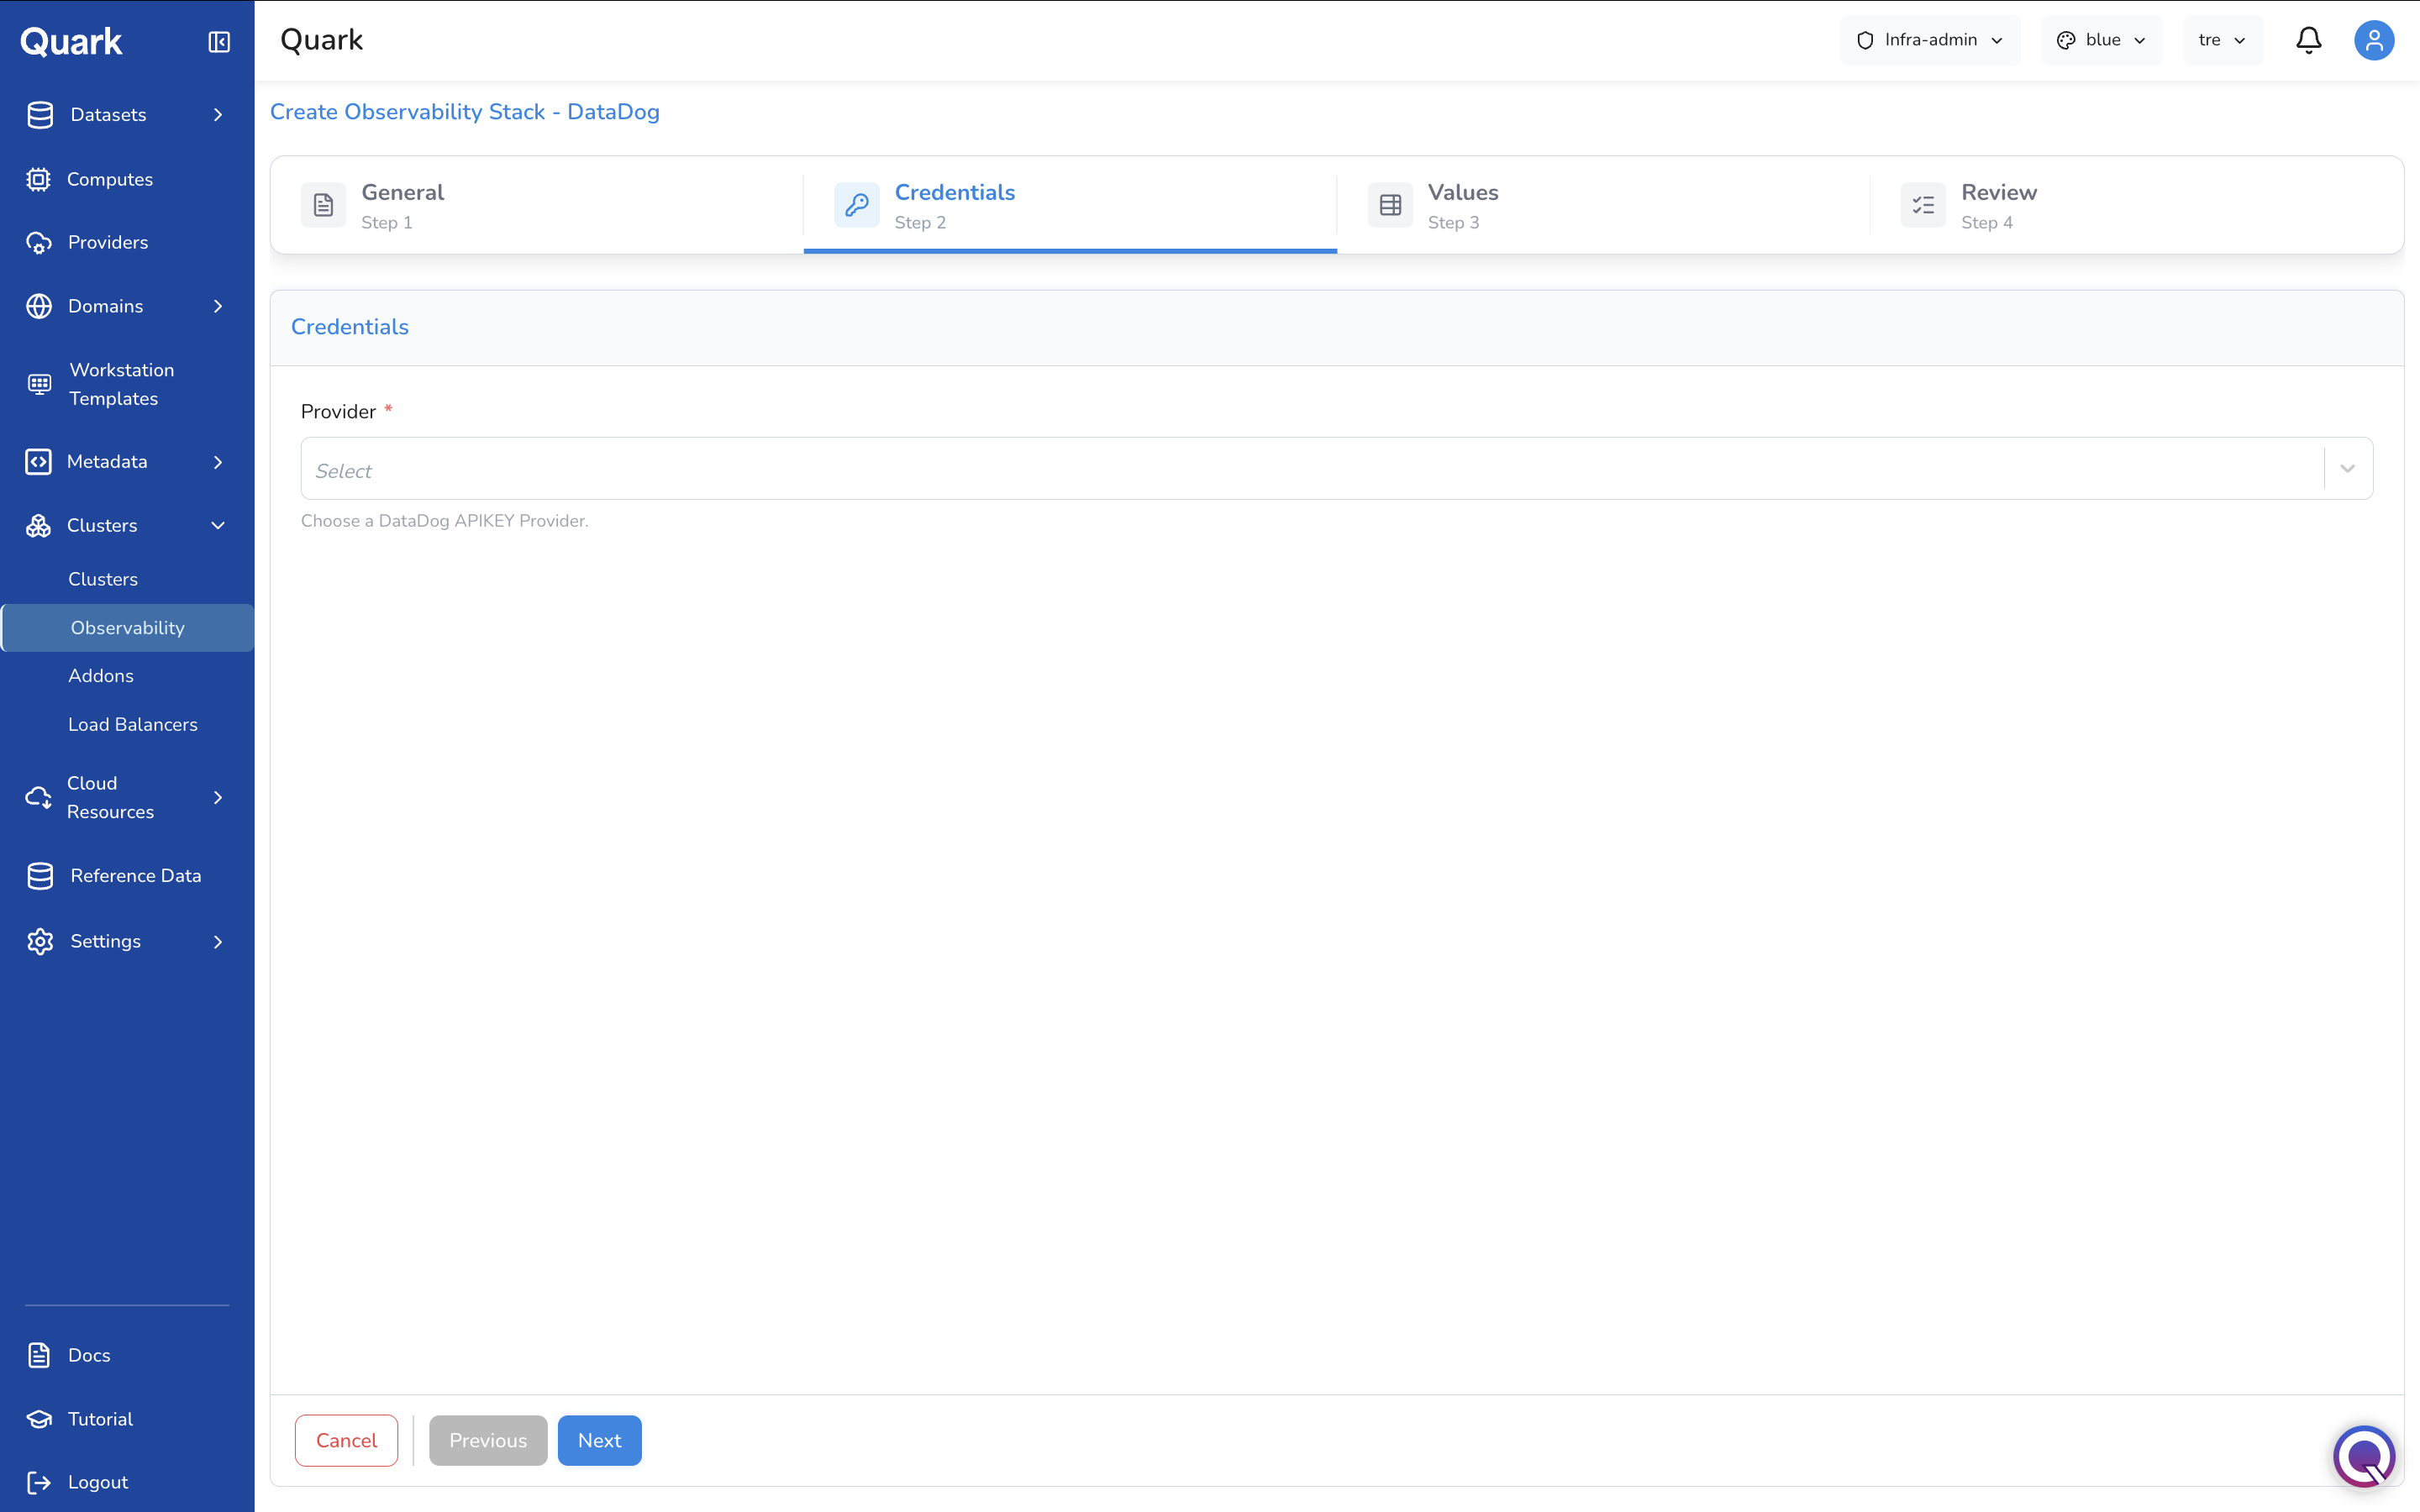
| Field | Description |
|---|---|
| Provider (mandatory) | The DataDog API key credential registered in Providers. This credential authenticates the cluster's DataDog agent with your DataDog account. |
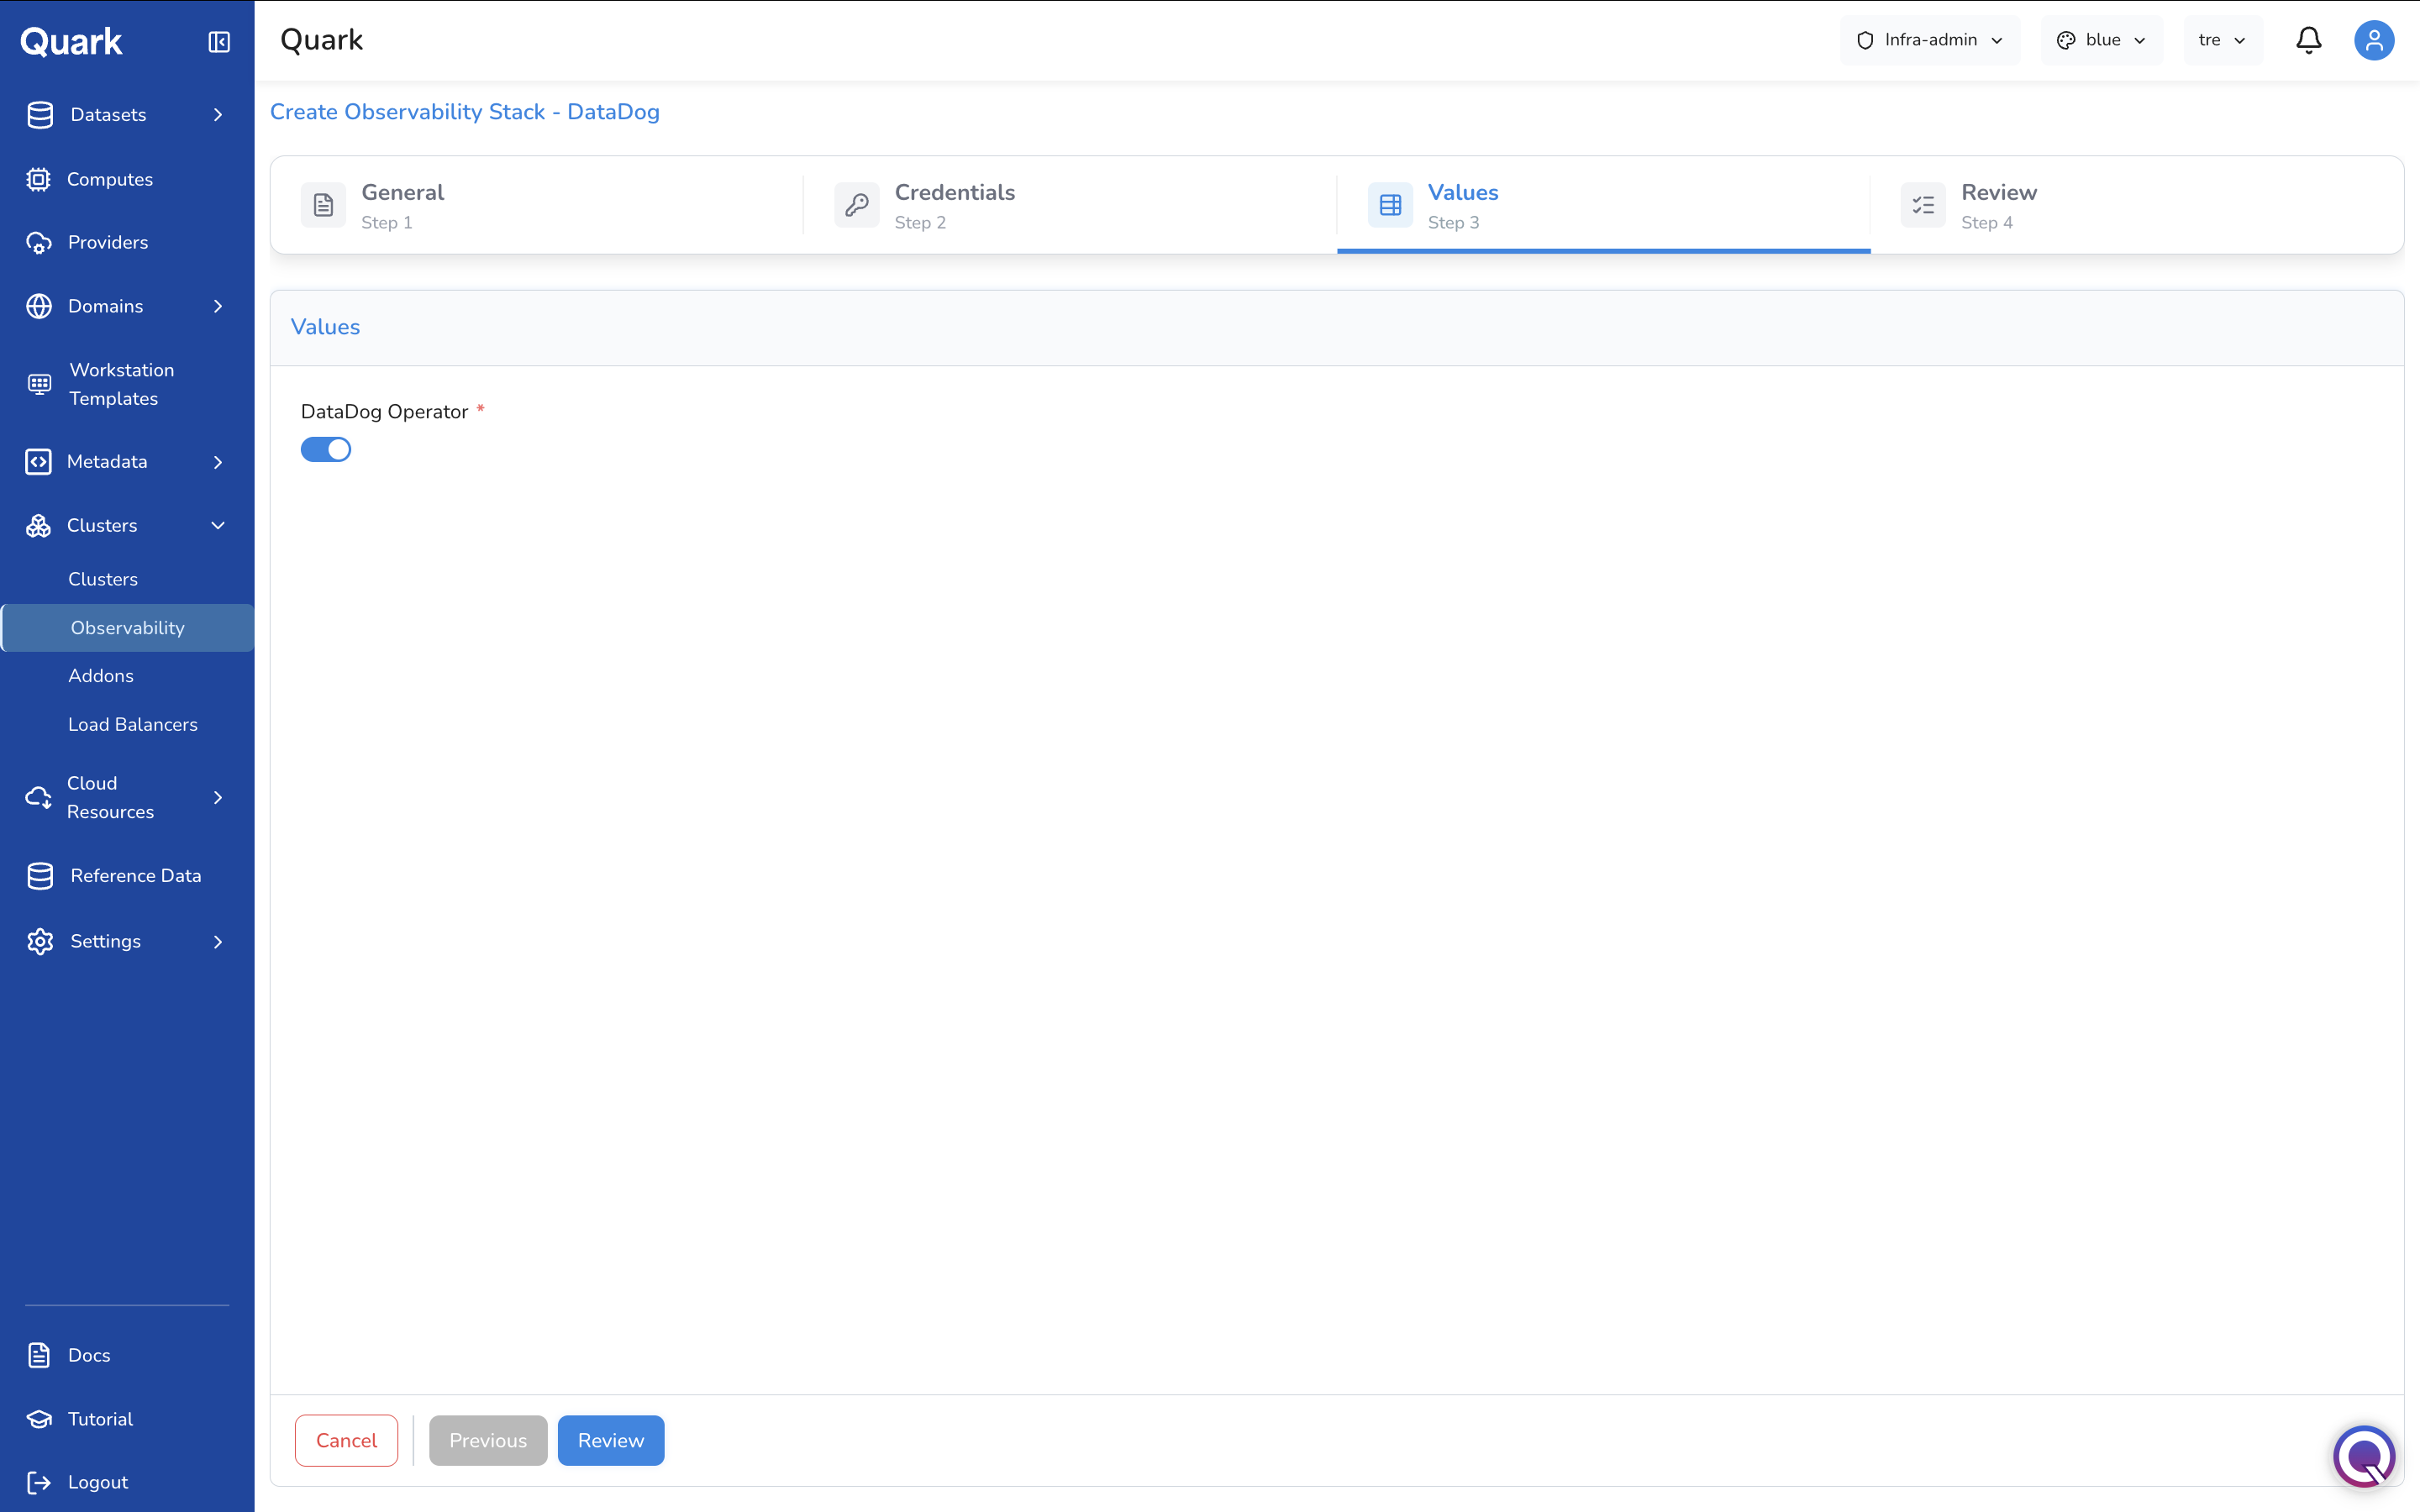
Step 3: Values
| Field | Description |
|---|---|
| DataDog Operator (mandatory) | Toggle to enable the DataDog Operator on the cluster. The Operator manages the DataDog agent deployment and lifecycle. Enabled by default. |
Step 4: Review
Review all configuration, then click Create to deploy the observability stack.
Addons Tab
The Addons Page
The Addons tab lists all add-ons installed on platform clusters. Each row shows the add-on name, its Status, Sync state, the Cluster it is installed on, and creation metadata.
Adding an Addon
- Navigate to the Addons tab.
- Click + Add New.
-
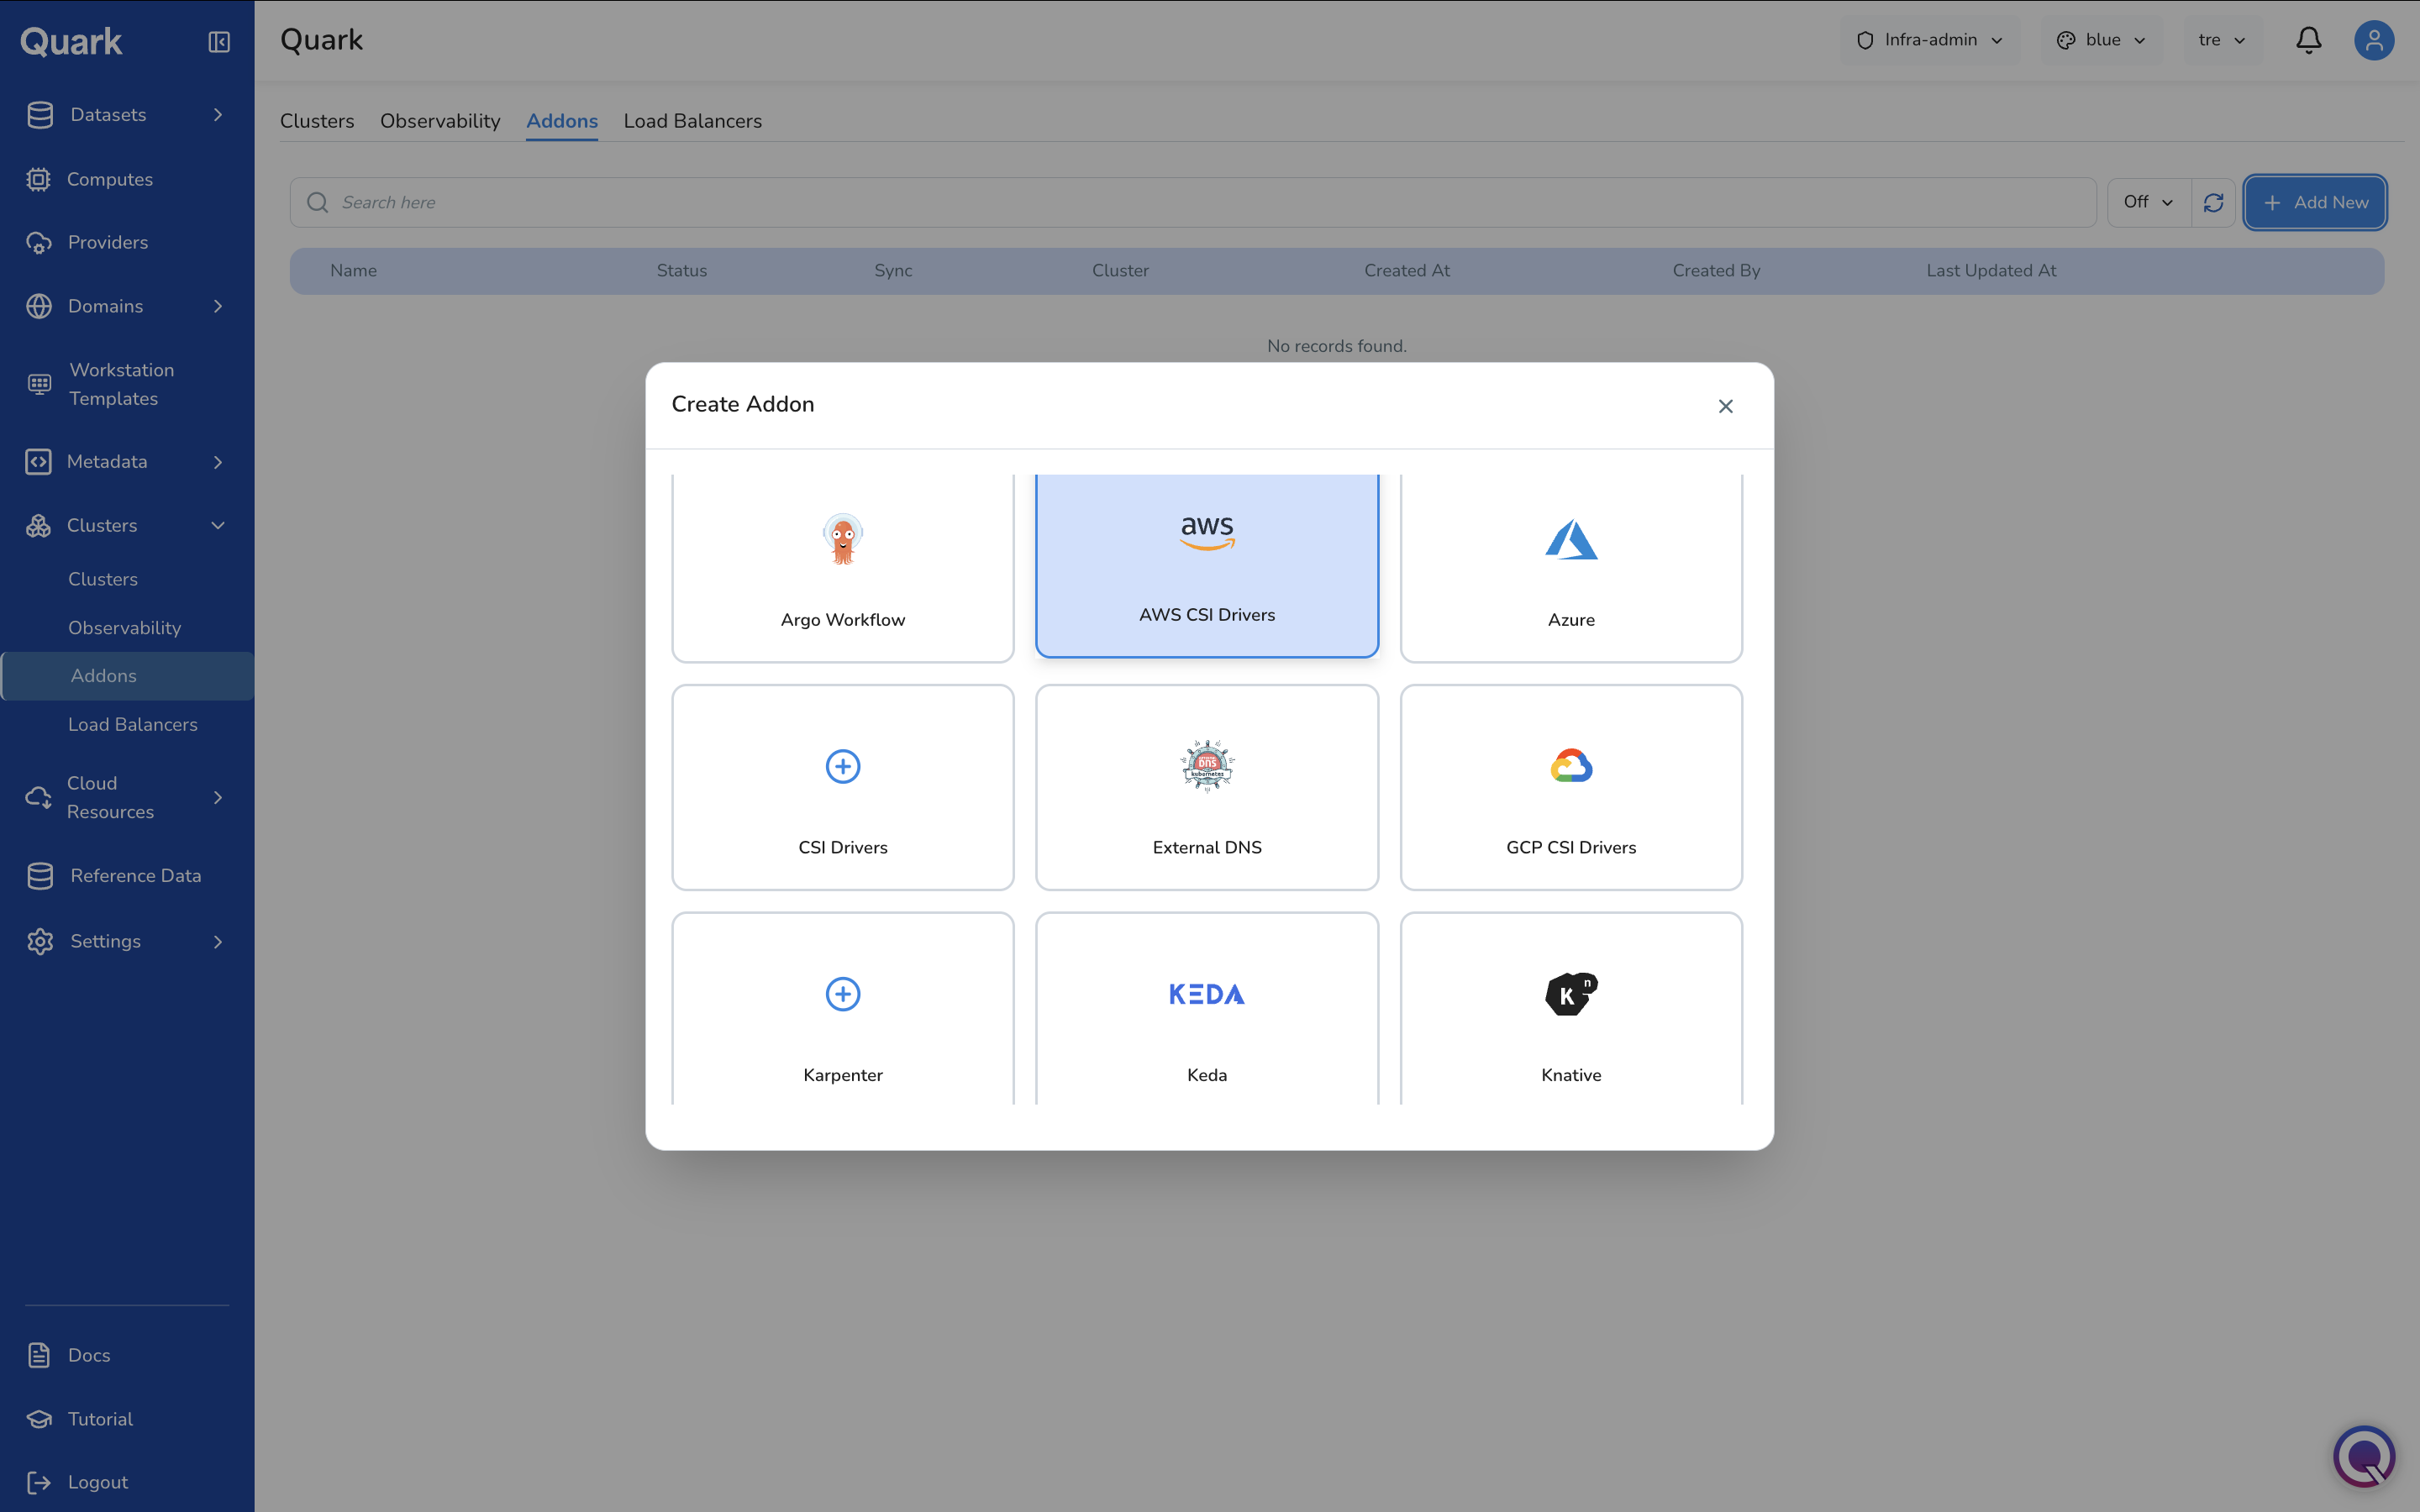
The Create Addon modal appears with available add-on types.
Available add-on types include Argo Workflow, AWS CSI Drivers, Azure, CSI Drivers, External DNS, GCP CSI Drivers, Karpenter, Keda, Knative, and others. Each add-on extends cluster functionality for a specific purpose — storage drivers, autoscaling, workflow orchestration, DNS management, and more.
-
Select the desired add-on type. The wizard opens for that type.
The example below walks through creating an AWS CSI Drivers add-on, which has three steps: General → CSI → Review.
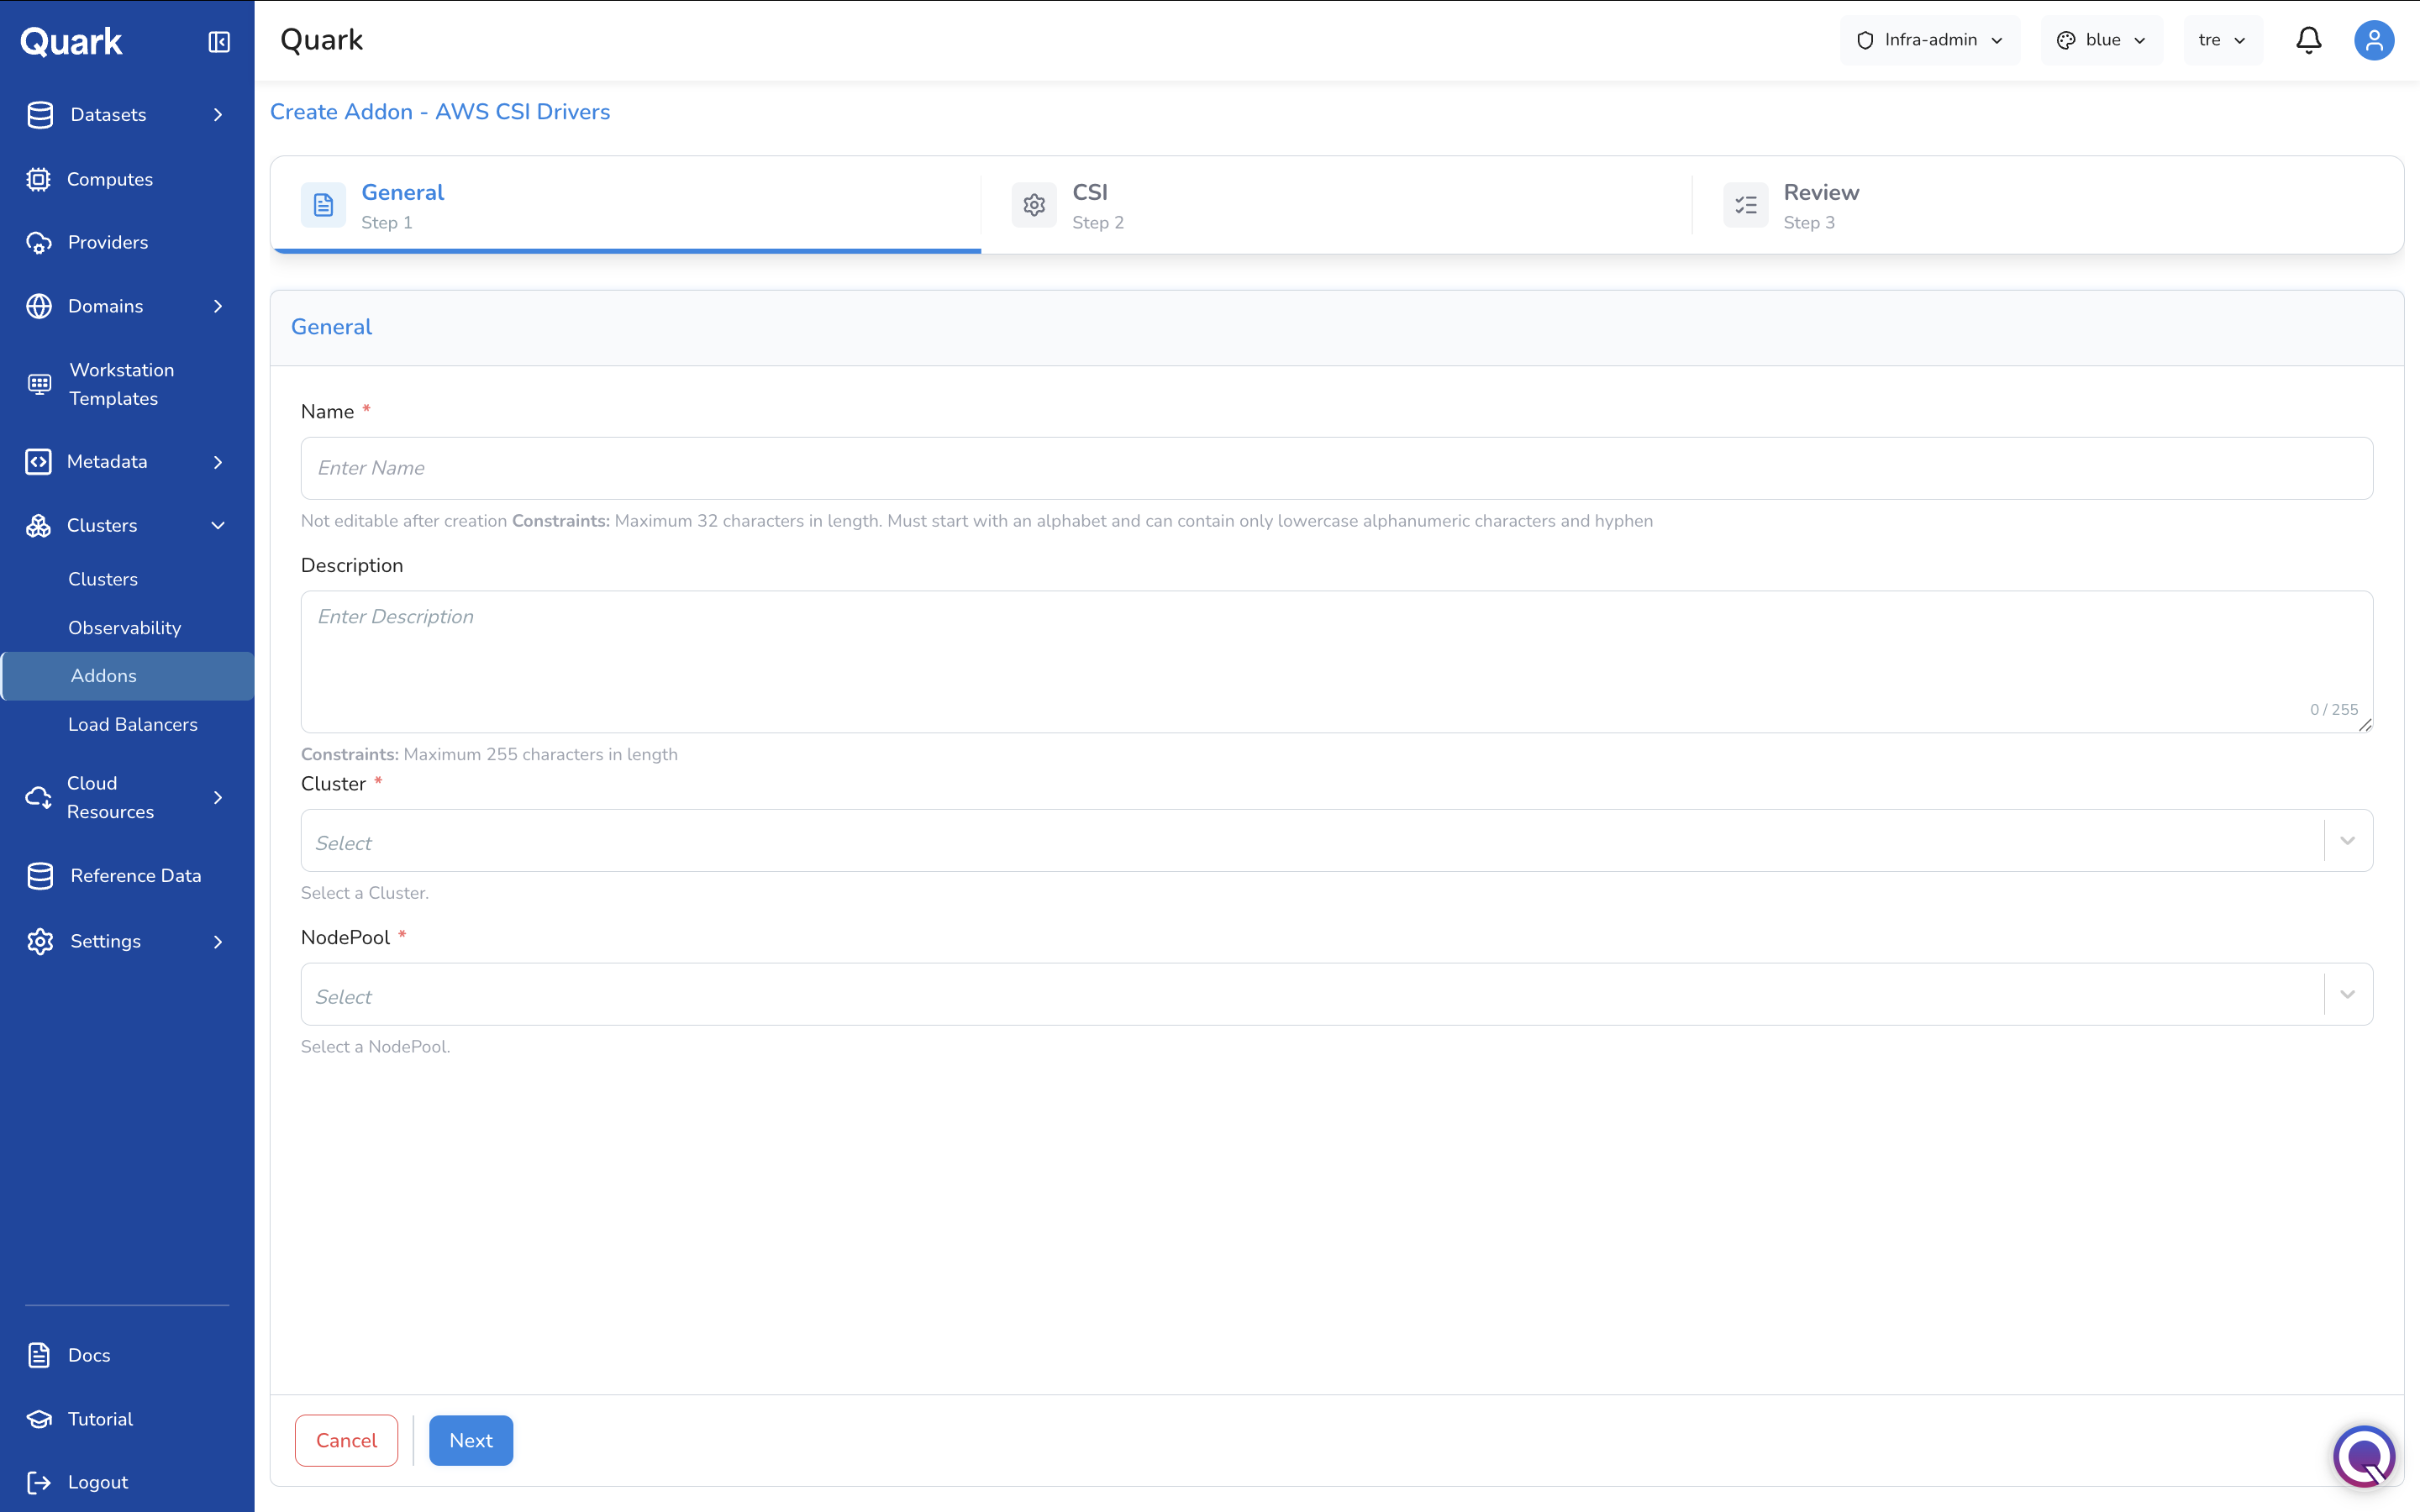
Step 1: General
| Field | Description |
|---|---|
| Name (mandatory) | A unique name for this add-on instance. Maximum 32 characters, lowercase alphanumeric and hyphens, not editable after creation. |
| Description | An optional description. Maximum 255 characters. |
| Cluster (mandatory) | The cluster on which this add-on will be installed. |
| NodePool (mandatory) | The specific node pool within the cluster where the add-on will be deployed. |
Step 2: CSI
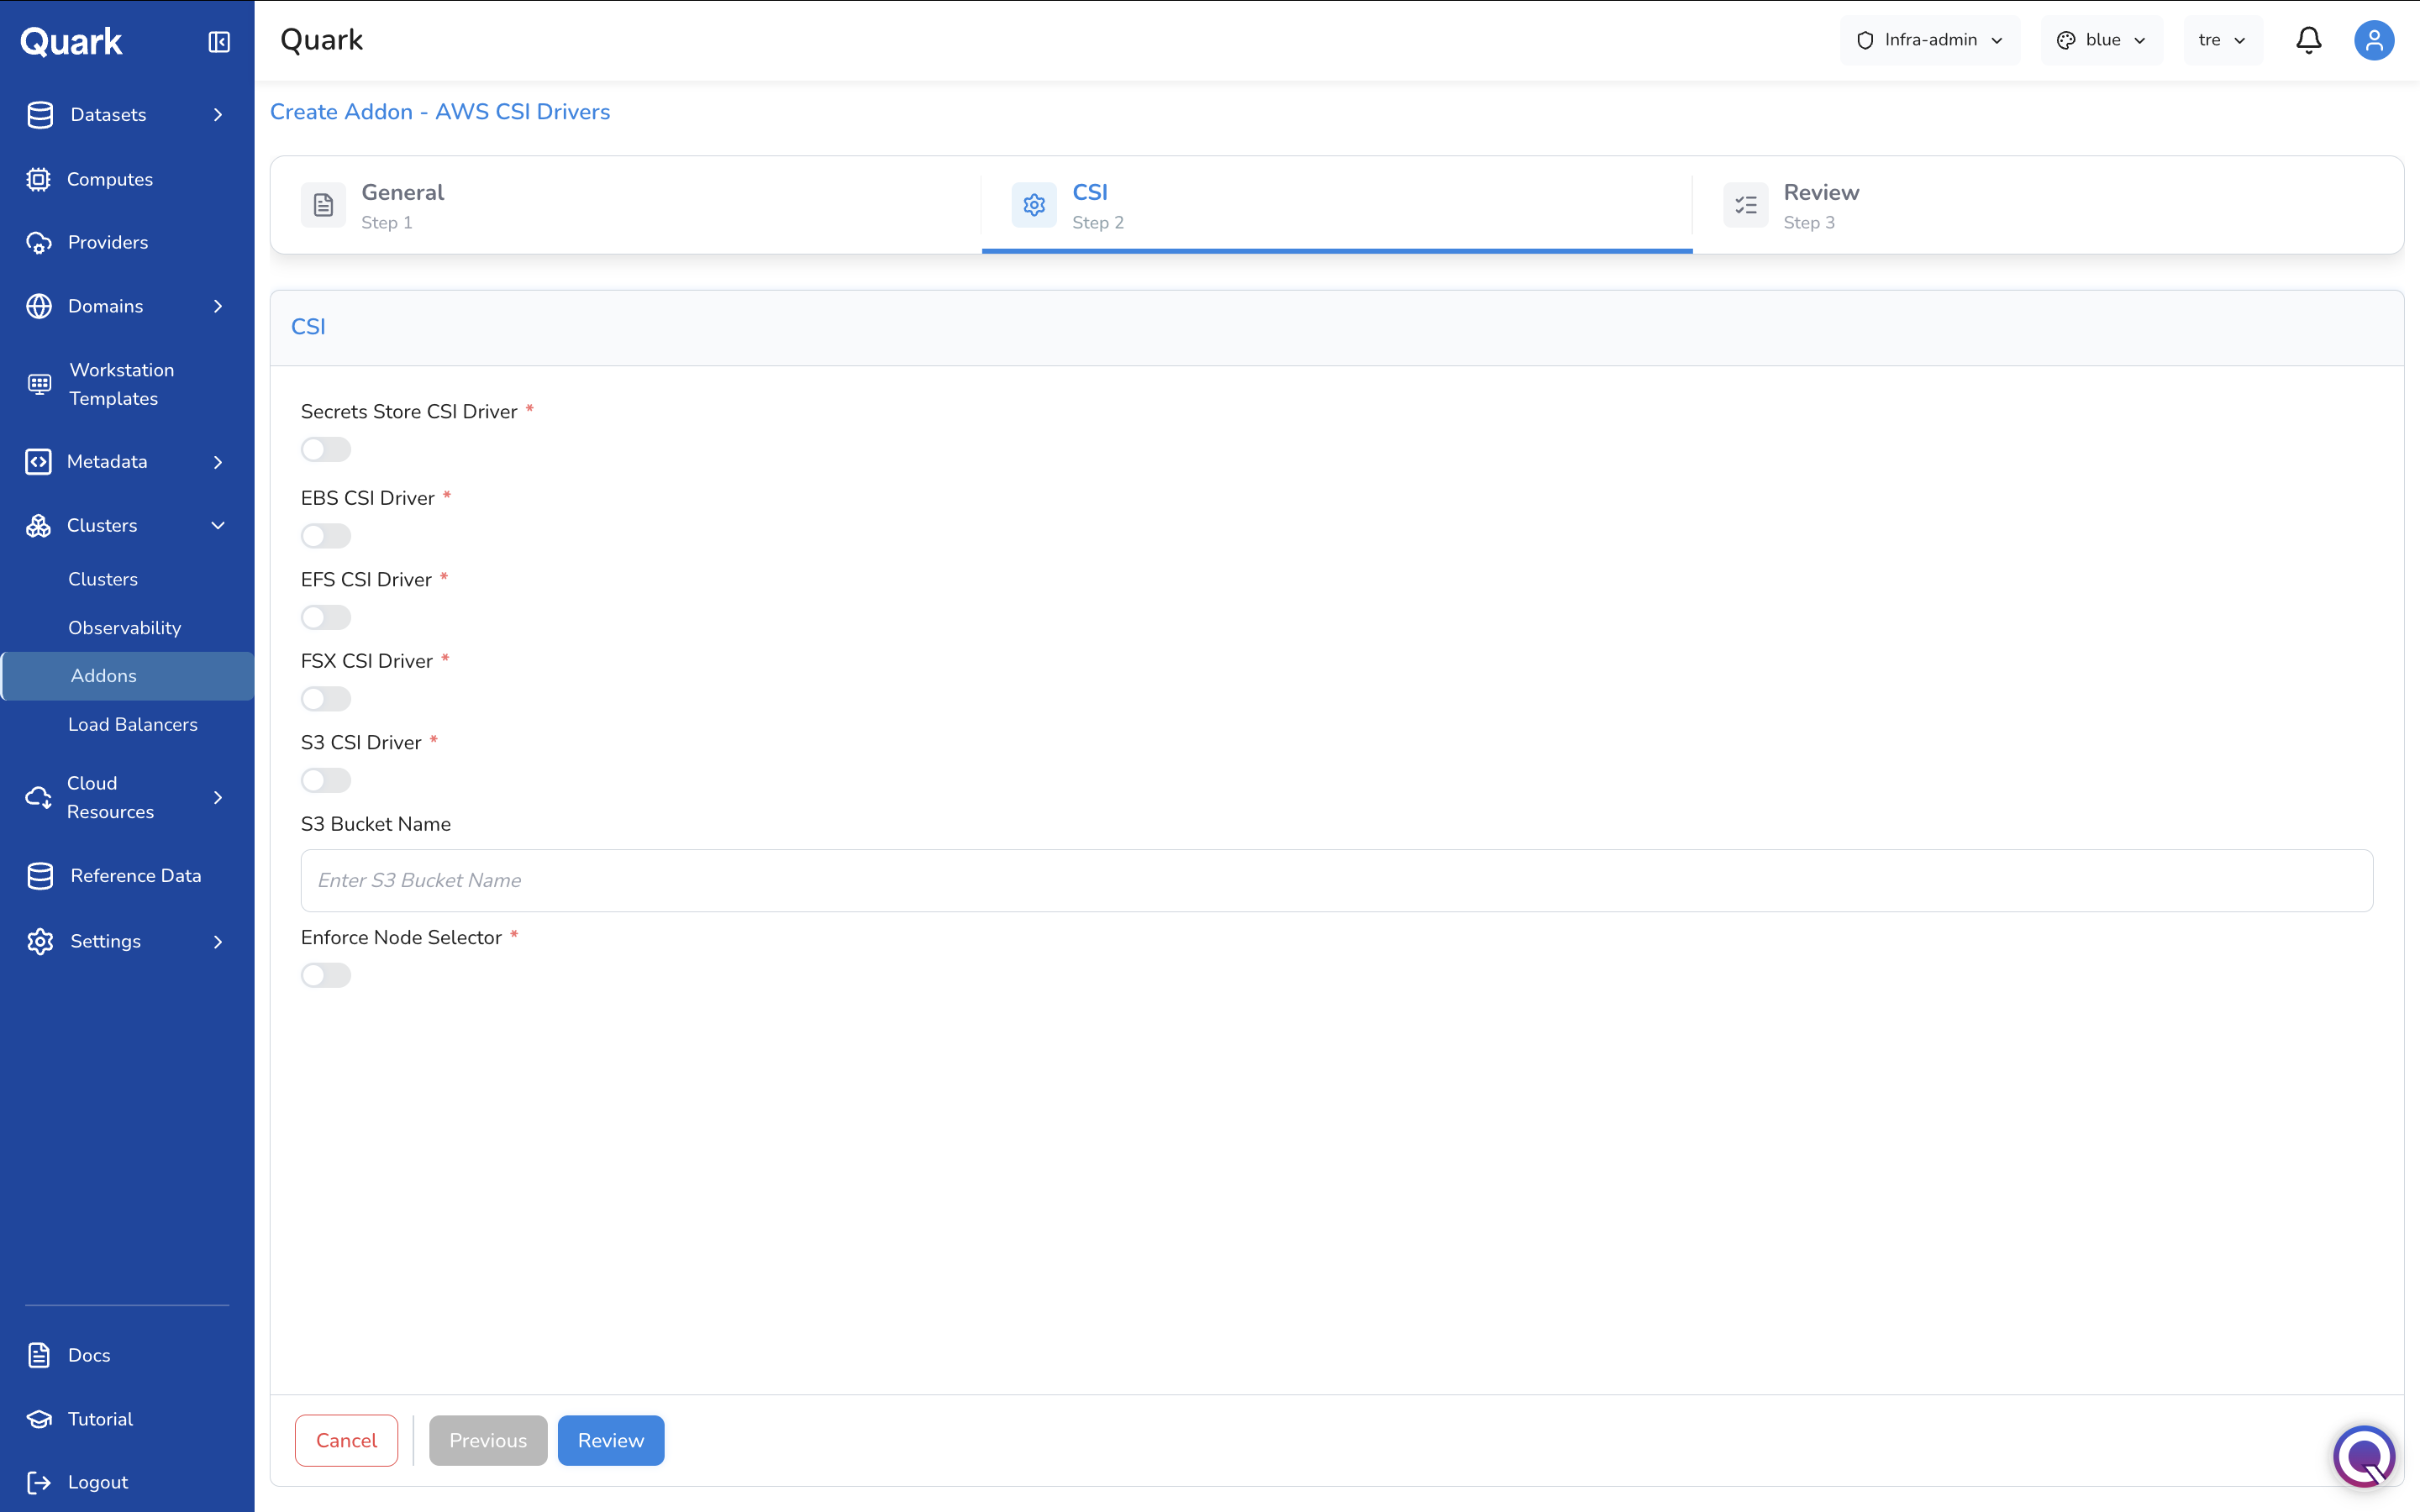
Enable the specific AWS CSI (Container Storage Interface) drivers required by workloads on this cluster:
| Field | Description |
|---|---|
| Secrets Store CSI Driver (mandatory) | Toggle to enable the AWS Secrets Manager CSI driver, allowing pods to mount secrets directly from AWS Secrets Manager as volumes. |
| EBS CSI Driver (mandatory) | Toggle to enable the Amazon EBS CSI driver for persistent block storage volumes. |
| EFS CSI Driver (mandatory) | Toggle to enable the Amazon EFS CSI driver for shared file system storage. |
| FSX CSI Driver (mandatory) | Toggle to enable the Amazon FSx CSI driver for high-performance file system storage. |
| S3 CSI Driver (mandatory) | Toggle to enable the Amazon S3 CSI driver, allowing pods to mount S3 buckets as file systems. |
| S3 Bucket Name | If the S3 CSI Driver is enabled, enter the name of the S3 bucket to mount. |
| Enforce Node Selector (mandatory) | Toggle to restrict CSI driver pods to specific nodes using node selector rules, preventing them from running on unintended nodes. |
Step 3: Review
Review all configuration, then click Create to install the add-on.
Load Balancers Tab
The Load Balancers List
The Load Balancers tab lists all load balancers provisioned on the platform. Each row shows the load balancer name, its Status, Sync state, the Cluster it is attached to, the Controller type, and creation metadata.
Adding a Load Balancer
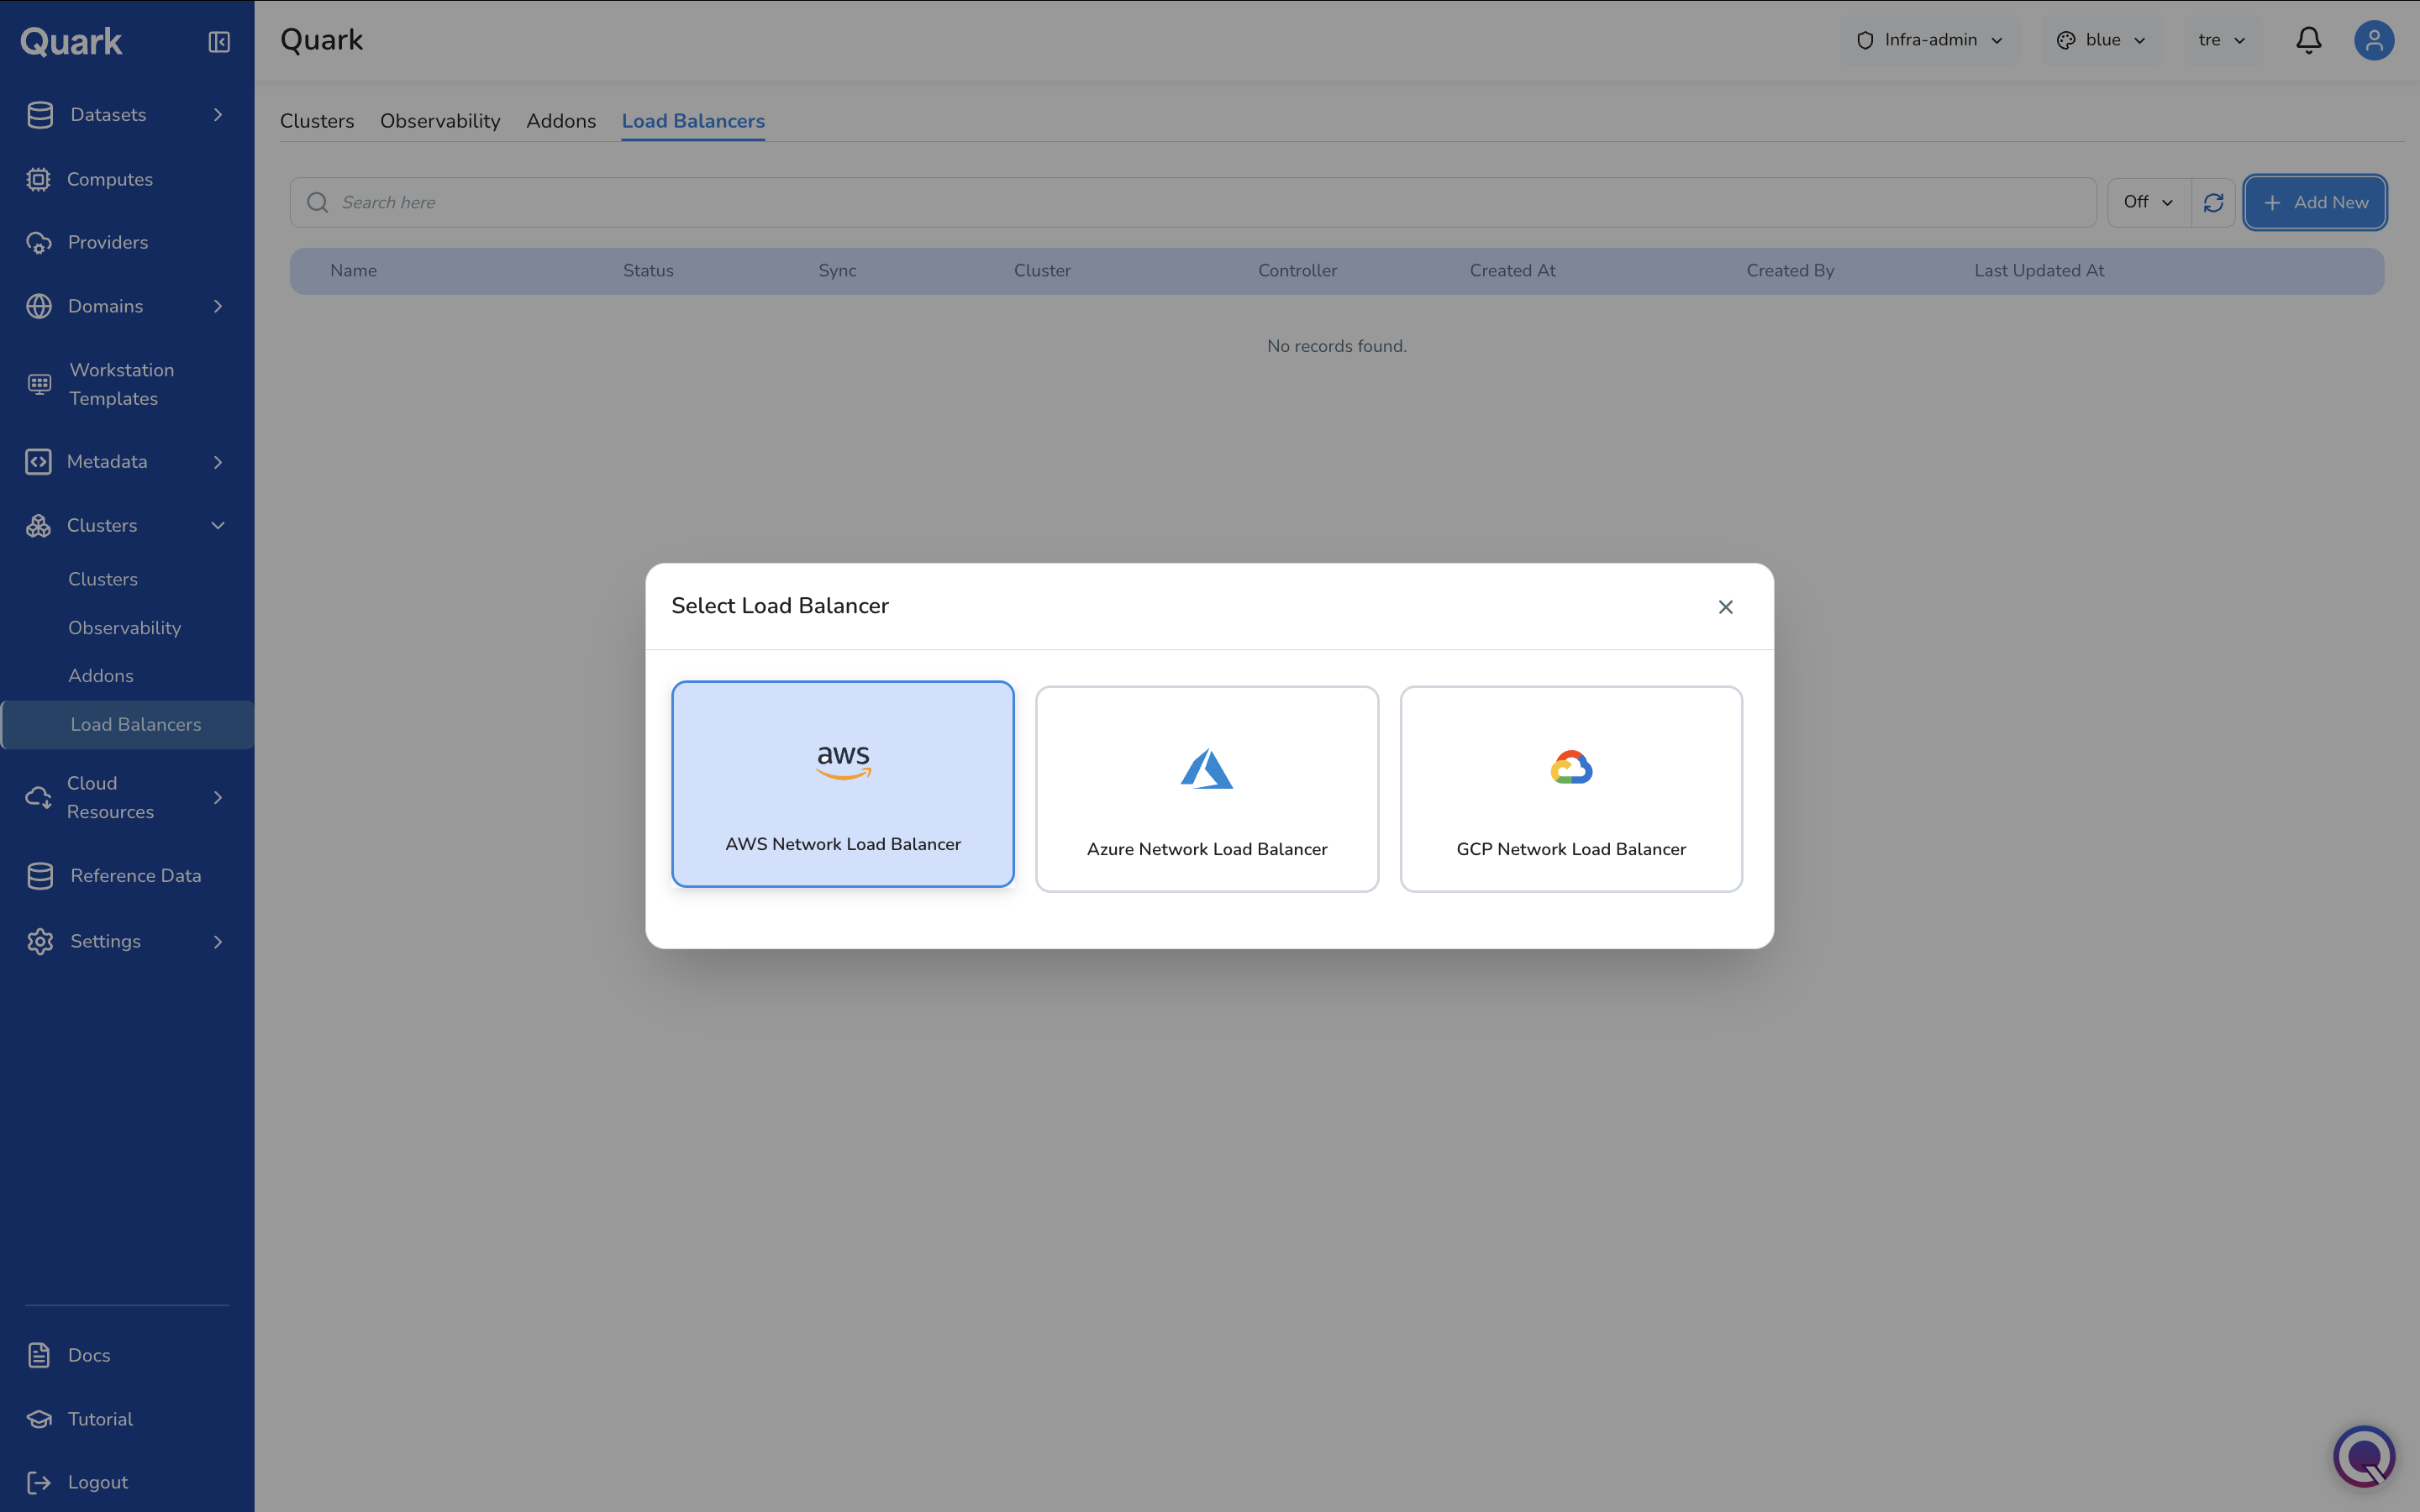
- Navigate to the Load Balancers tab.
- Click + Add New.
-
The Select Load Balancer modal appears with three options: AWS Network Load Balancer, Azure Network Load Balancer, GCP Network Load Balancer.
-
Select the appropriate load balancer type. The wizard opens for that type.
The example below walks through creating an AWS Network Load Balancer, which has three steps: General → Spec → Review.
Step 1: General
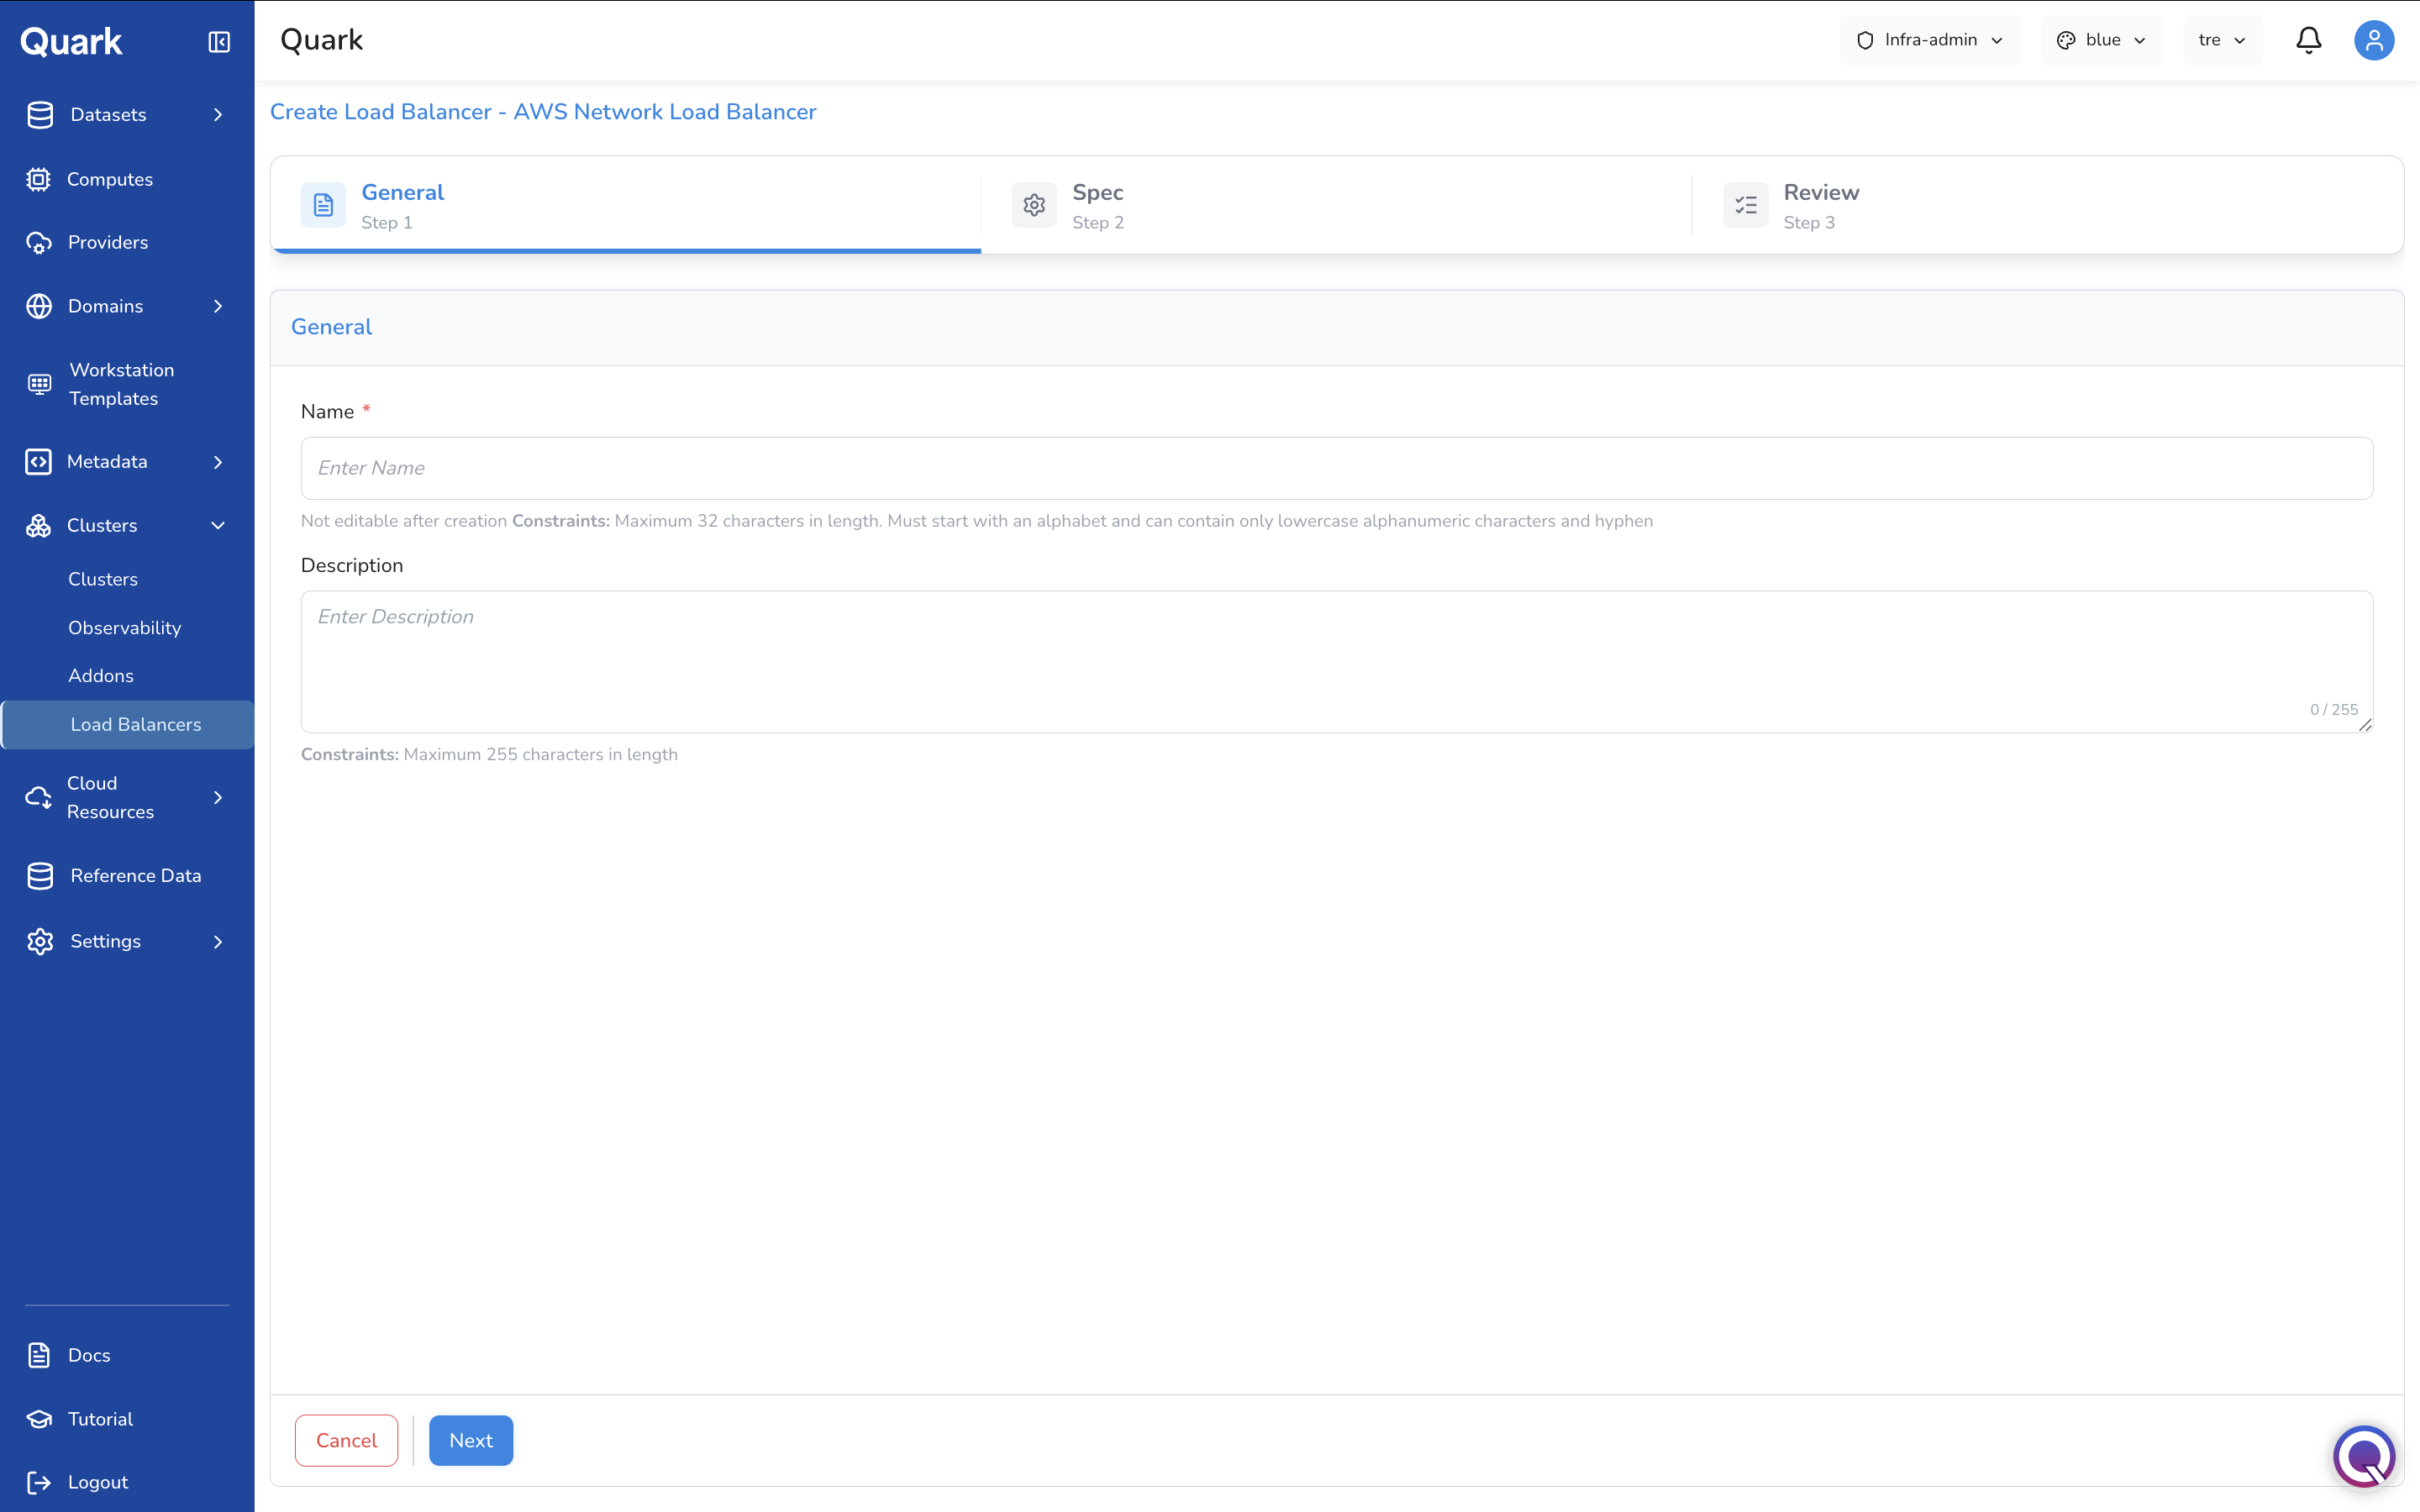
| Field | Description |
|---|---|
| Name (mandatory) | A unique name for this load balancer. Maximum 32 characters, lowercase alphanumeric and hyphens, not editable after creation. |
| Description | An optional description. Maximum 255 characters. |
Step 2: Spec

| Field | Description |
|---|---|
| Provider | Auto-populated with the load balancer type (e.g., AWSNetworkLB). Read-only. |
| Cluster (mandatory) | The cluster this load balancer will serve. The load balancer routes traffic exclusively to workloads running on the selected cluster. |
| Nodepool (mandatory) | The node pool within the cluster where the load balancer will direct traffic. |
| Scheme (mandatory) | Whether the load balancer is Public (exposed to the internet) or Private (restricted to internal network access only). |
| Domain | The domain to associate with this load balancer for DNS routing. Select from the domains registered in Domains. |
| Certificate Issuer | The certificate issuer to handle TLS termination at the load balancer. Select from the issuers configured in Domains → Certificate Issuers. |
Step 3: Review
Review all configuration, then click Create to provision the load balancer.
What's Next
- Providers — Cloud provider accounts must be registered before clusters can be provisioned or imported. DataDog API key credentials for observability stacks are also registered here.
- Domains — Domains and certificate issuers are assigned to clusters during creation and referenced by load balancers for TLS routing.
- Computes — Compute configurations run on the clusters provisioned here. Ensure each cluster is healthy before assigning compute workloads to it.
- Workstation Templates — Workstation instances are scheduled on clusters. A healthy, correctly configured cluster is a prerequisite for workstation availability.