Dashboard
Overview
The Dashboard is the first screen you see when you log in to Quark V3 as a DS Administrator. It gives an at-a-glance view of active workspaces and pipelines across the projects you administer, providing quick navigation to any area of the platform.
Navigation: Select Dashboard from the left-hand navigation pane.
What the DS Administrator Sees
The DS Administrator's Dashboard is organised into two main panels:
Workspaces Panel
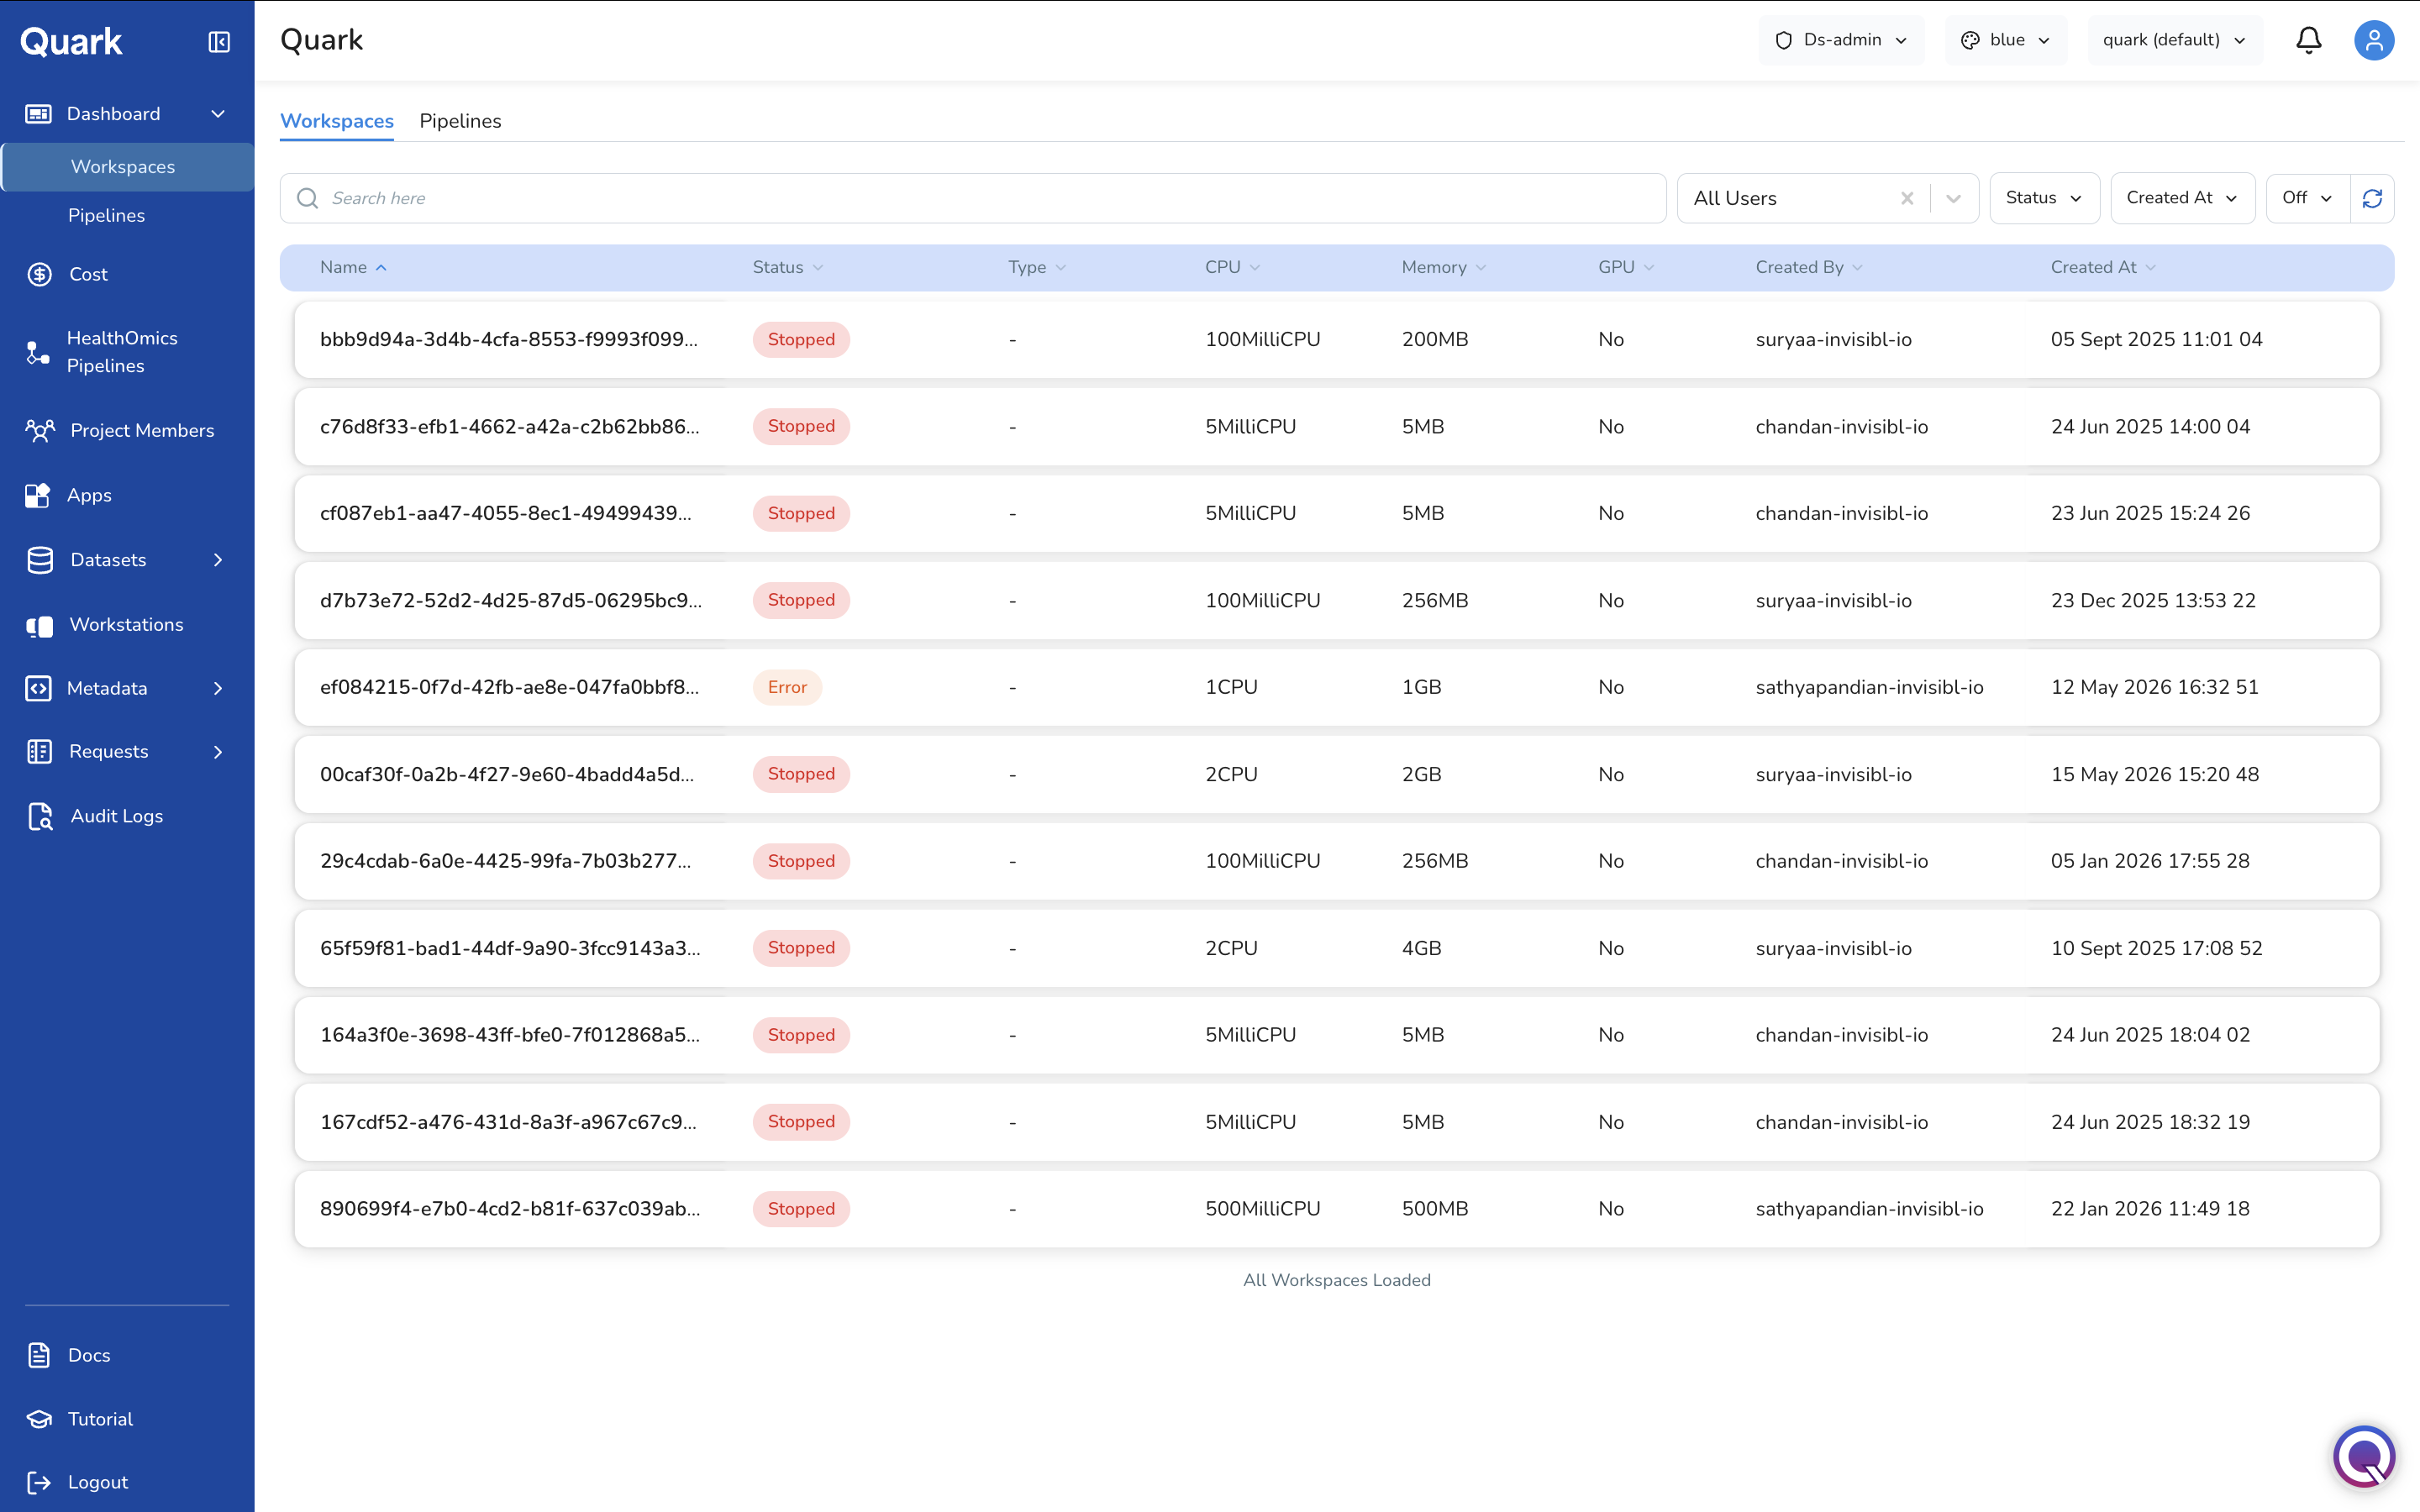
Displays the workspaces currently active or recently used within projects. Each workspace card shows its name, status, and the project it belongs to.
- Click on any workspace card to navigate directly to that workspace.
- Use this panel to keep track of active compute environments and identify any that may have been left running unnecessarily.
Pipelines Panel
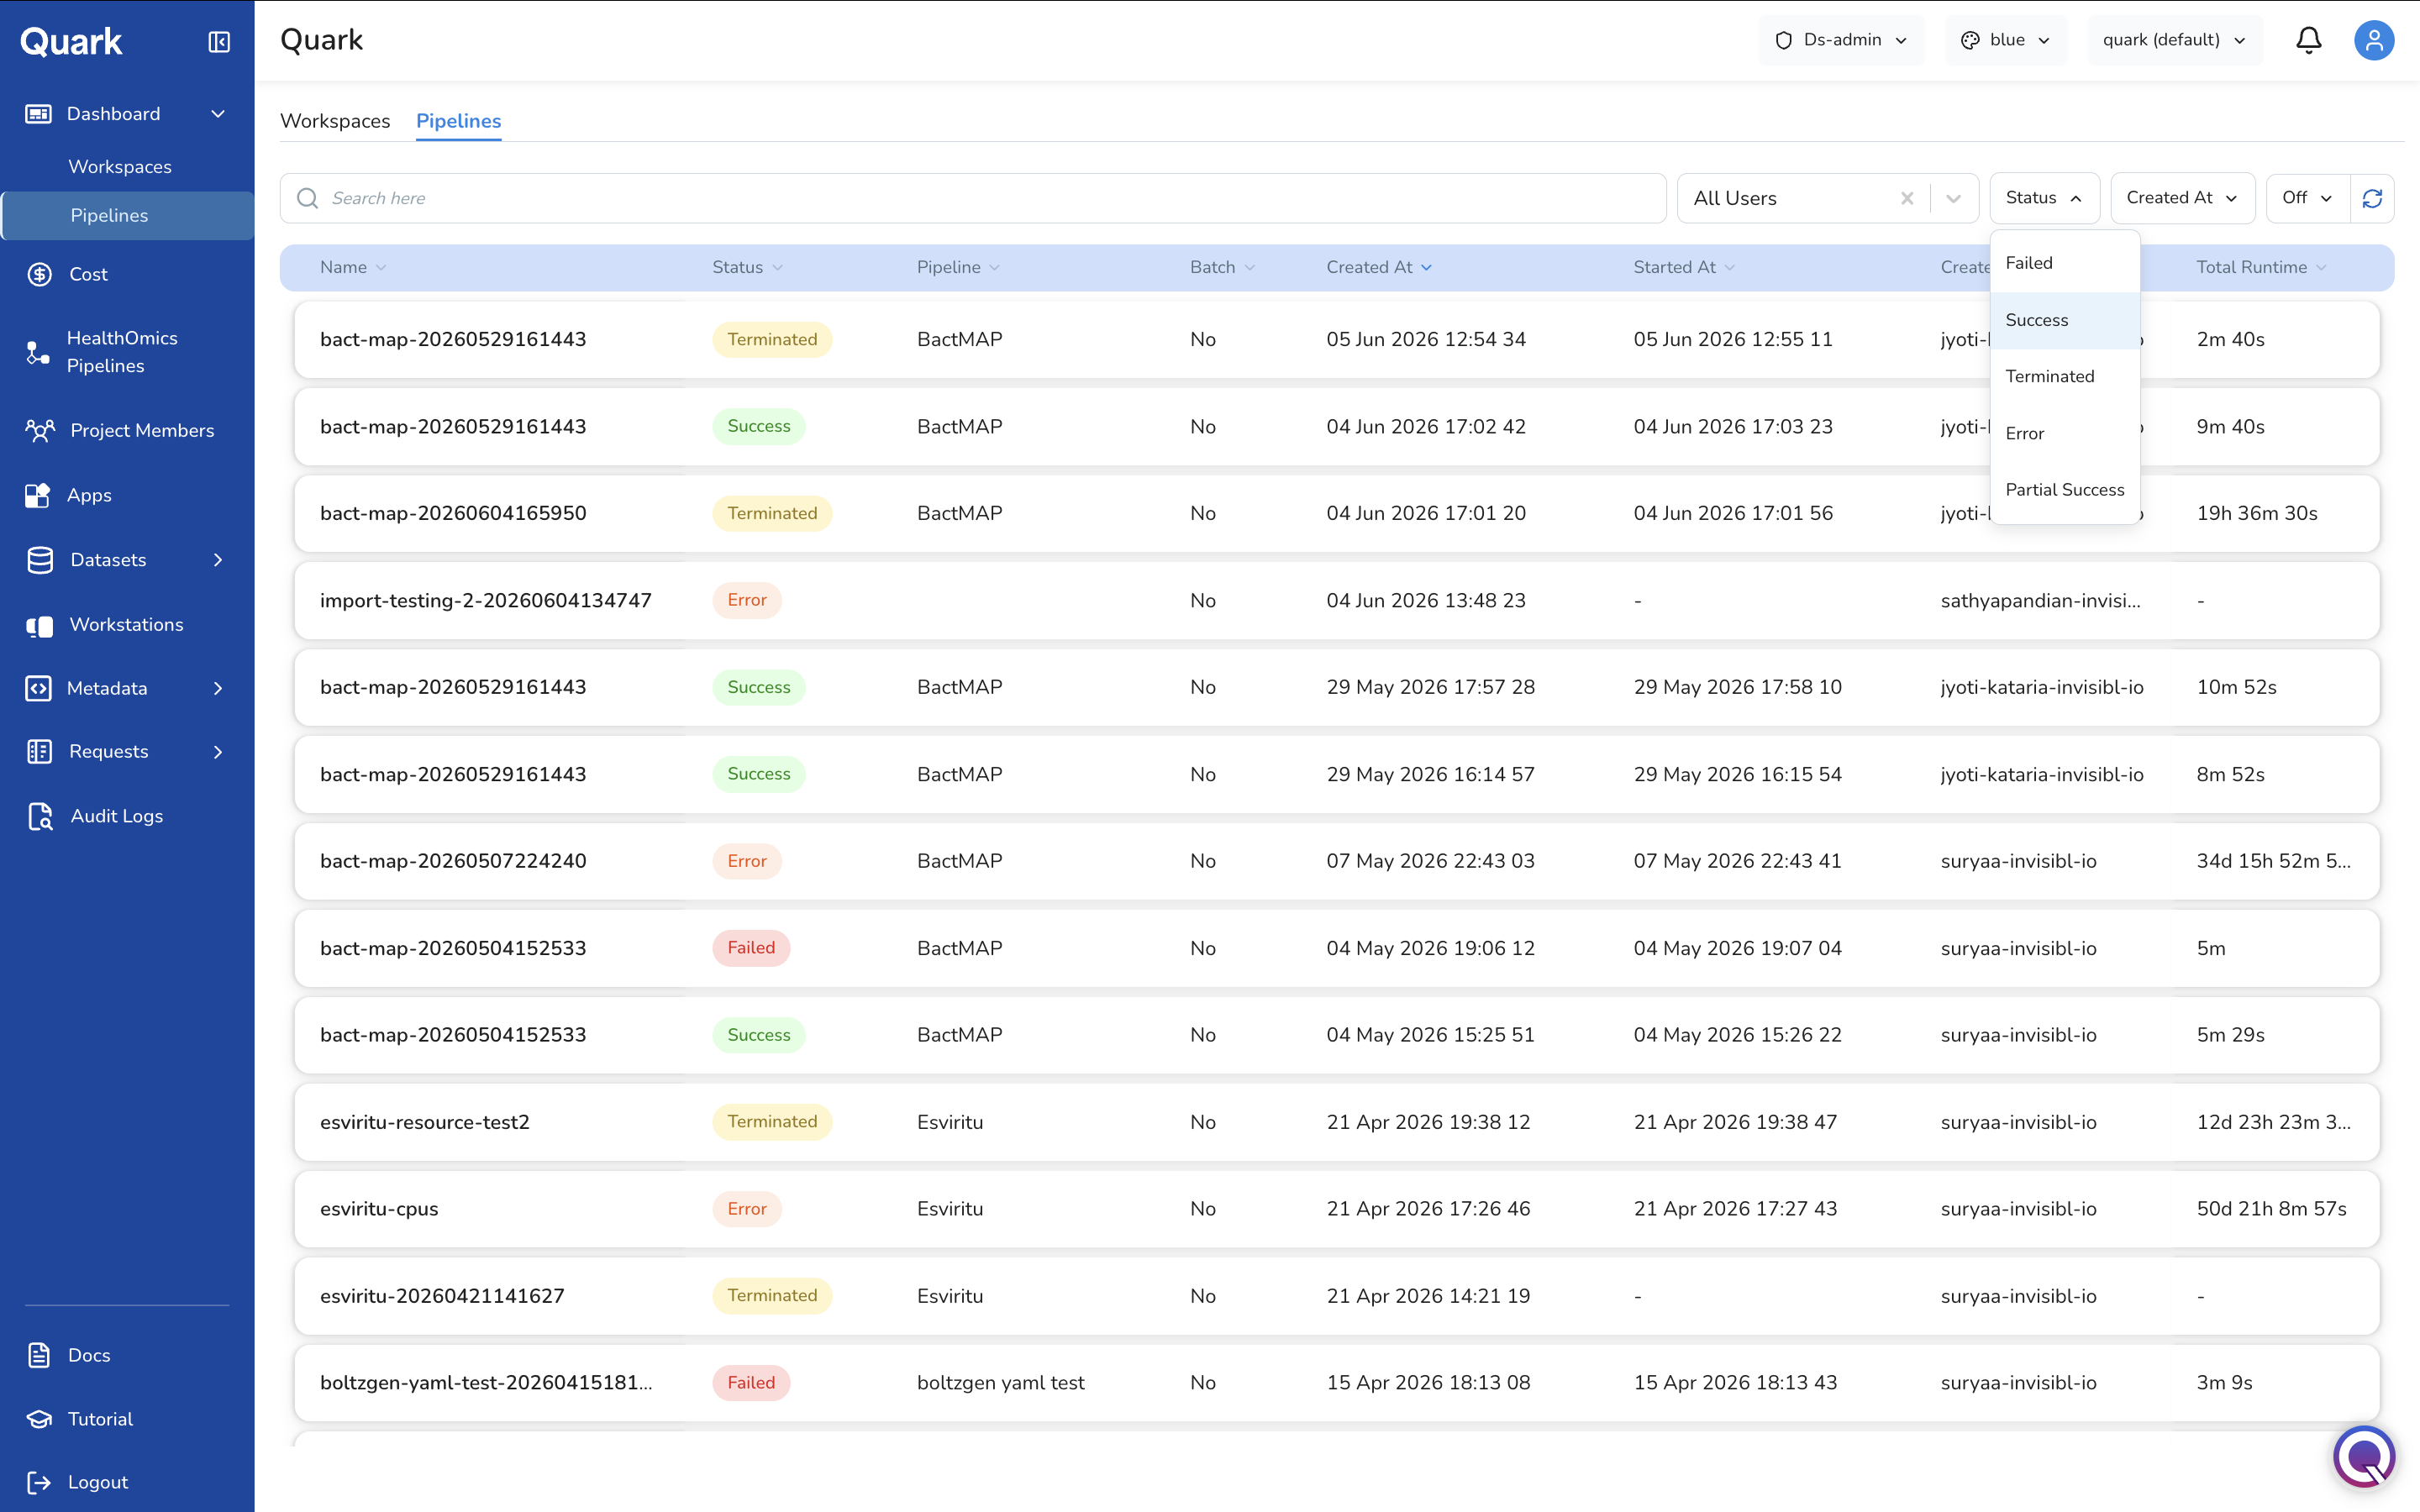
Displays pipelines that are pinned, recently run, or surfaced as relevant to your projects. Each pipeline card shows its name and current status.
- Click any pipeline card to open its details or proceed to a run configuration.
- To browse the full catalogue of available pipelines, navigate to HealthOmics Pipelines in the left navigation pane.
Note: The Dashboard view is contextual — what you see depends on which project is currently selected. Use the project dropdown (top of the screen) to switch between projects and view their respective workspaces and pipelines.
Filtering the Dashboard
You can refine the Dashboard view to filter results by:
- User: Narrow the view to show only workspaces and pipelines associated with a specific user within the selected project.
- Status: Filter workspaces and pipelines by their current status (e.g., Running, Stopped, Failed) to quickly surface items that require attention.
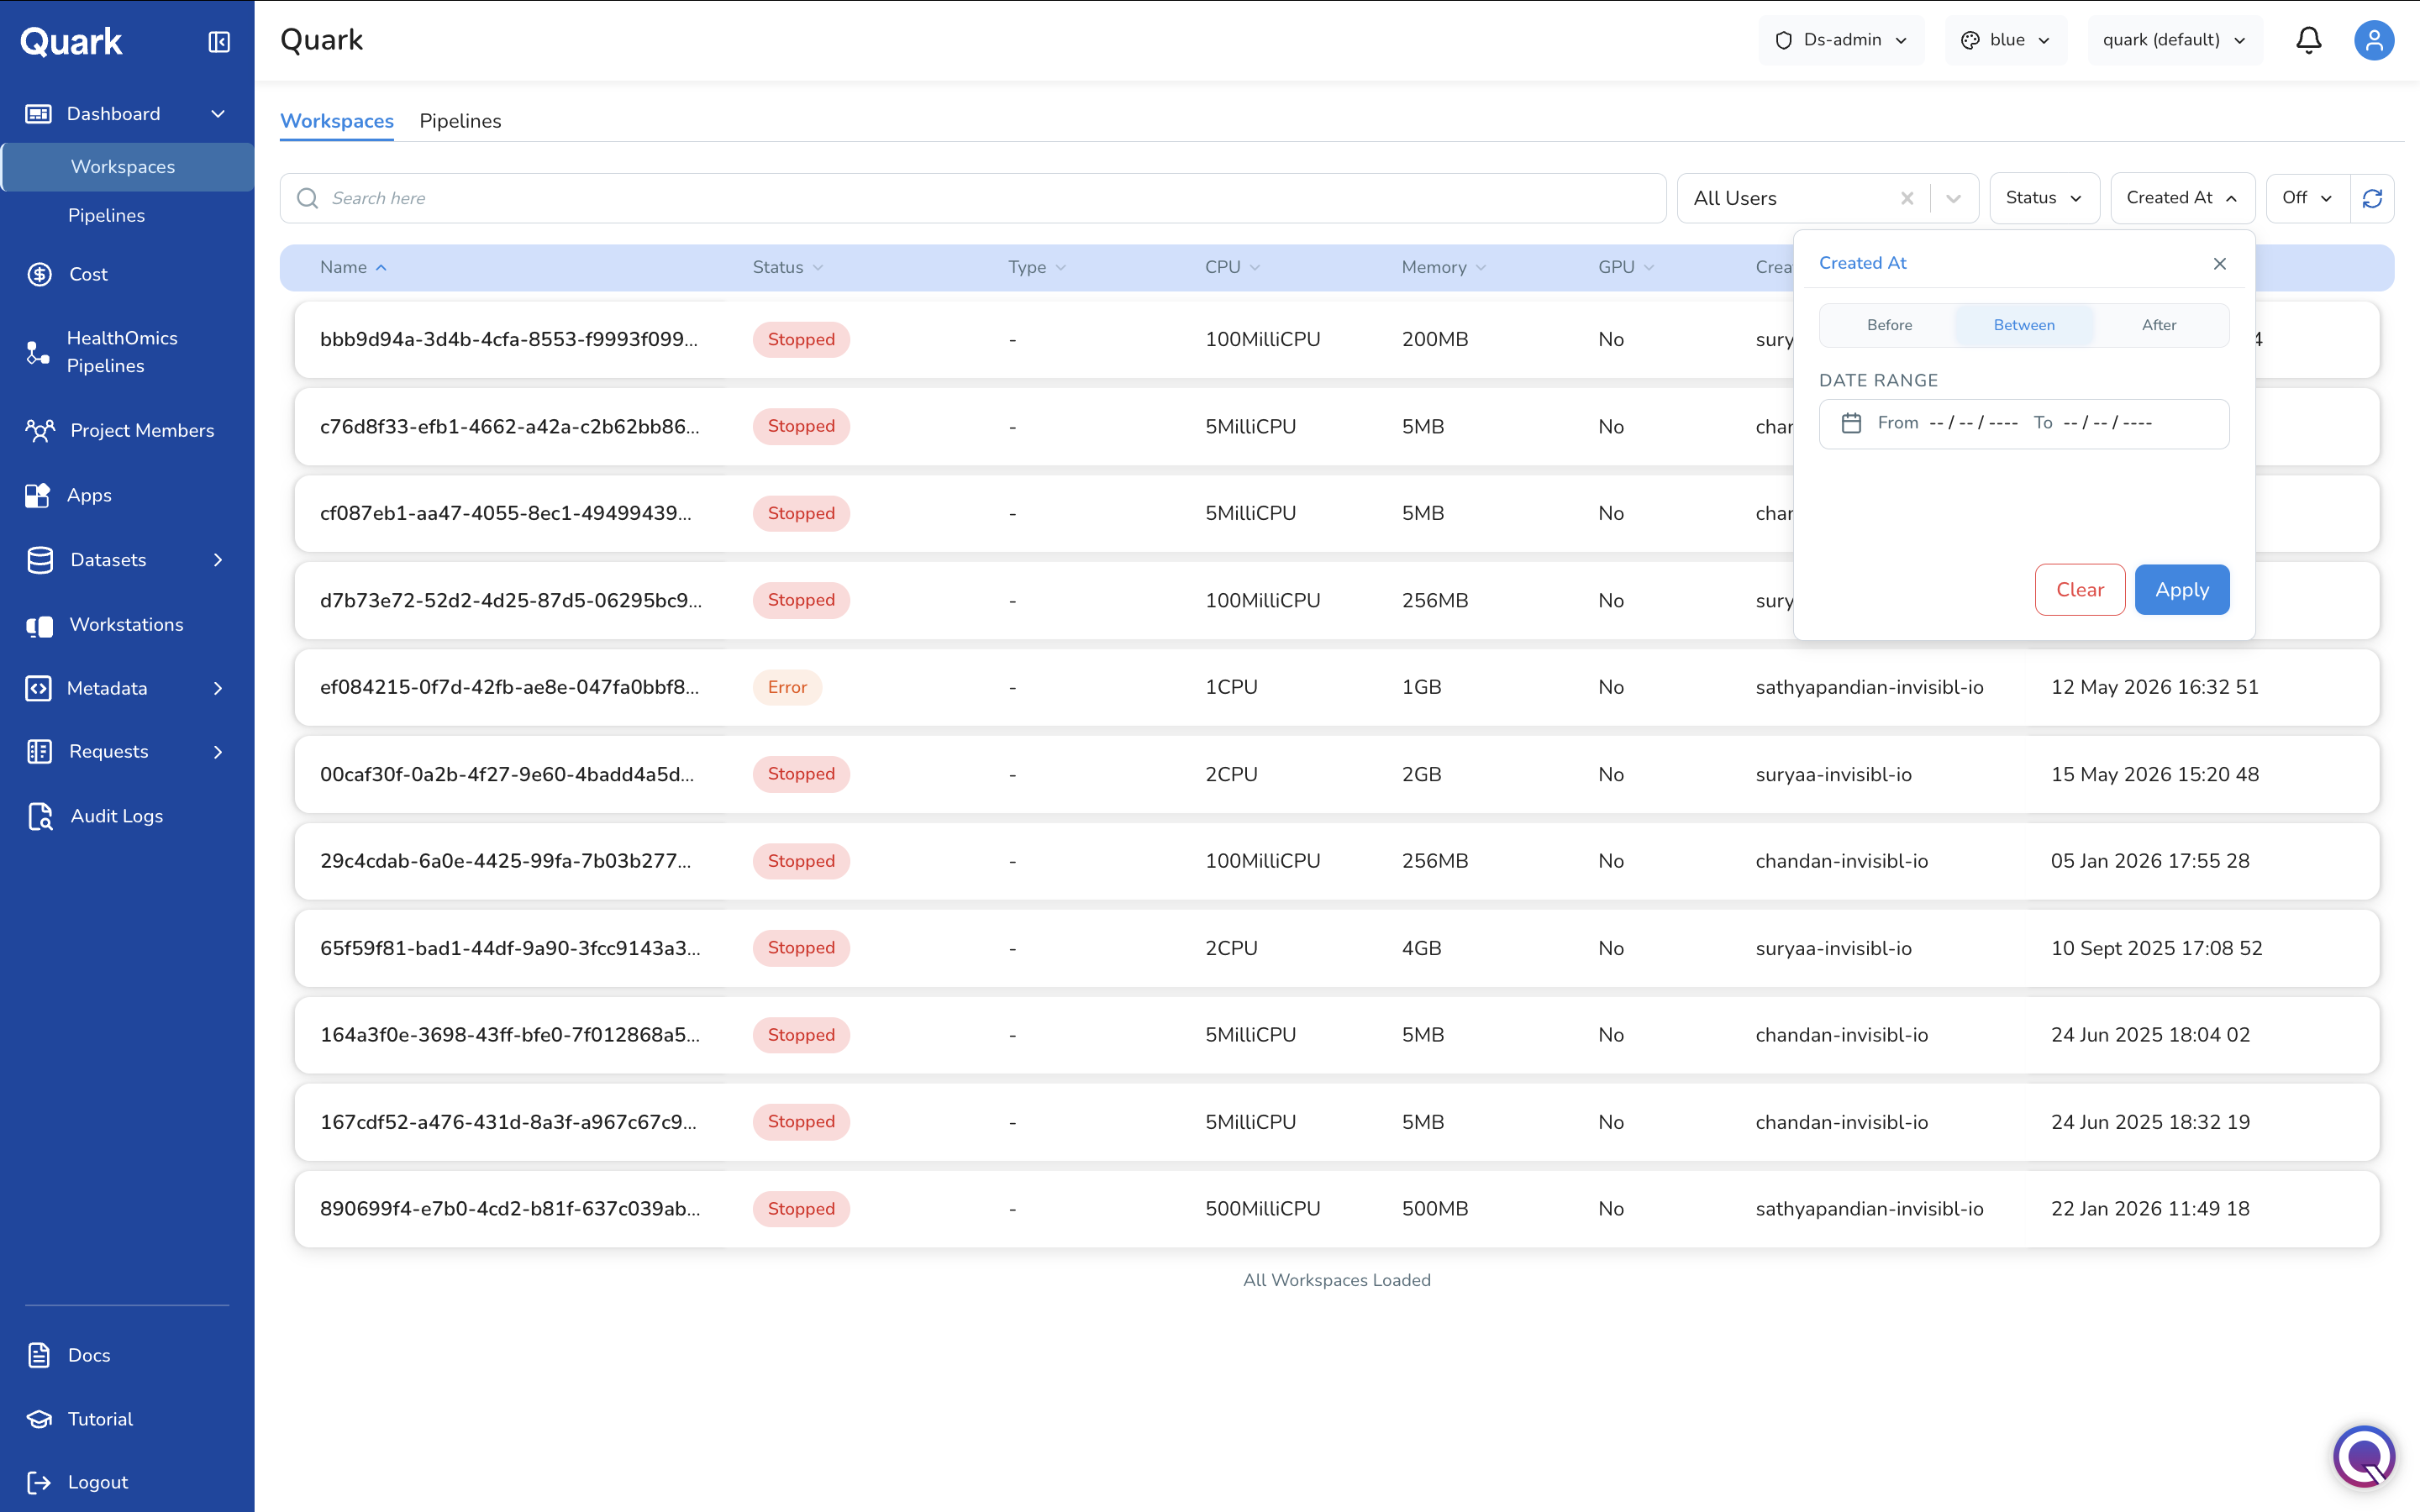
- Creation Date: Restrict the view to resources created within a specific date range — useful for reviewing recent activity or investigating a time-bounded incident.
You can also use the Search bar to retrieve specific workspaces or pipeline runs by Name.
Switching Projects
The DS Administrator typically oversees multiple projects. Use the project dropdown at the top of the screen to switch context between projects.
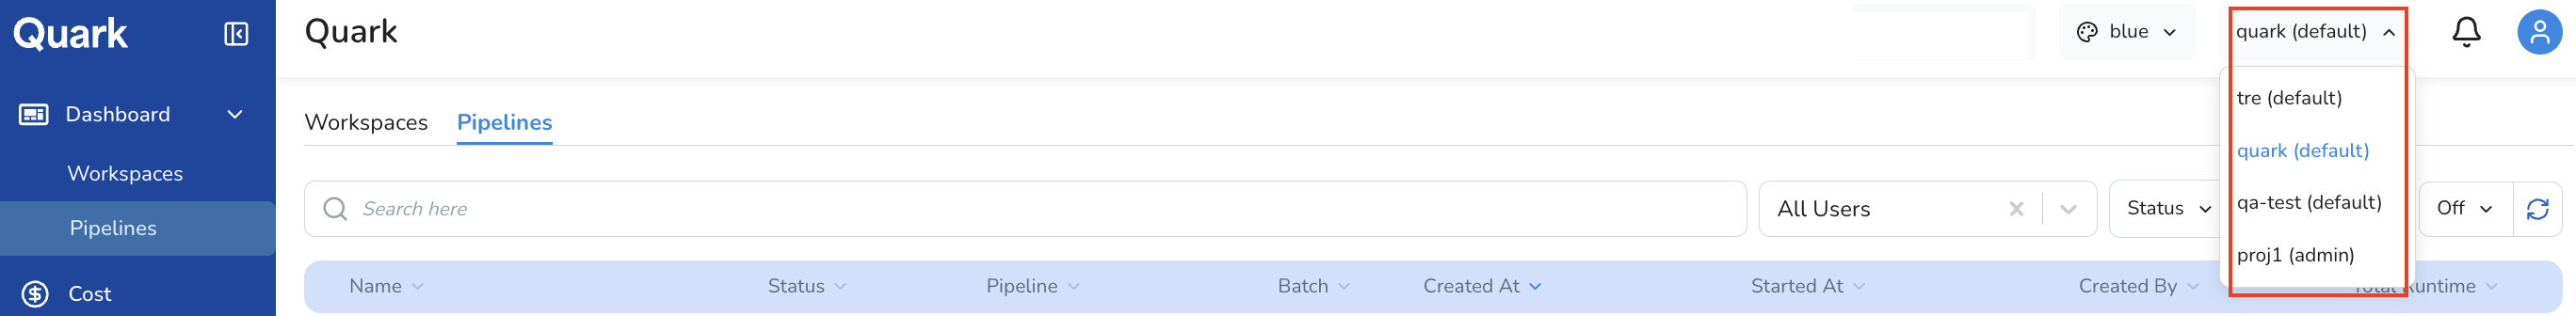
Tip: Always confirm which project is selected before taking any administrative action — the Dashboard, and most other navigation items, are scoped to the currently selected project.
What's Next
Navigate to any section of the DS Administrator interface:
- Cost — Monitor budget and resource expenditure across your projects.
- HealthOmics Pipelines — Import and configure pipelines for your users.
- Project Members — View and search the members of each project.
- Apps — Manage visualisation apps across projects.
- Datasets — Review datasets, catalog entries, and cohort requests.
- Workstations — Monitor and provision workstations for project users.
- Metadata — Configure metadata validation rules globally and per pipeline.
- Requests — Review and action user requests for data and workstation access.
- Audit Logs — Track all platform activity and resource usage for compliance.