Workstations
Overview
The Workstations section allows the DS Administrator to monitor the status of user workstations across the platform. Workstations are secure, isolated compute environments — typically Ubuntu or other OS-based virtual machines — within which researchers conduct their data analysis.
Ensuring users have the right compute resources, and that workstations are not left running unnecessarily, is an ongoing operational responsibility.
Navigation: Select Workstations from the left-hand navigation pane.
The Workstations Page
The Workstations dashboard lists every workstation across the platform that the DS Administrator has visibility over, along with its current status and ownership details.
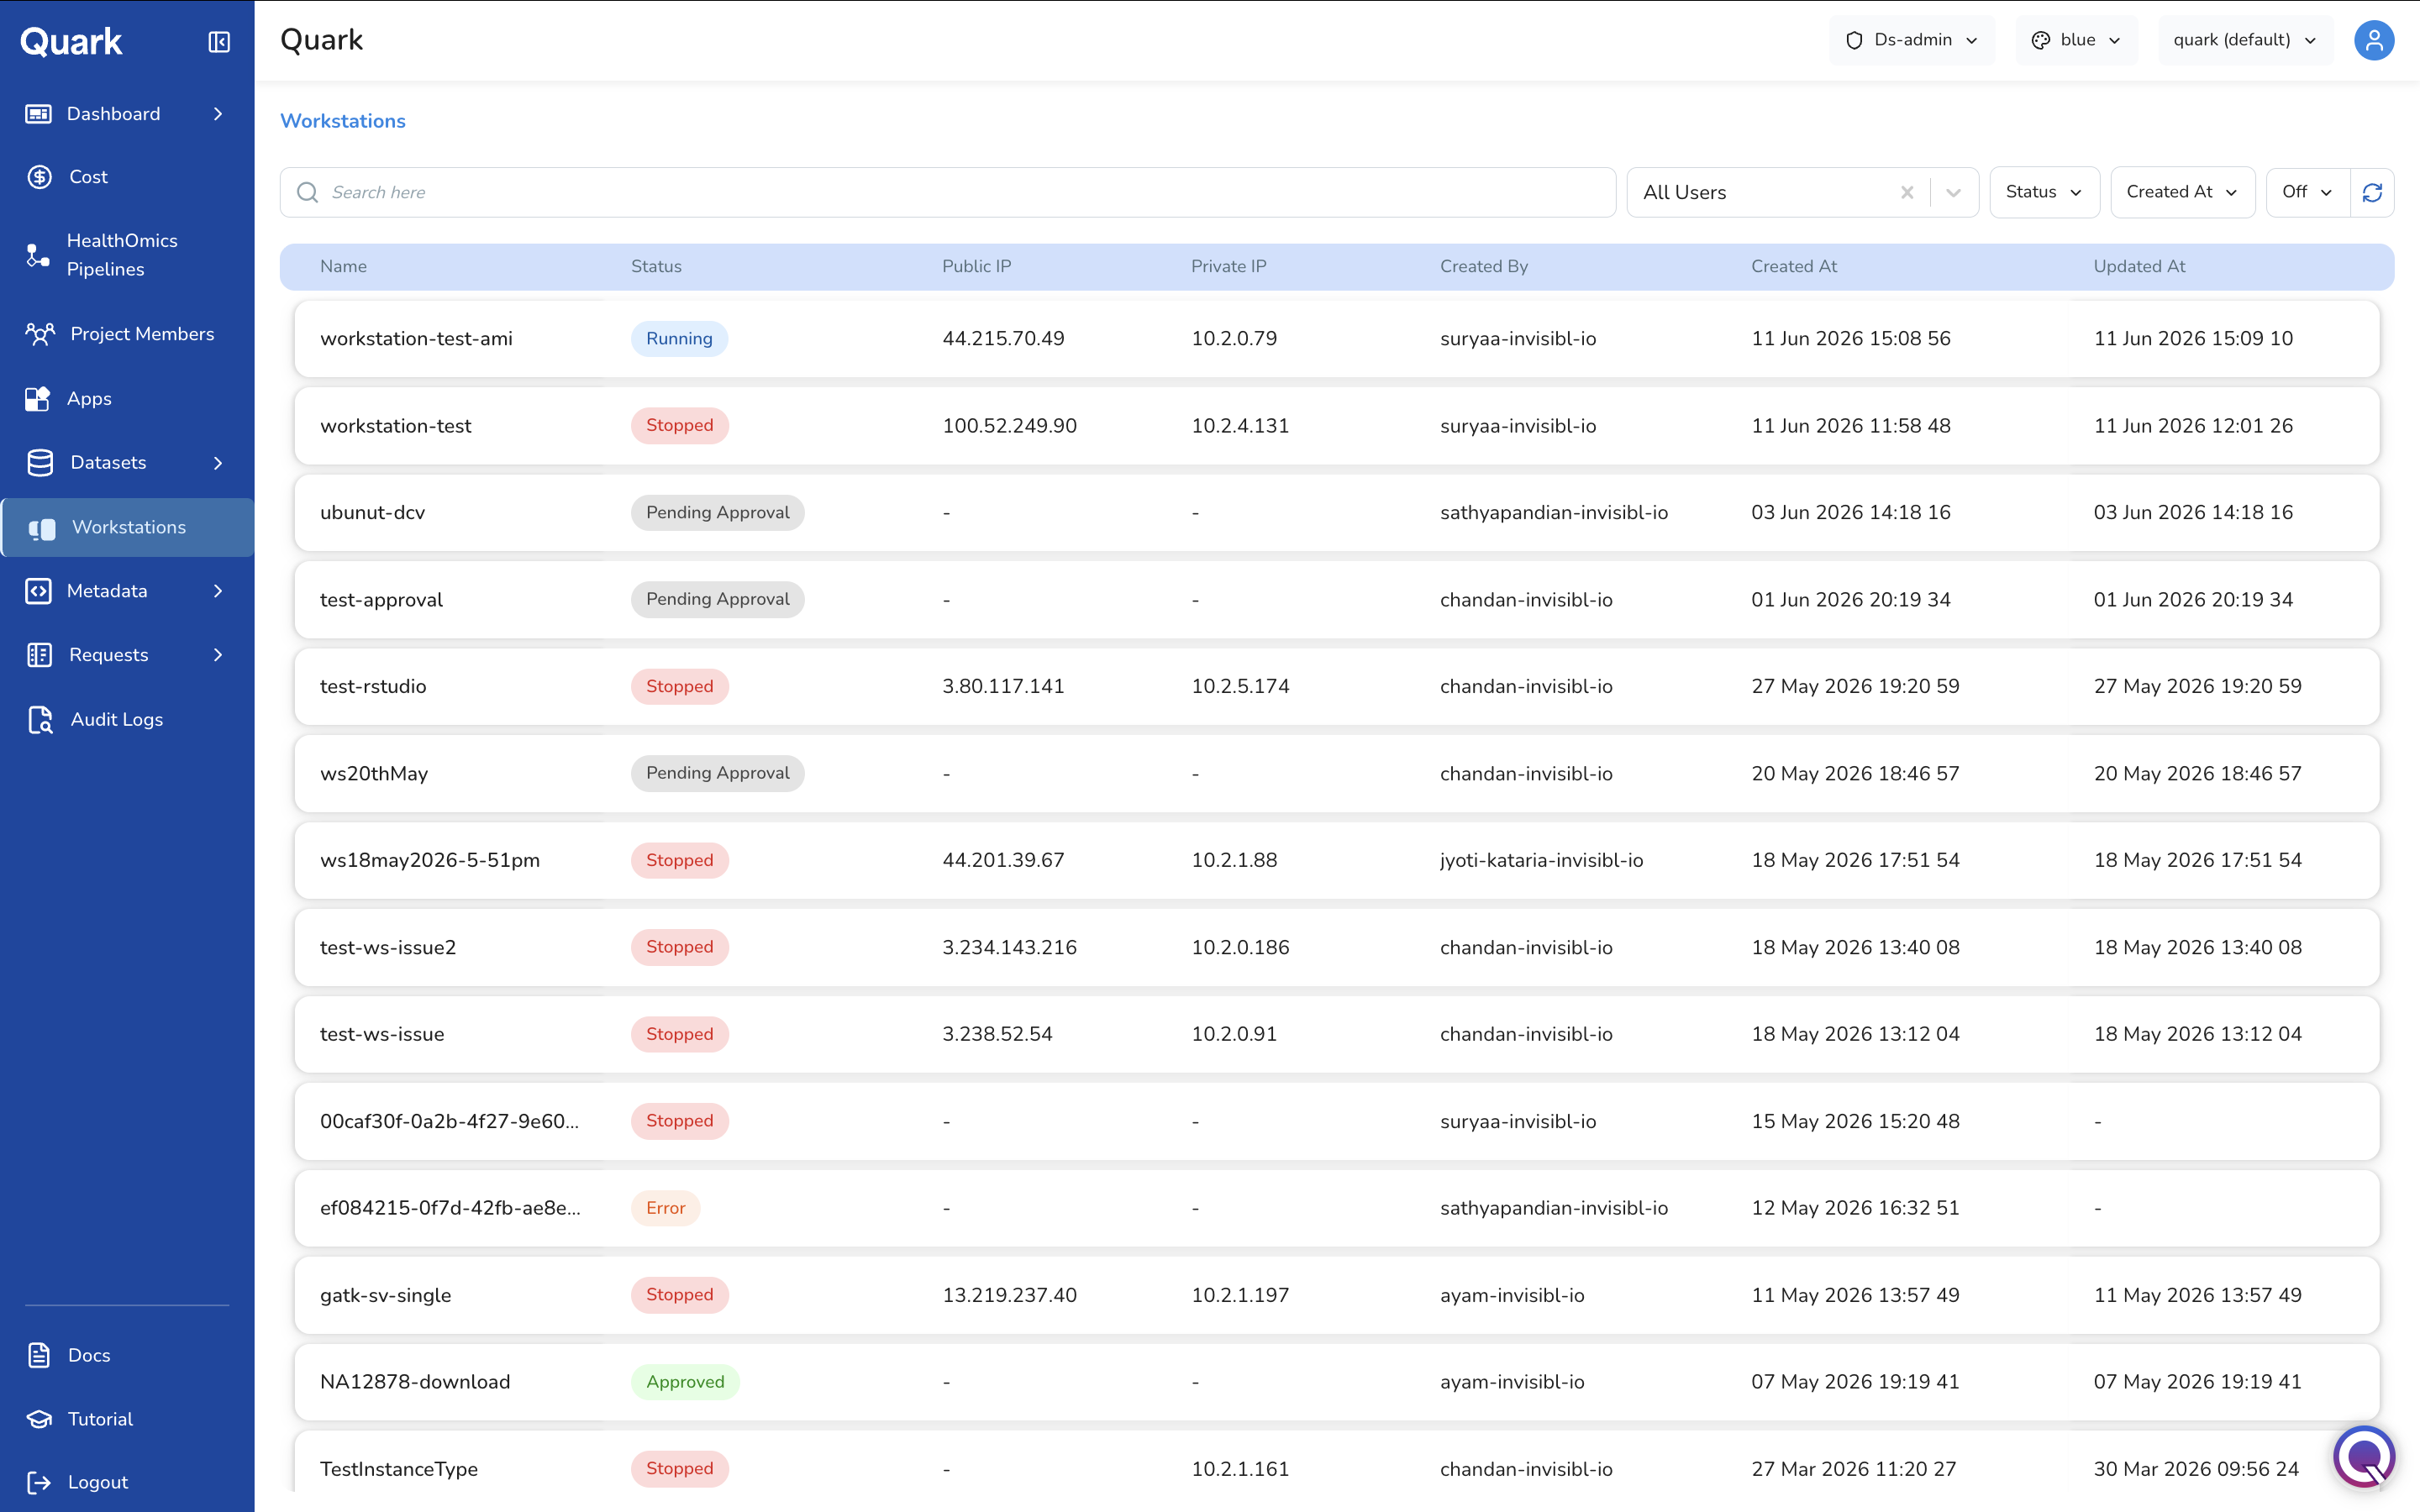
For each workstation, the list shows:
| Column | Description |
|---|---|
| Name | The name of the workstation as configured. |
| Status | The current state of the workstation — e.g., Running, Stopped, Pending Approval, Approved, or Error. |
| Public IP | The public IP address of the workstation, once provisioned. Displays - if not yet assigned. |
| Private IP | The private IP address within the platform's network. Displays - if not yet assigned. |
| Created By | The user who requested or created the workstation. |
| Created At | When the workstation was created. |
| Updated At | When the workstation's status was last updated. |
Searching and Filtering
Use the search bar to find a workstation by name. Use the All Users filter to scope the list to a specific user, and the Status and Created At filters to narrow the list further. Click the refresh icon to load the latest status for all workstations.
Monitoring Workstation Status
The DS Administrator can review all workstations across the platform to assess:
- Which workstations are currently Running and accruing compute costs.
- Which workstations are Stopped and may be candidates for cleanup if no longer needed.
- Workstations that are Pending Approval or Approved but not yet launched.
- Whether any workstations are in an Error state that may require attention.
Tip: Cross-reference running workstations with the Cost dashboard to identify instances that may be contributing disproportionately to resource spend.
Workstation Detail View
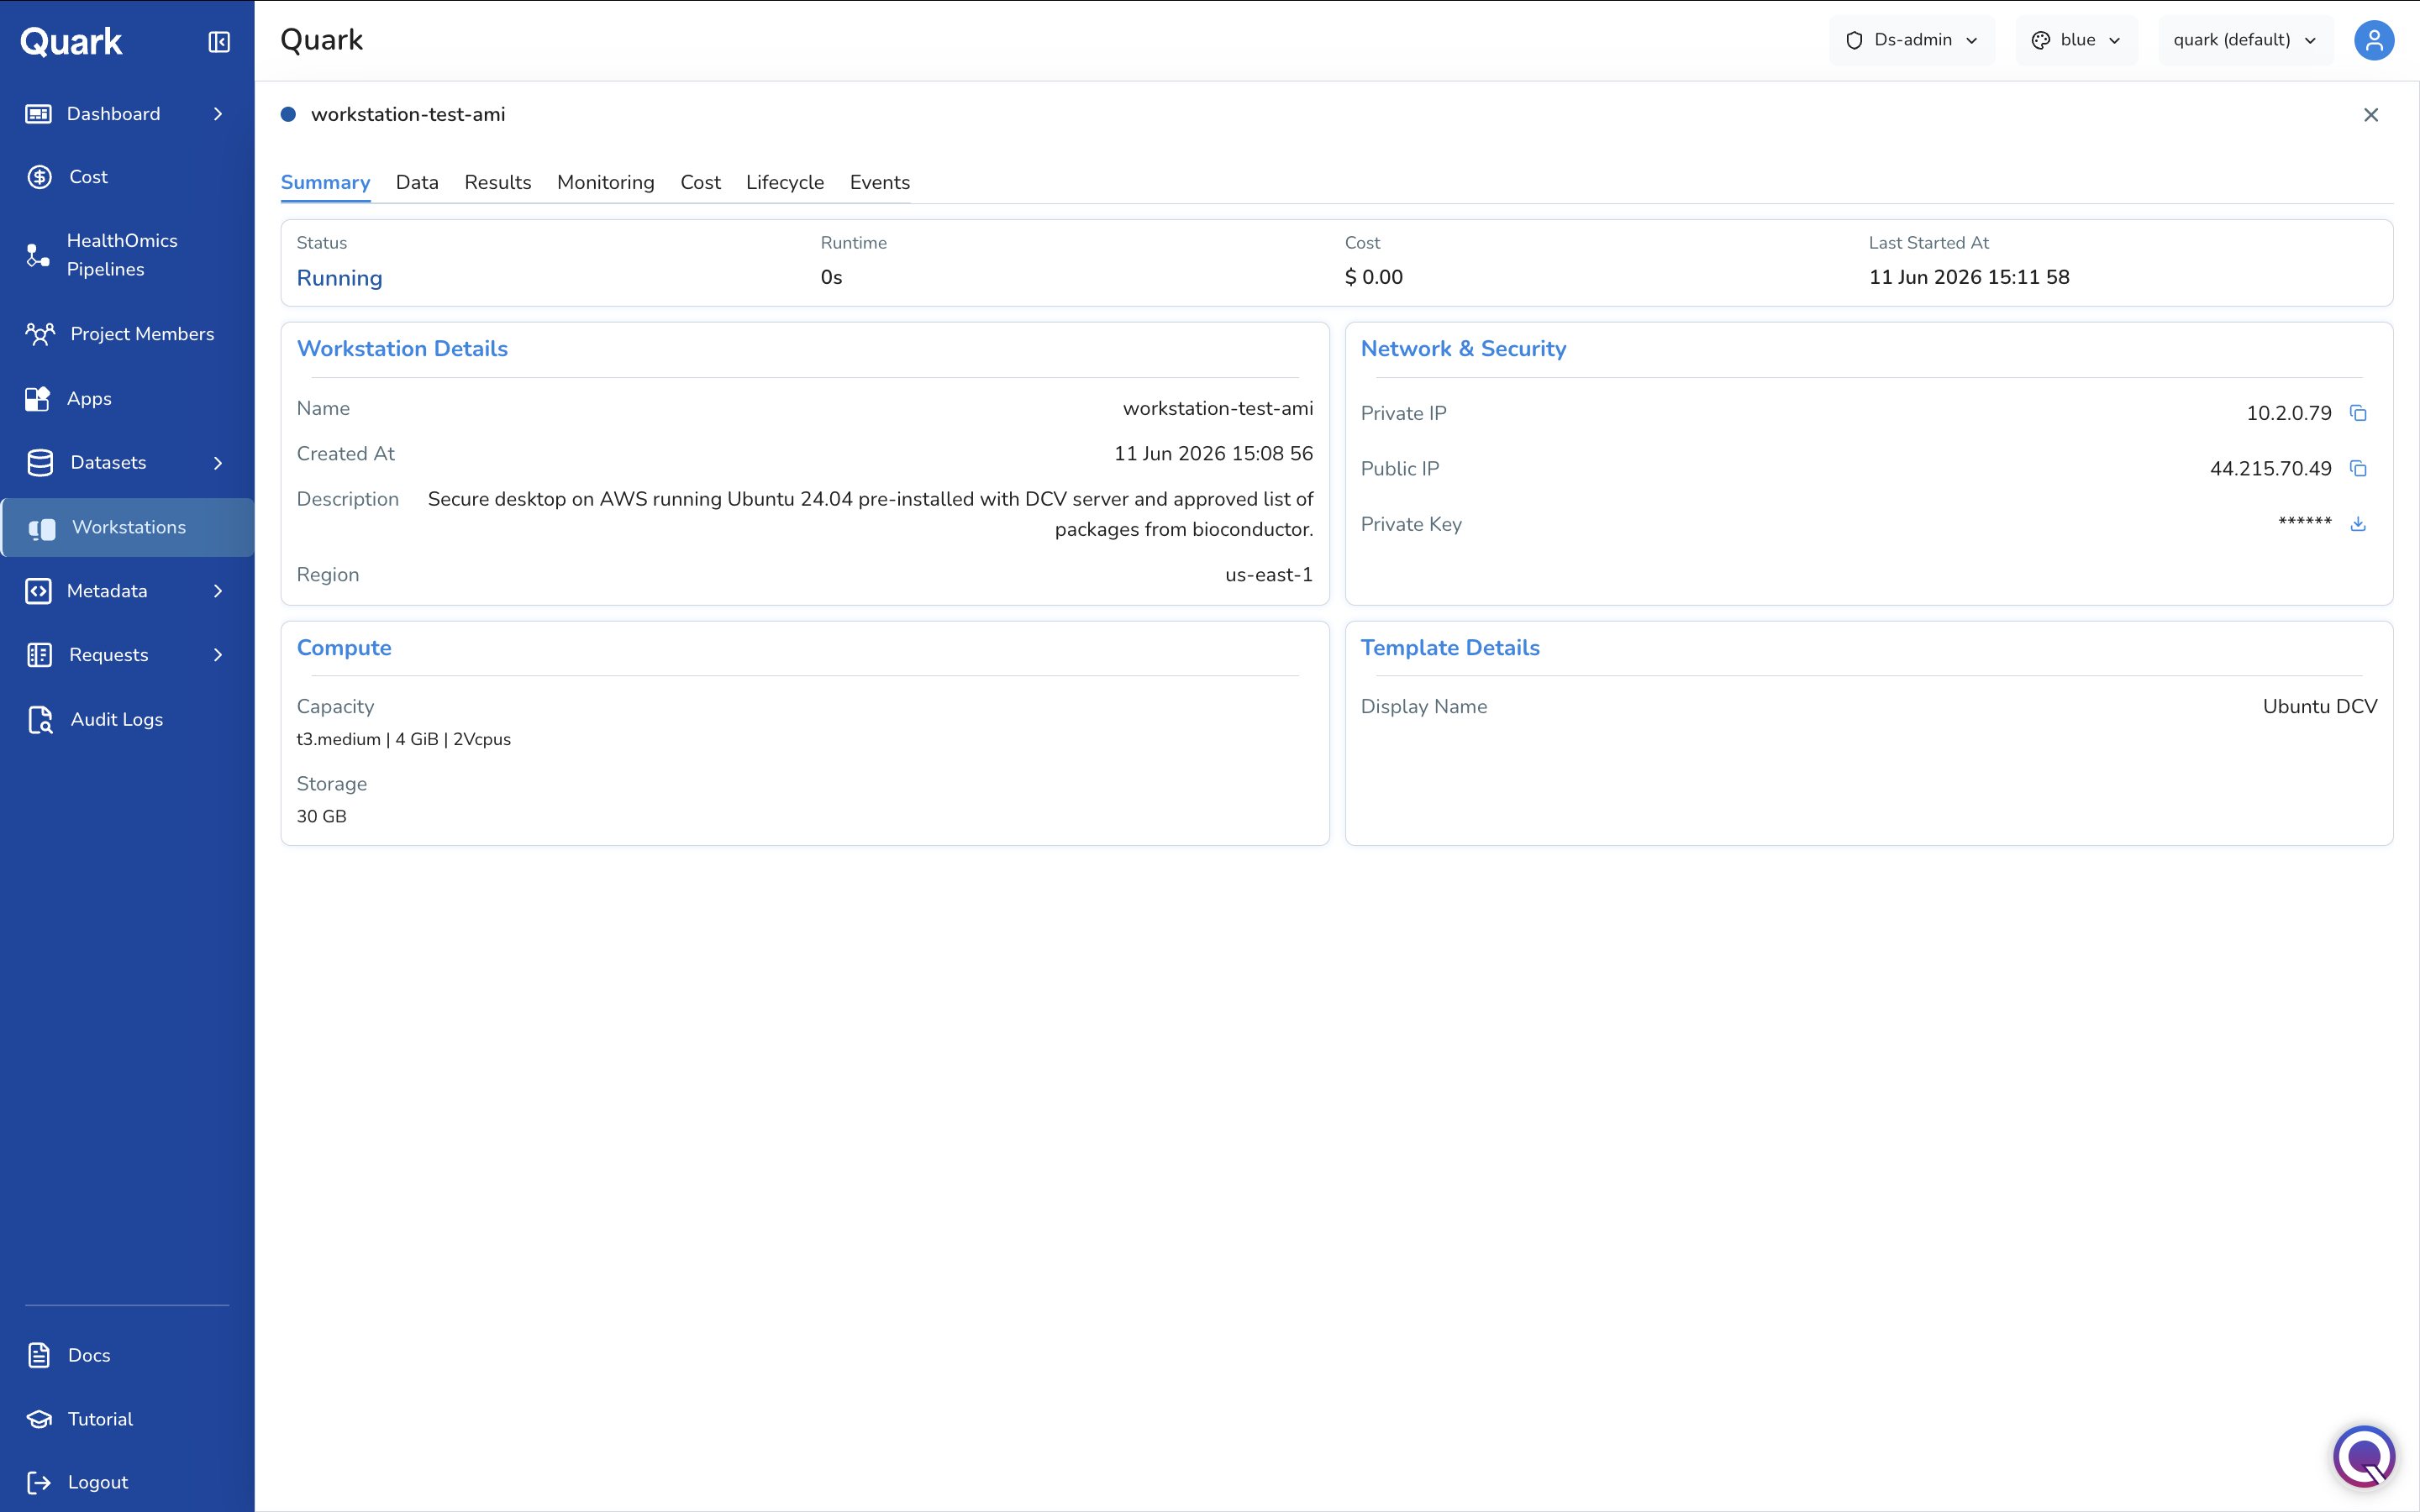
Click on any workstation's name in the list to open its detail view. This opens as a new screen, identified by the workstation's name and a status indicator dot at the top, with a close icon to return to the list.
The detail view is organised into seven tabs: Summary, Data, Results, Monitoring, Cost, Lifecycle, and Events.
Summary Tab
The Summary tab provides a complete snapshot of the workstation's configuration and current state.
| Section | Fields |
|---|---|
| Header | Status (e.g., Running), Runtime, Cost (accrued for the current session), and Last Started At. |
| Workstation Details | Name, Created At, Description, and Region. |
| Network & Security | Private IP and Public IP (each with a copy icon), and a masked Private Key with a download icon. |
| Compute | The Capacity (instance type, memory, vCPUs) and Storage allocated to the workstation. |
| Template Details | The Display Name of the image the workstation was built from. |
Note: Unlike the end-user workstation view, the DS Administrator's Summary tab surfaces the workstation's Private Key (downloadable) rather than a password — reflecting the administrator's oversight role rather than direct interactive use.
Data Tab
The Data tab shows the files and folders associated with the workstation's working directory.
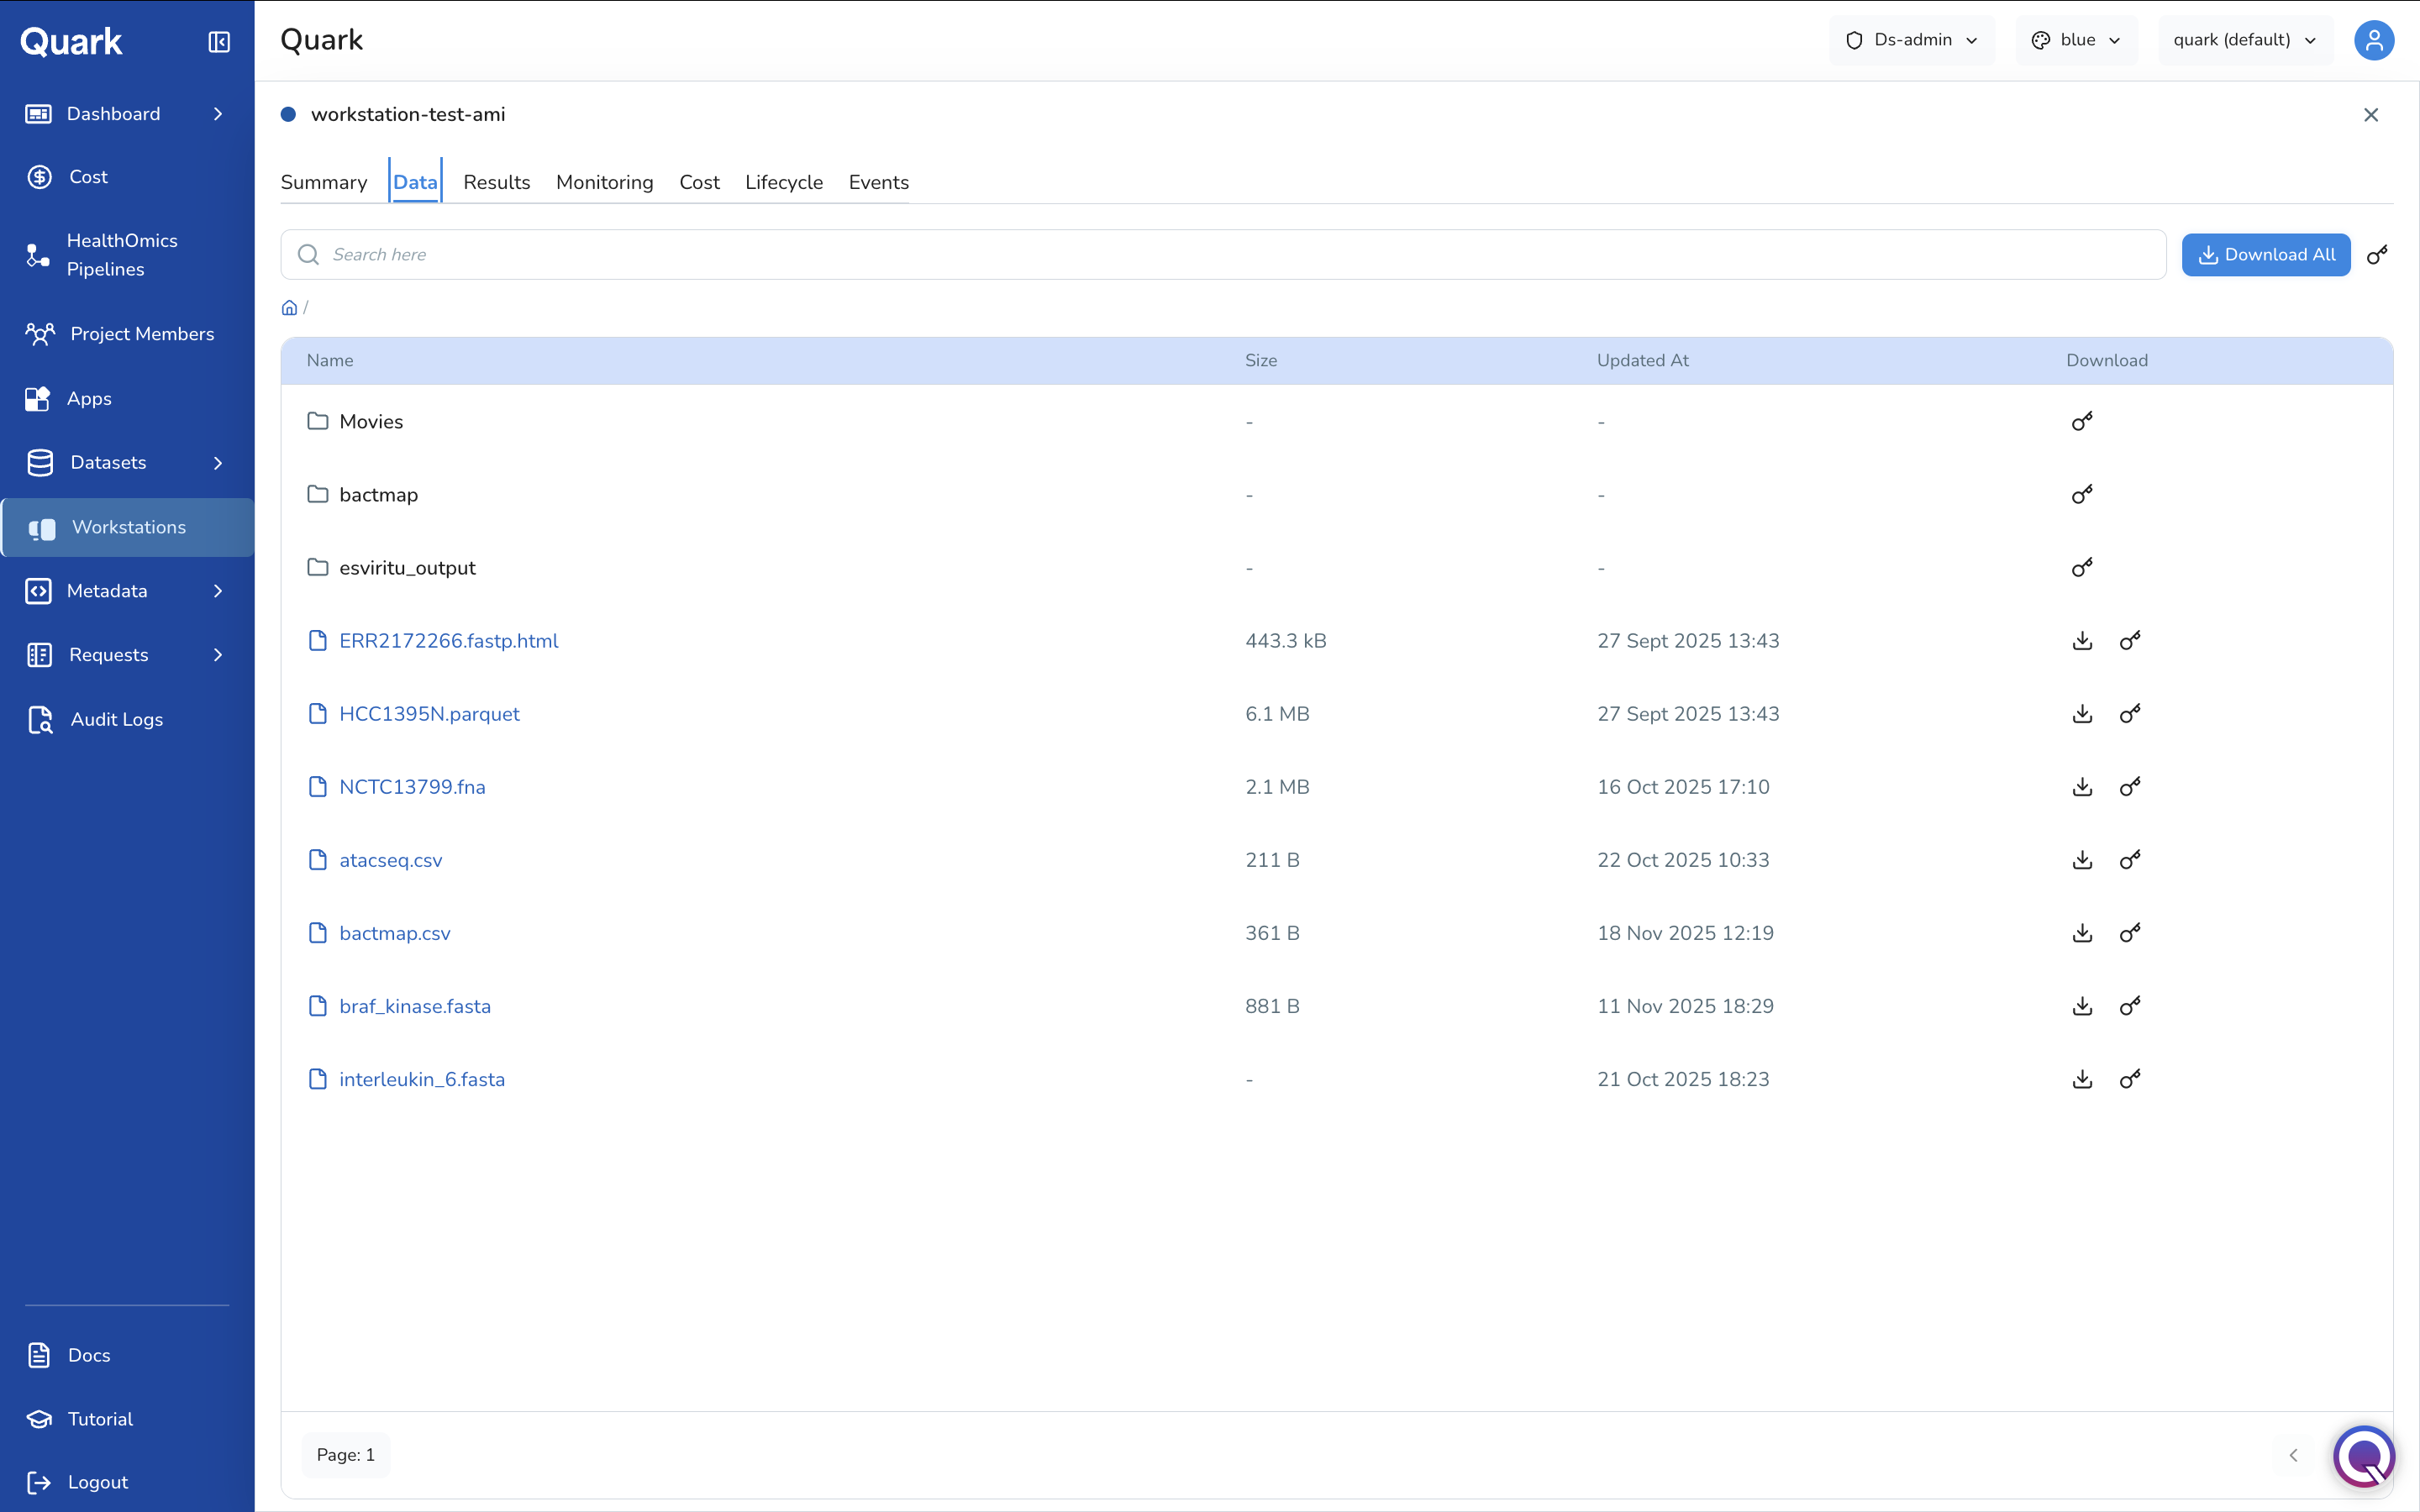
Each row shows the file or folder Name, its Size (where applicable), and when it was last Updated At. Use the Download column icons to download an individual file or copy a direct link to it. Use Download All to retrieve everything in the current directory, and the search bar to locate a specific file or folder by name.
Results Tab
The Results tab lists output files generated by the user's analysis on this workstation. The DS Administrator can review what outputs have been produced as part of routine oversight of project activity.
Monitoring Tab
The Monitoring tab provides resource utilisation charts for the workstation over a selectable date range.
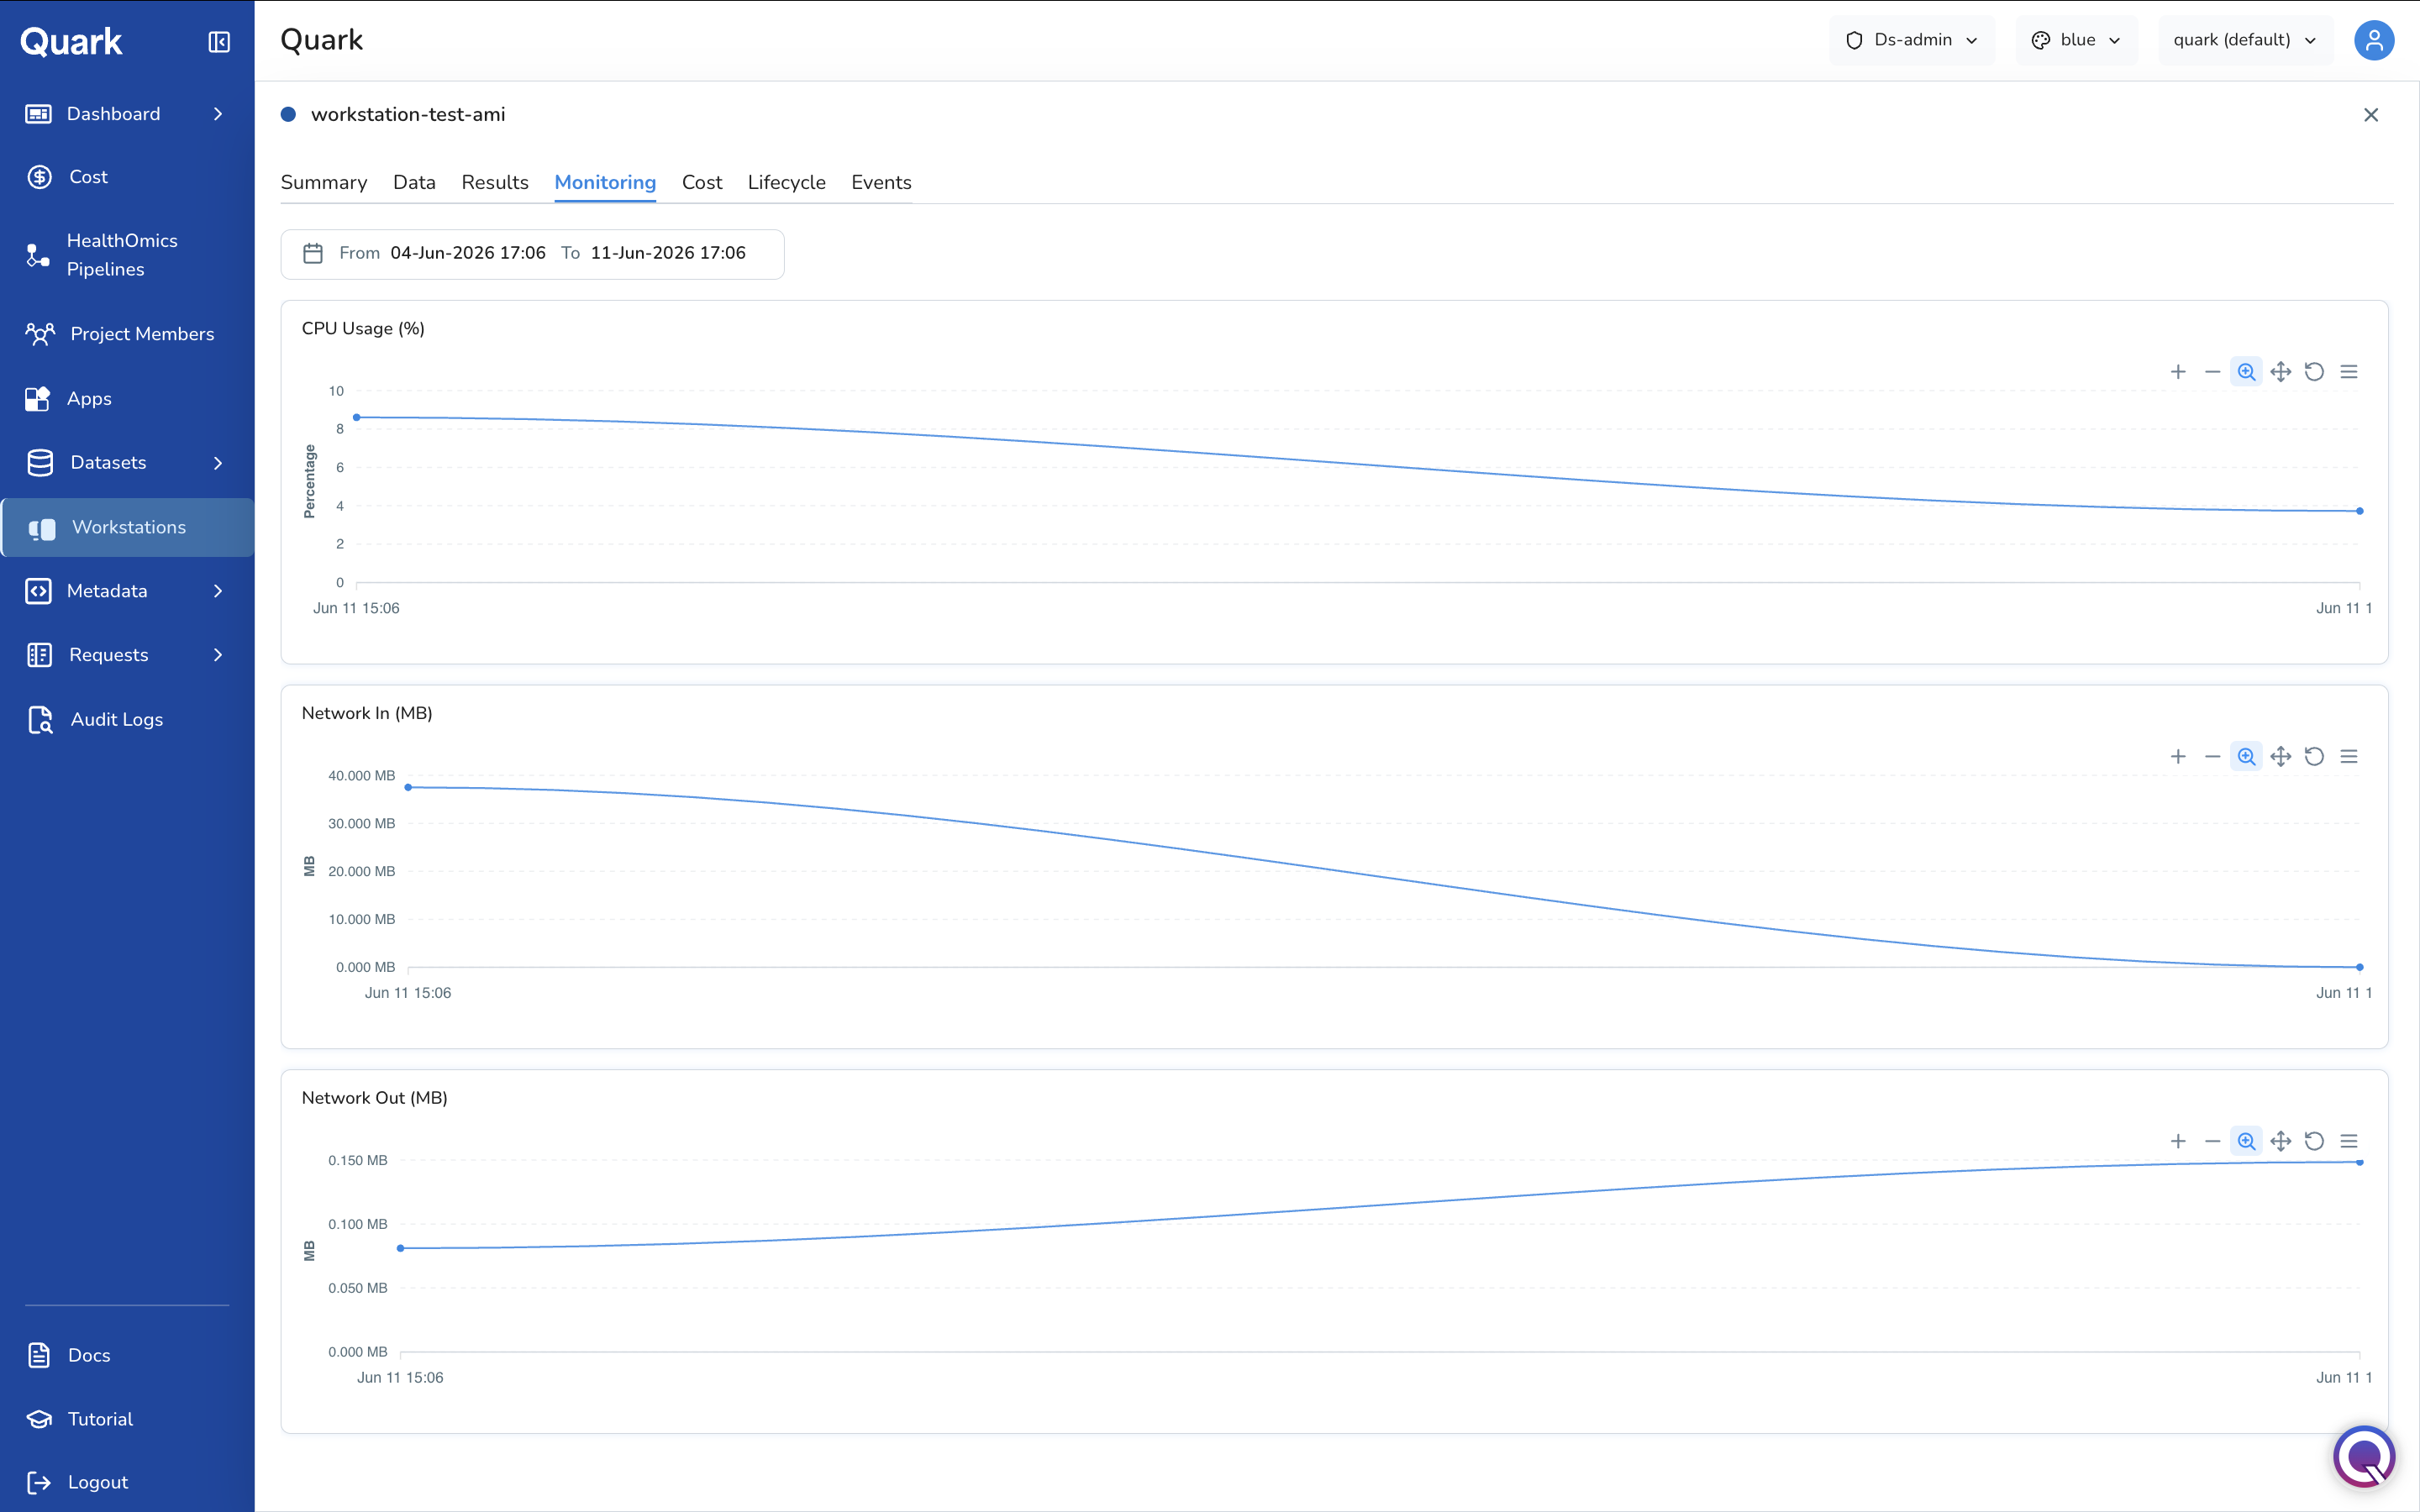
Use the From / To date range picker to set the monitoring window. Three charts are displayed:
- CPU Usage (%) — CPU utilisation over time.
- Network In (MB) — inbound network traffic over time.
- Network Out (MB) — outbound network traffic over time. Each chart supports zooming, panning, and resetting via the controls in its top-right corner.
Cost Tab
The Cost tab shows the cost breakdown for this workstation. Use it alongside the platform-wide Cost dashboard to understand how an individual workstation contributes to overall project spend.
Lifecycle Tab
The Lifecycle tab shows any automated start/stop policies configured for the workstation.
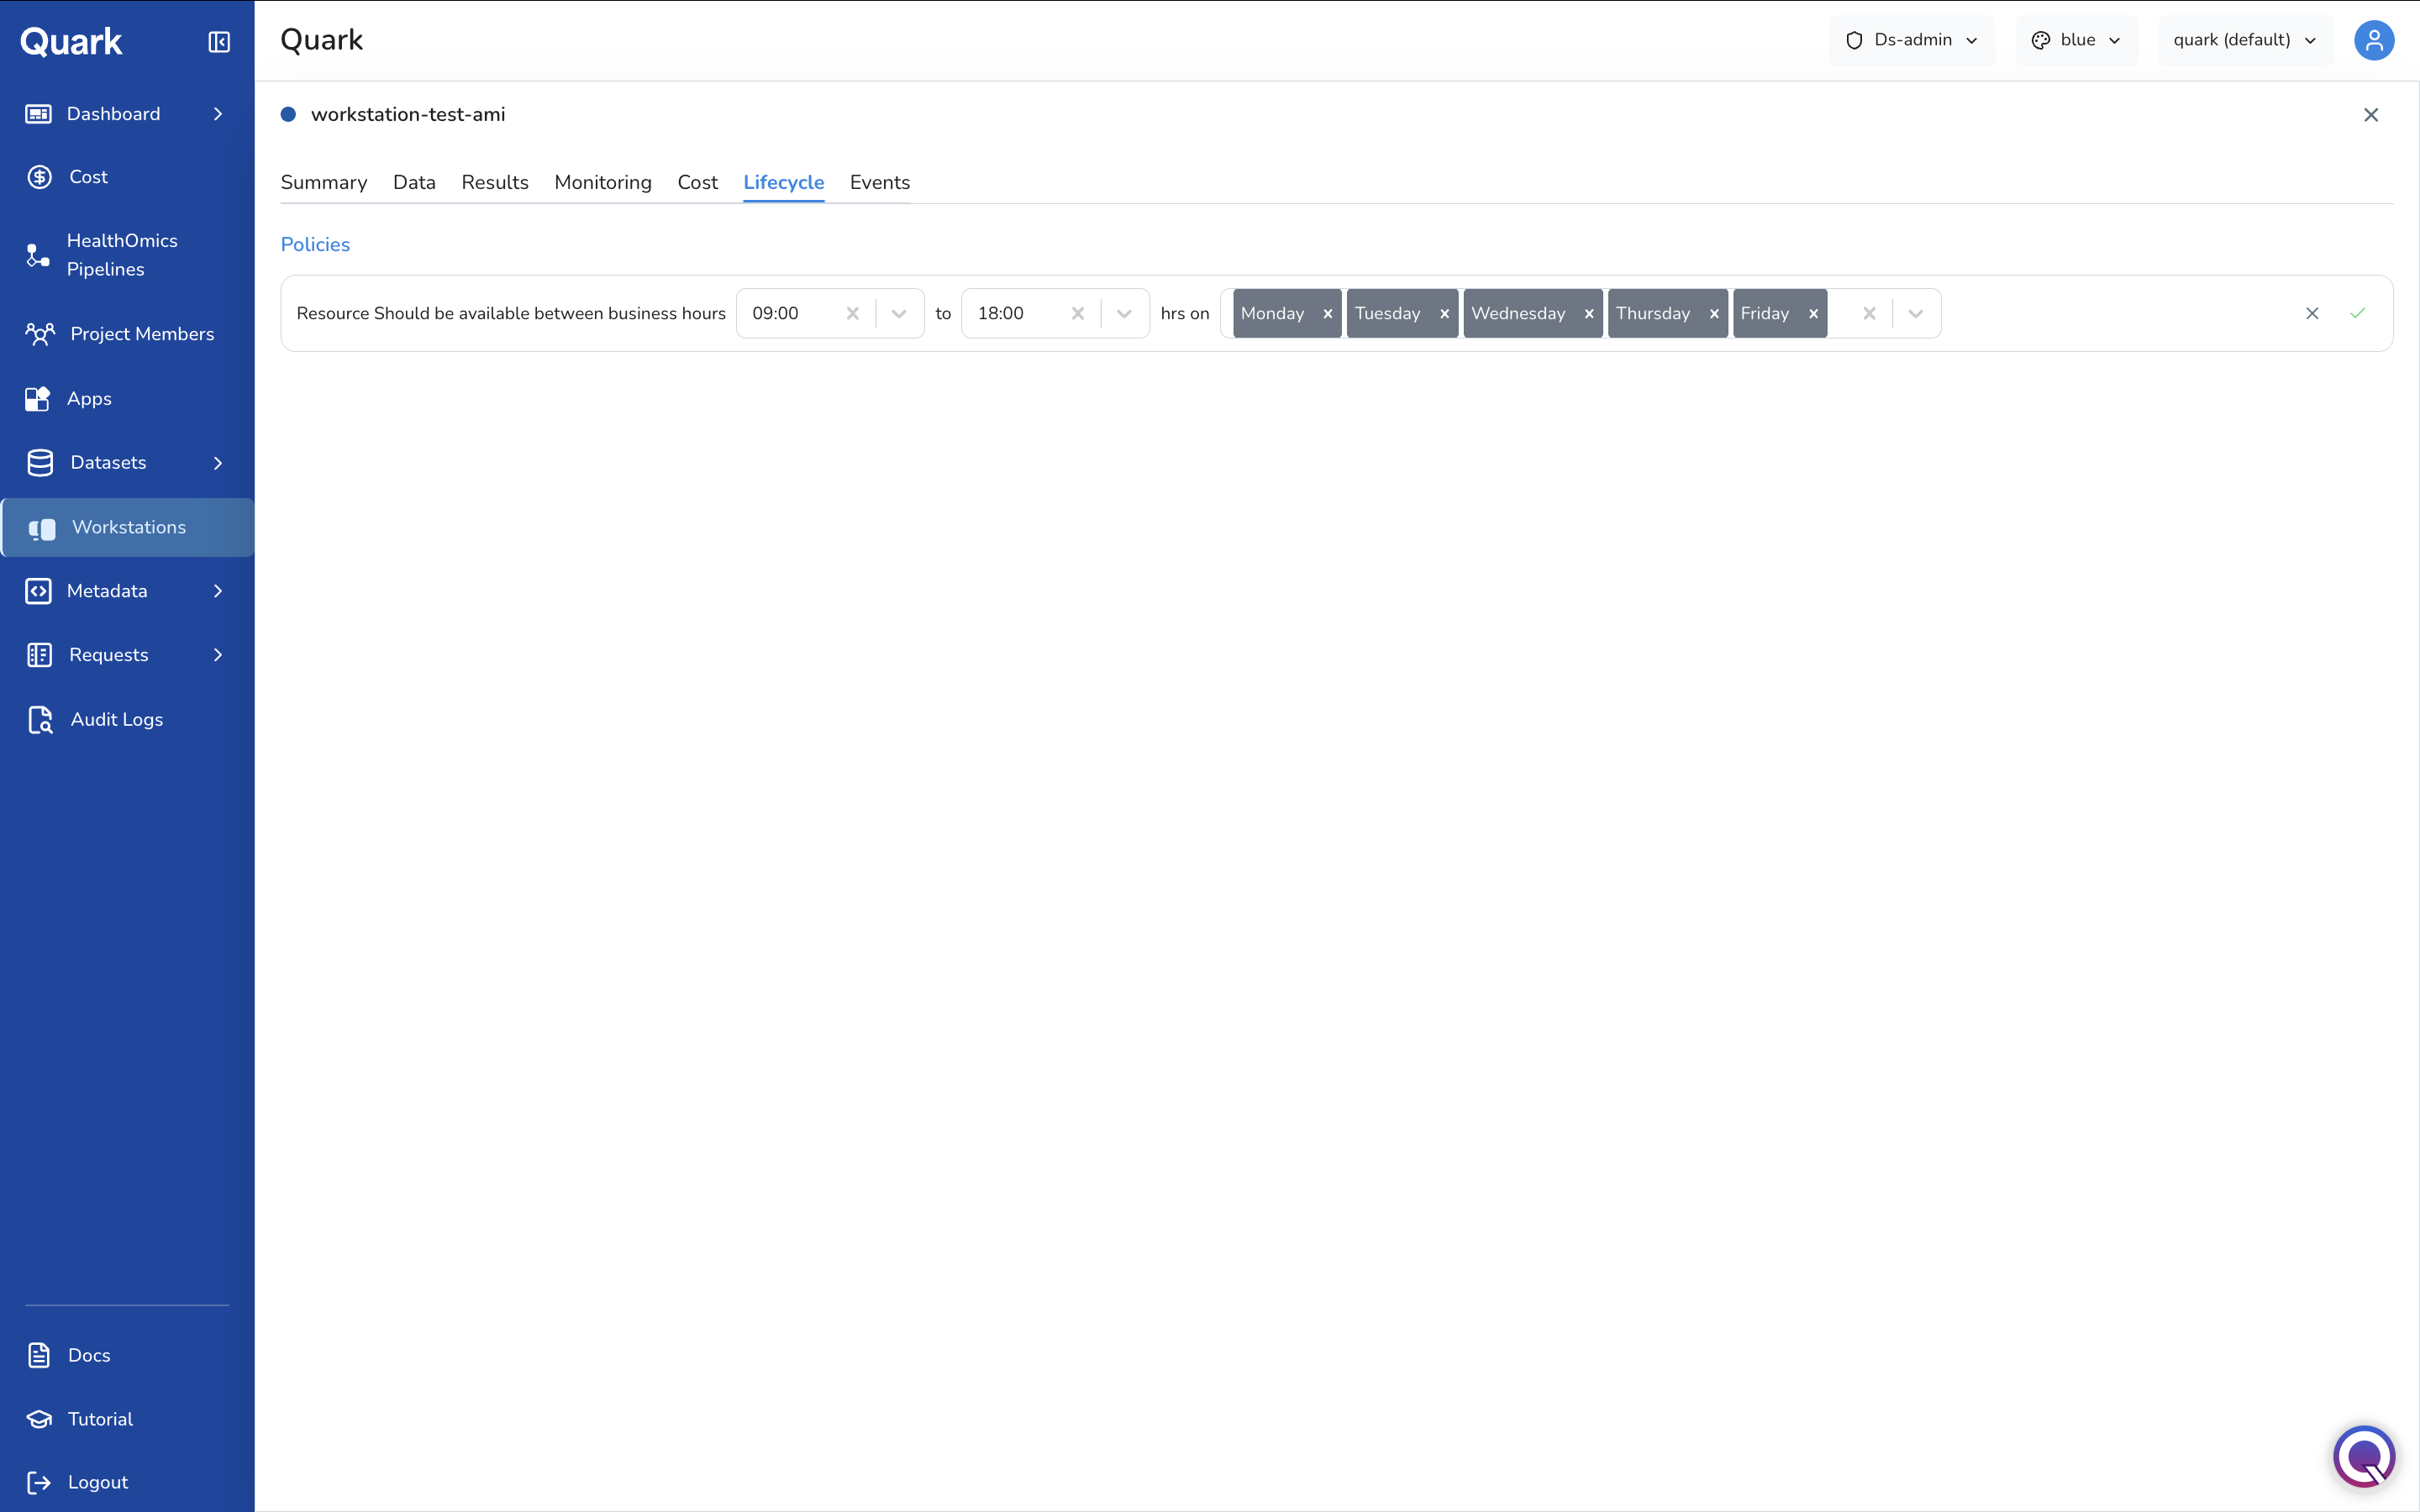
Each policy row describes a rule in plain language — for example, "Resource should be available between business hours 09:00 to 18:00 hrs on Monday, Tuesday, Wednesday, Thursday, Friday" — along with the time range and days the policy applies to. Use the x icons to remove a time, day, or the entire policy, and the checkmark icon to confirm changes.
Tip: If you notice a workstation running outside expected hours in the Audit Logs, check whether a lifecycle policy is missing or misconfigured.
Events Tab
The Events tab provides a chronological log of activity for this workstation — creation, status changes, start, stop, and any errors — each with a timestamp. Use this tab when investigating a specific workstation's history, for example following up on an entry found in the Audit Logs.
What's Next
- Cost — Filter by Workstations to monitor compute spend from active workstation instances.
- Requests — Review user requests for workstation access, including approvals for new workstation provisioning.
- Audit Logs — Review workstation launch, access, and termination events for compliance purposes. Workstation-specific audit entries also surface the template used and any datasets the workstation accessed.