Apps
Overview
The Apps section is where users — including the DS Administrator — create, configure, and manage visualisation applications for exploring and interpreting pipeline outputs. Apps are containerised tools that run on the platform's managed infrastructure alongside your pipeline workloads, giving researchers an interactive way to view, query, and explore their data without leaving the platform.
An app can be as simple as a single visualisation tool — such as IGV for browsing alignment files — or a more complex multi-service environment combining a frontend interface with a backend processing service. Because apps run independently of pipeline jobs, they remain available for interactive exploration even after a pipeline run has completed.
The DS Administrator interacts with Apps in the same way as a bench scientist or bioinformatician: there are no DS Administrator-specific controls in this section. Apps created here are scoped to the project you are currently working in.
Navigation: Select Apps from the left-hand navigation pane.
The Apps Page
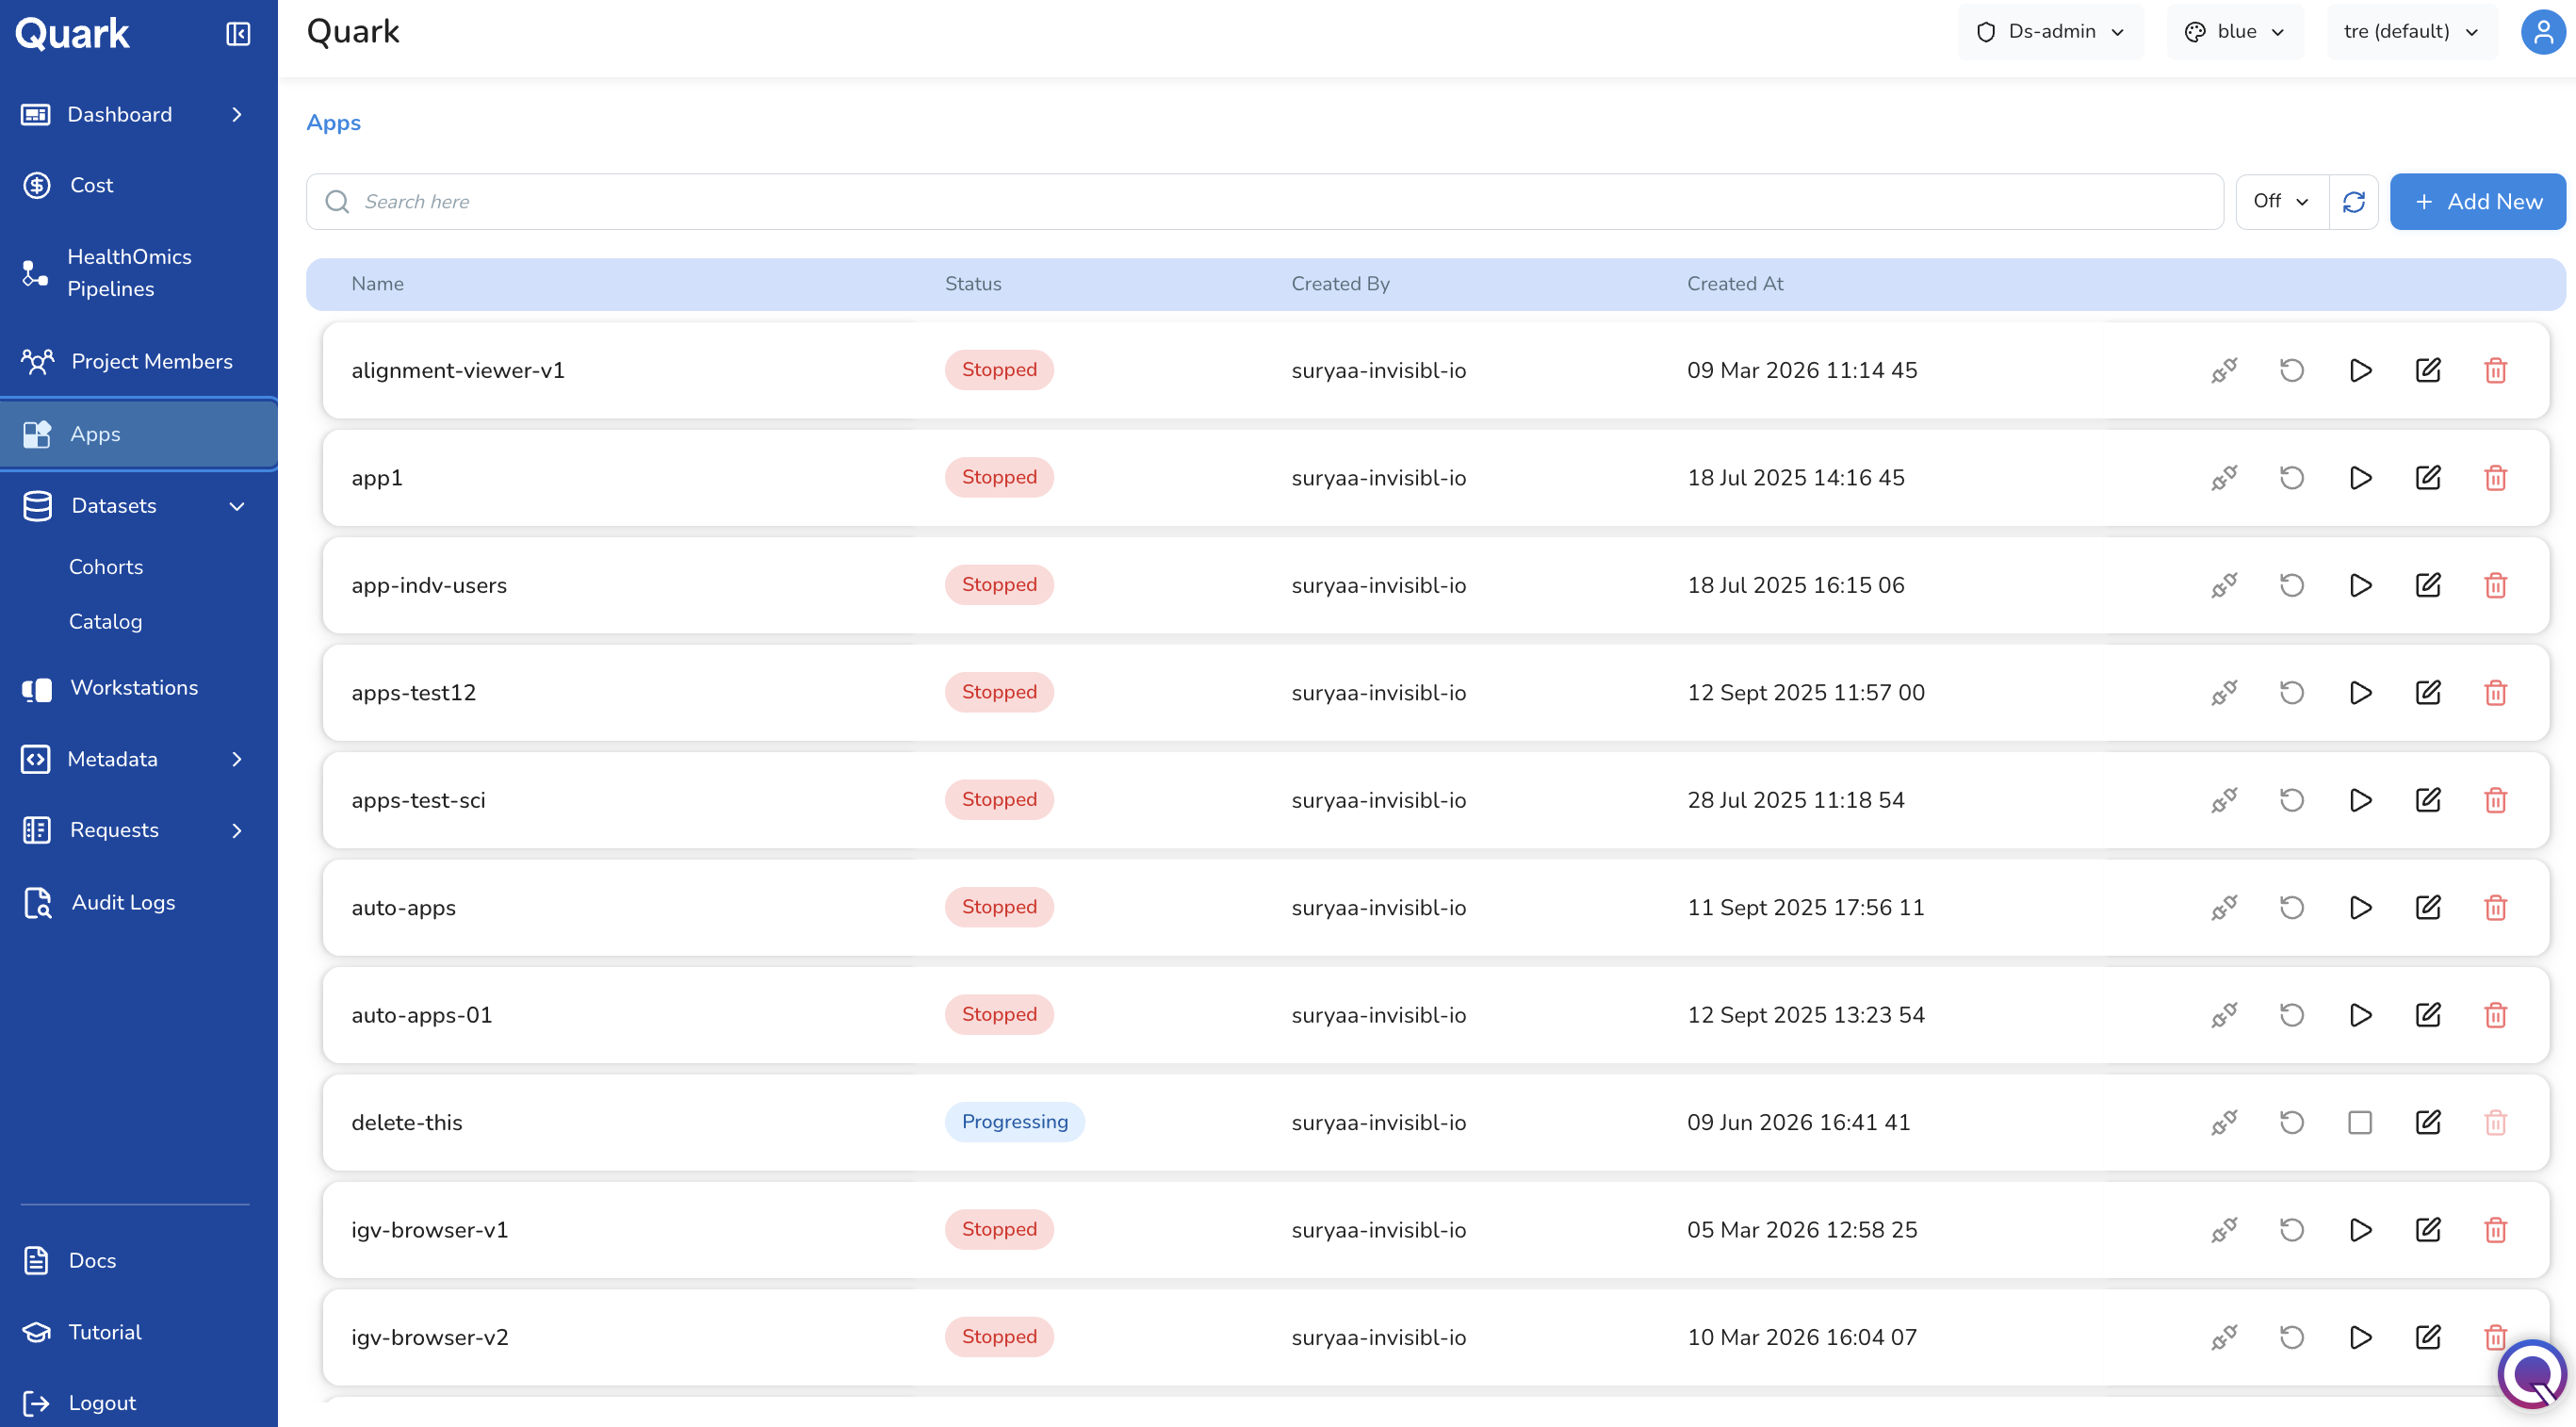
When you open Apps, you see a list of every visualisation application that has been configured within the current project. Each row shows the app's name, its current status (e.g., running, stopped), and its compute size — giving you a quick overview of what's deployed and how much resource it's consuming.
Click an app's name at any time to open it directly in your browser.
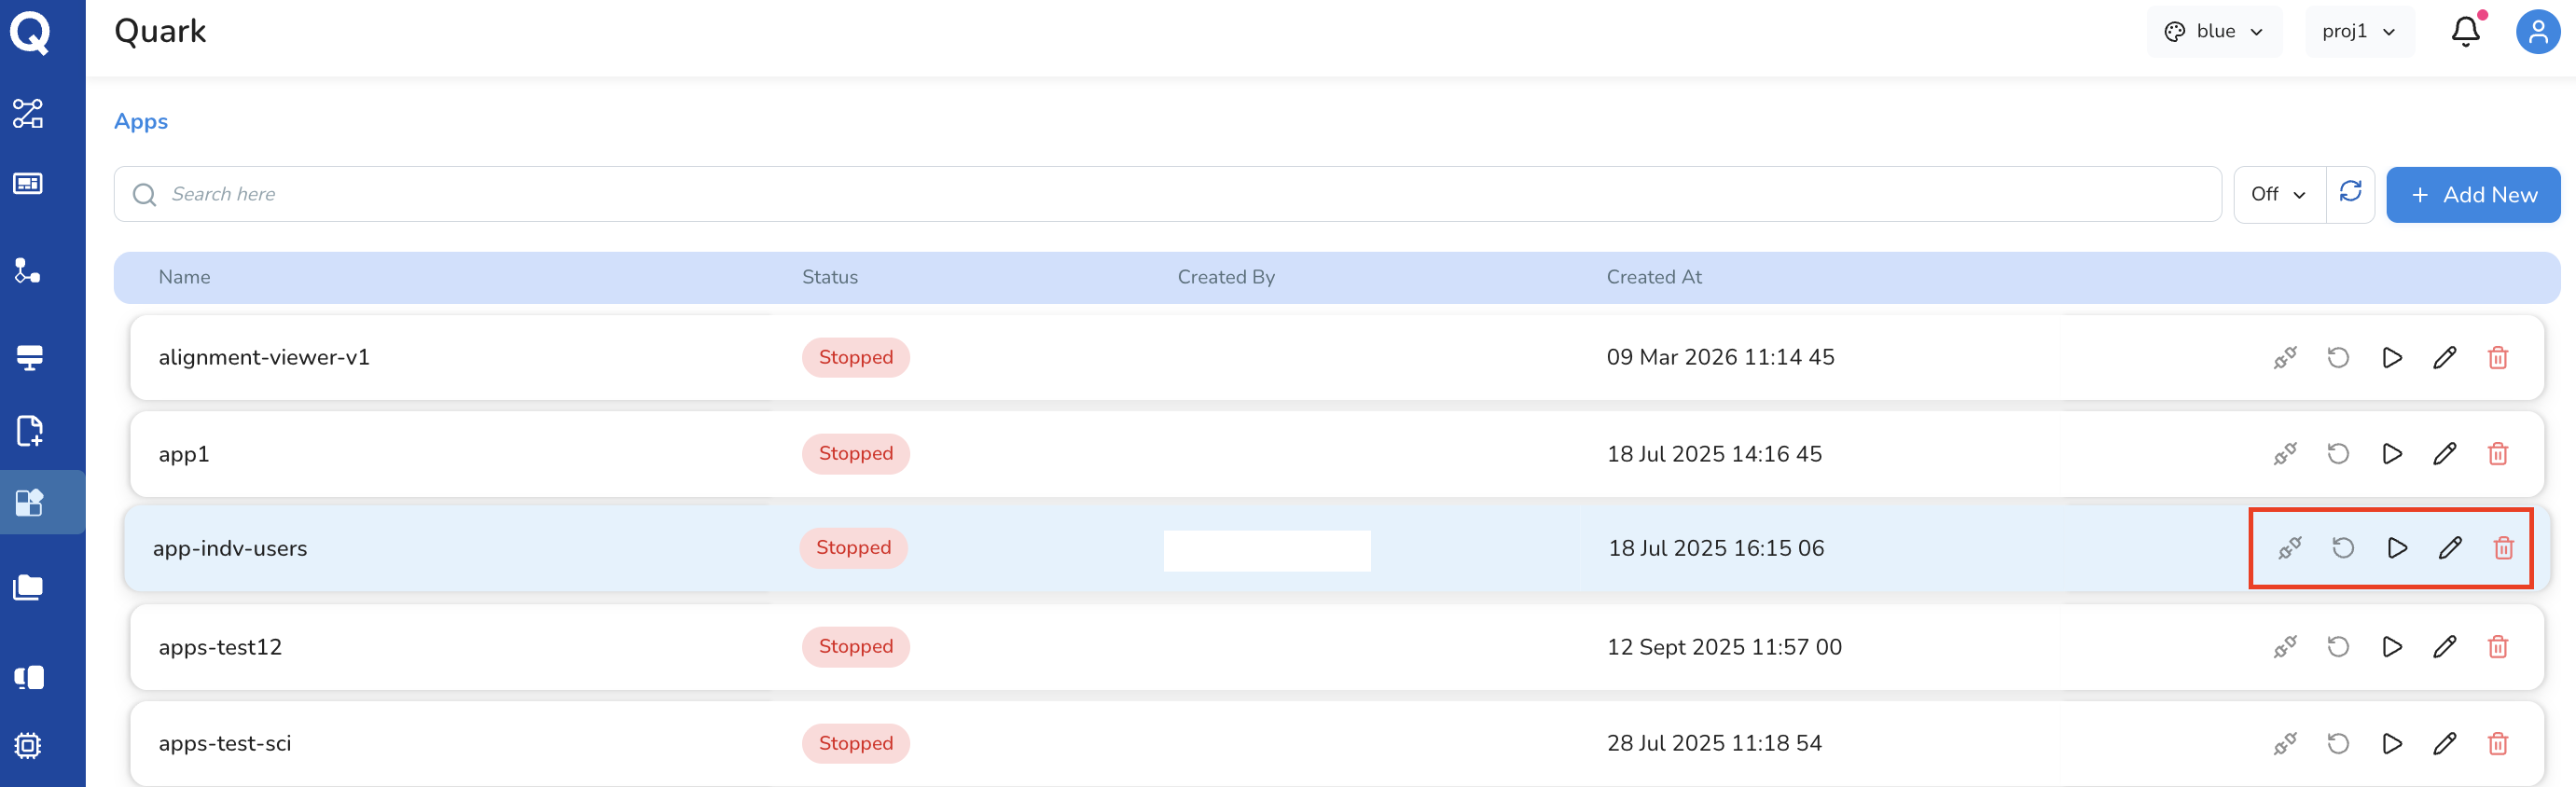
Row Actions
Each row in the Apps list also provides a set of action icons for managing that app's lifecycle:
| Icon | Action |
|---|---|
| Connect | Start and connect to the app — opens the visualisation tool in your browser. |
| Re-run | Re-launch the app using its existing configuration. Useful if the app needs to be refreshed against updated data without reconfiguring it from scratch. |
| Start | Start a previously stopped app without reconfiguring it. |
| Edit | Modify any aspect of the app's configuration — general details, services, datasets, or permissions. |
| Delete | Permanently remove the app and its configuration. This action cannot be undone. |
Tip: Use Search at the top of the Apps page to quickly locate an app by name, particularly useful in projects with many configured apps.
Creating a New App
Setting up a new app involves walking through a four-step configuration wizard. Each step covers a different aspect of the app's configuration — from its basic identity, through to the compute resources it needs, the data it should have access to, and who is allowed to use it.
To add a new visualisation app:
- Select Apps from the left navigation pane.
- Click Add New in the top-right corner.
-
Complete the four configuration tabs, in order: General, Services, Datasets, and Permissions.
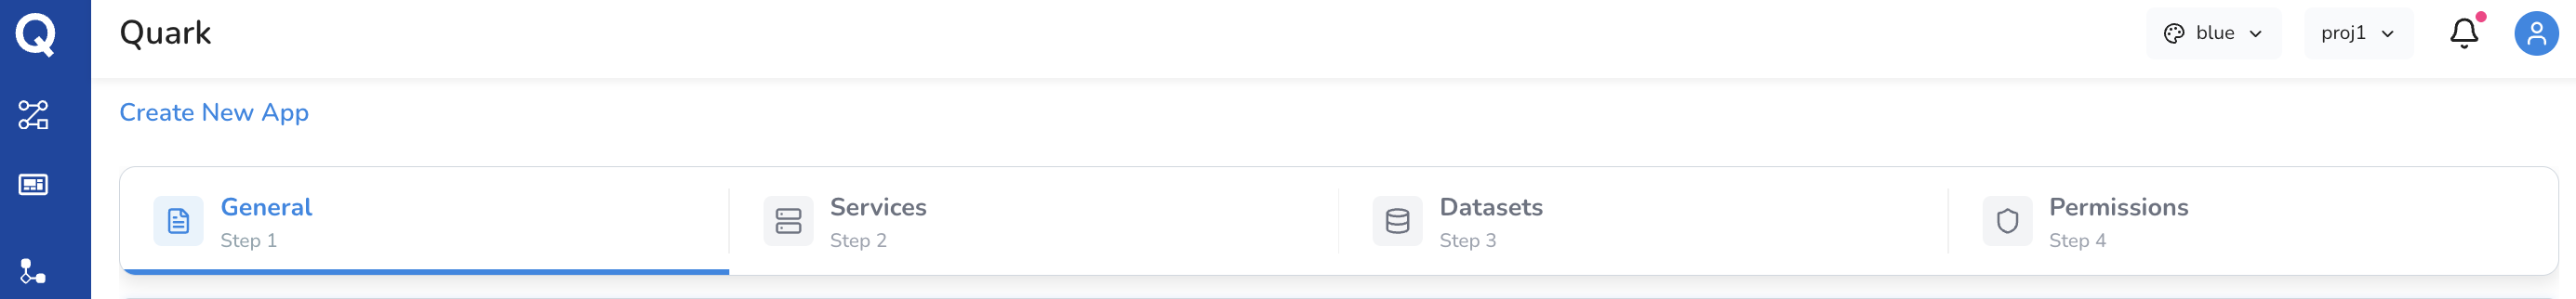
Each tab is described in detail below. You can move between tabs as you go, but all required fields across all four tabs must be completed before the app can be created.
Step 1: General
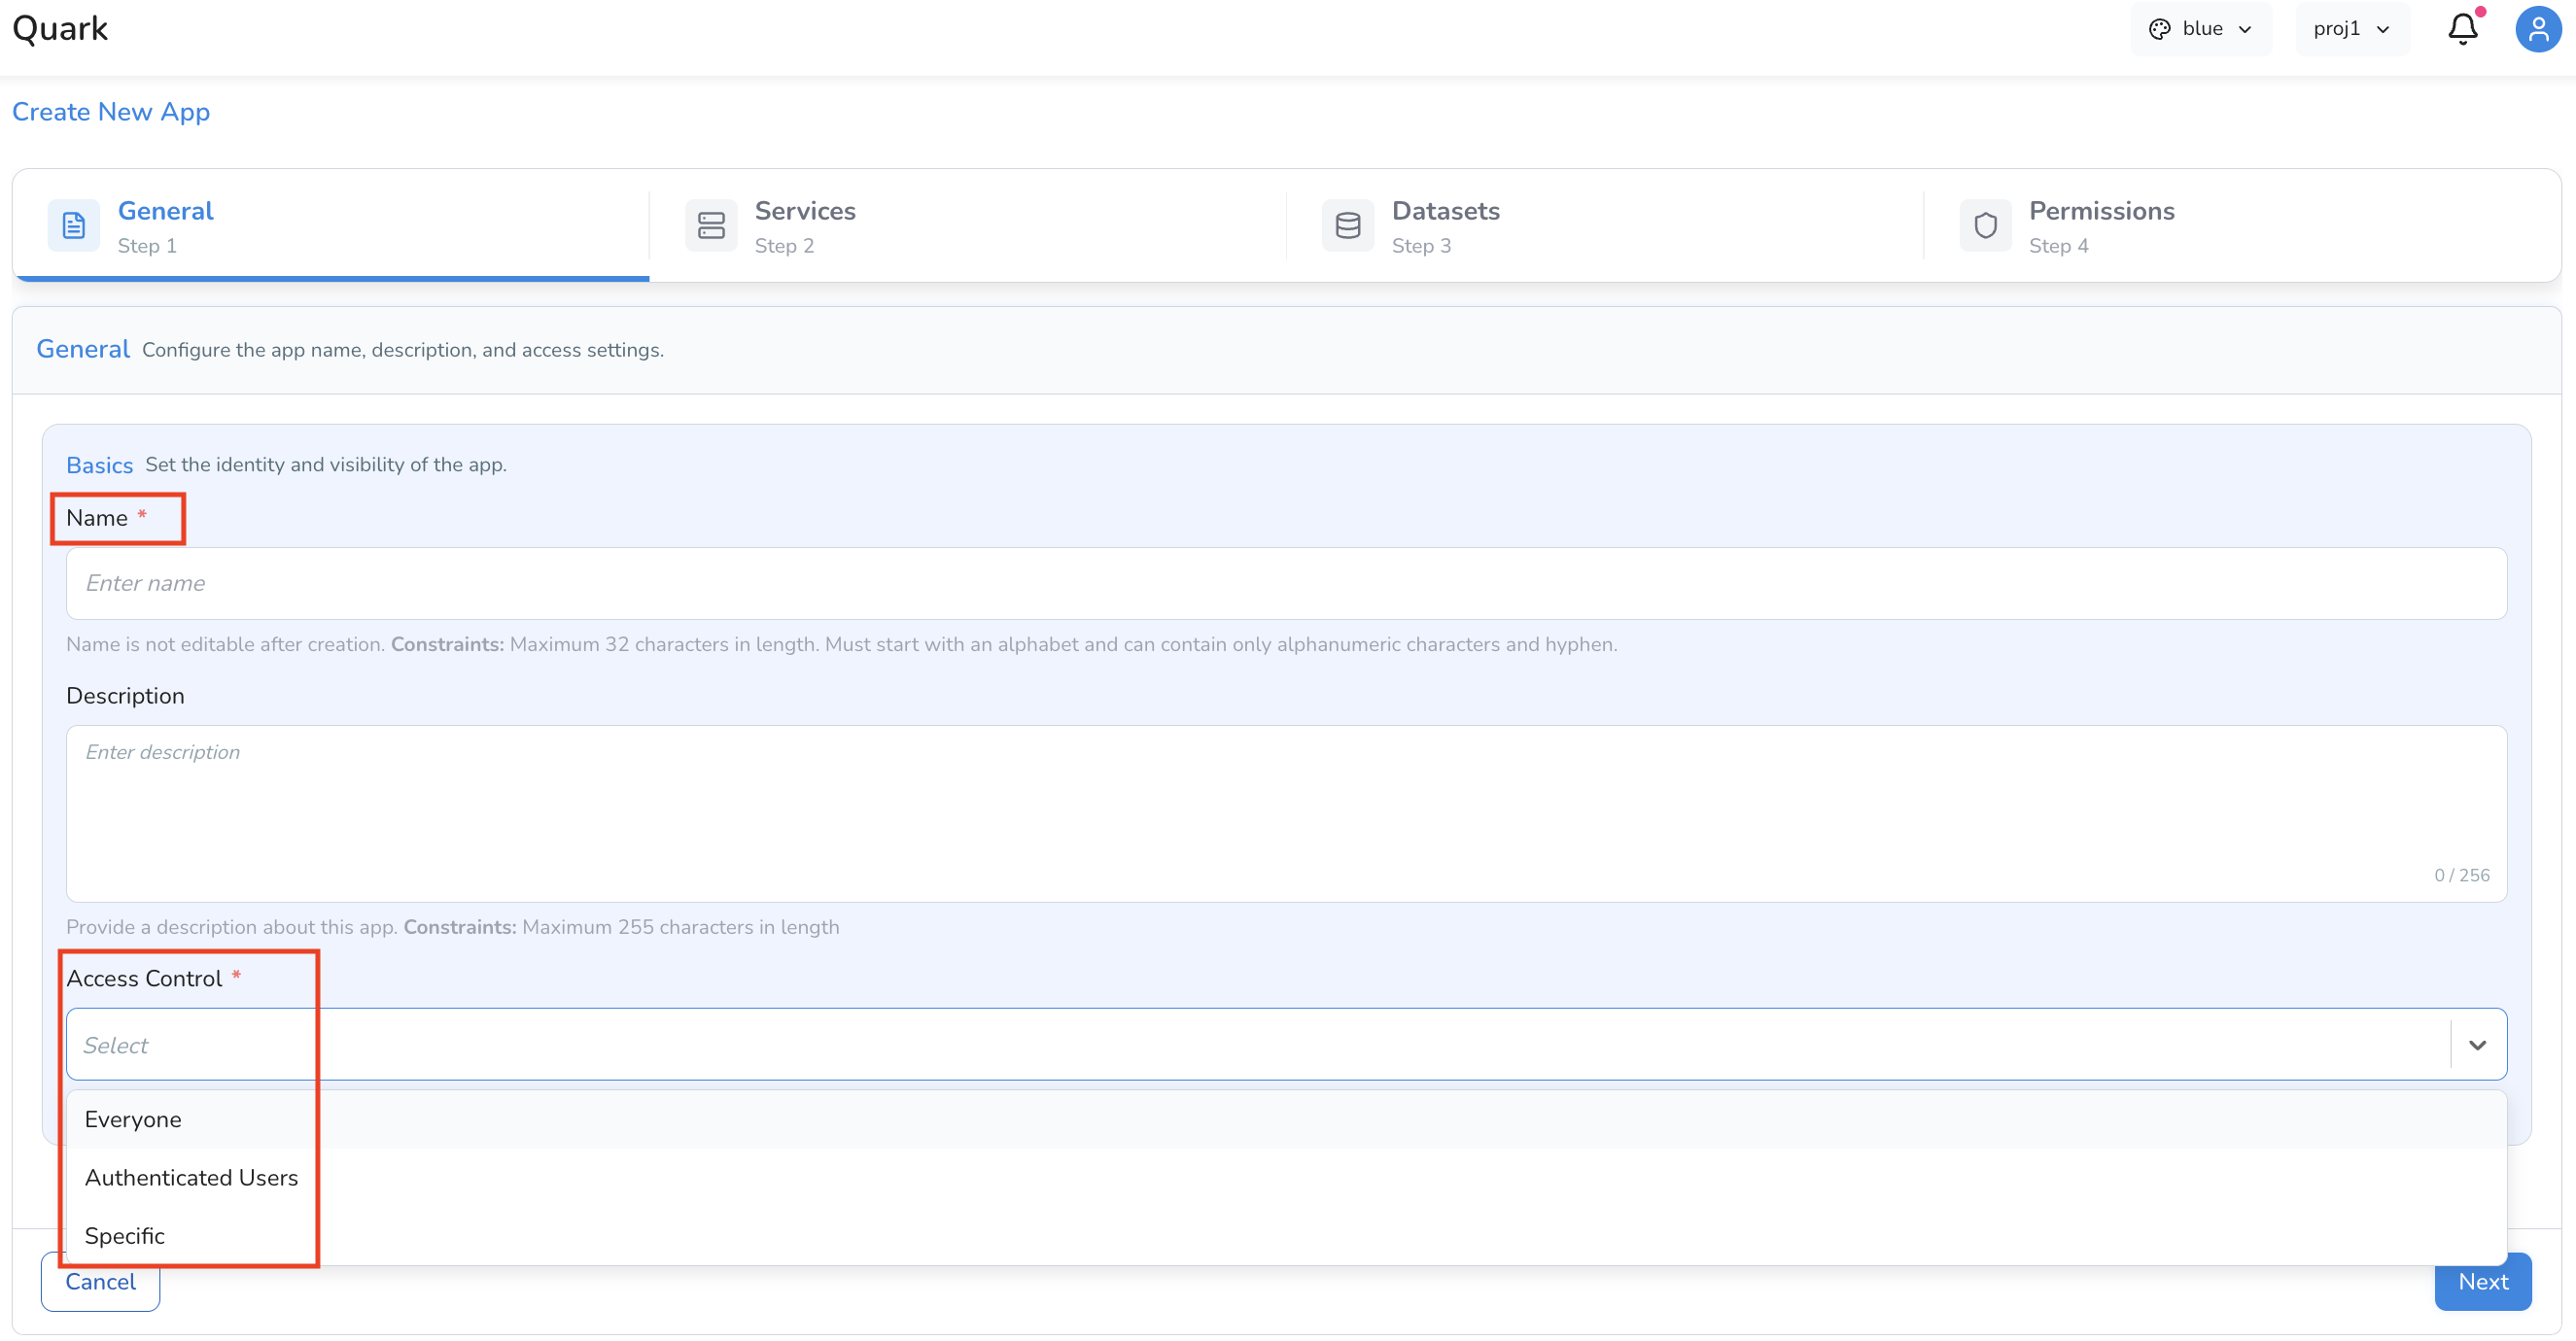
The General tab captures the basic identifying information for your app — the details that will help you and other users find and recognise it later.
| Field | Description |
|---|---|
| Name | A short, descriptive name (e.g., IGV-DNA-Seq-Viewer). Choose a name that makes the app's purpose clear at a glance, especially in projects where multiple apps are configured. |
| Description | A brief summary of the app's purpose — what it visualises, and what kind of output or dataset it's intended for. |
| Access Control | Who can access this app: Everyone, Authenticated Users, or Specific (individual users or groups). This is a preliminary access setting; fine-grained permissions are configured later in the Permissions tab. |
Step 2: Services
The Services tab is where you define what actually runs inside your app — the container image, the compute resources it needs, and any runtime configuration. Every app requires at least one service, but more complex apps can define multiple services working together (for example, a frontend visualisation layer paired with a backend data-processing service).
The Services tab is broken down into four groups of settings, described below.
Identity and Container
These fields define which container image will be deployed and how it's identified within the app.
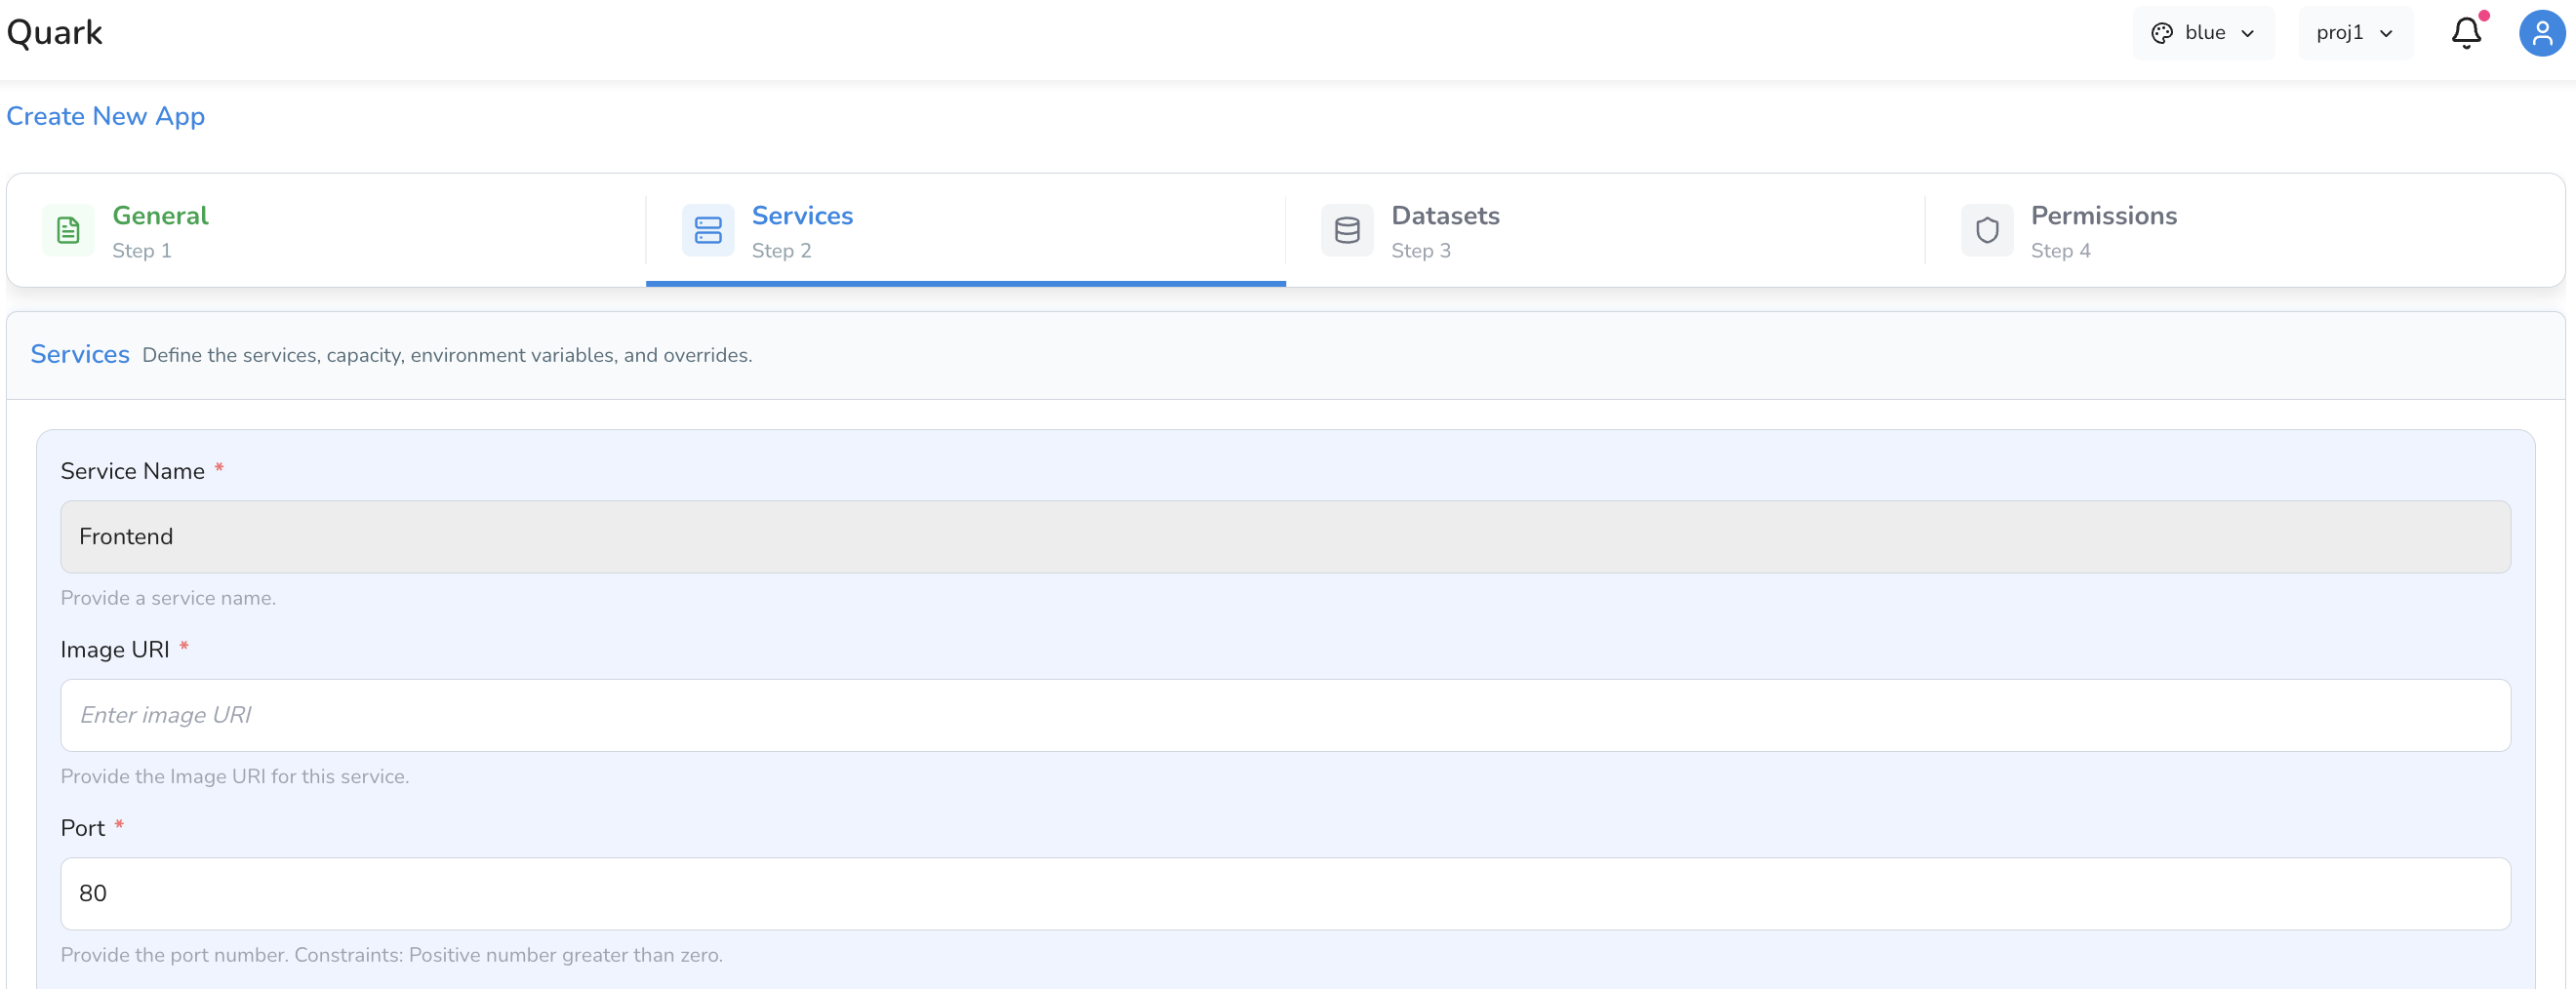
| Field | Description |
|---|---|
| Service Name | A name for this service. Defaults to Frontend. If your app has multiple services, give each one a distinct, descriptive name so they're easy to tell apart. |
| Image URI | The container image URI for the visualisation tool — for example, a Docker image hosted on AWS ECR or Docker Hub. |
| Port | The port the service listens on. Defaults to 80. |
Compute Resources
These fields determine how much compute capacity is allocated to the service when it runs.
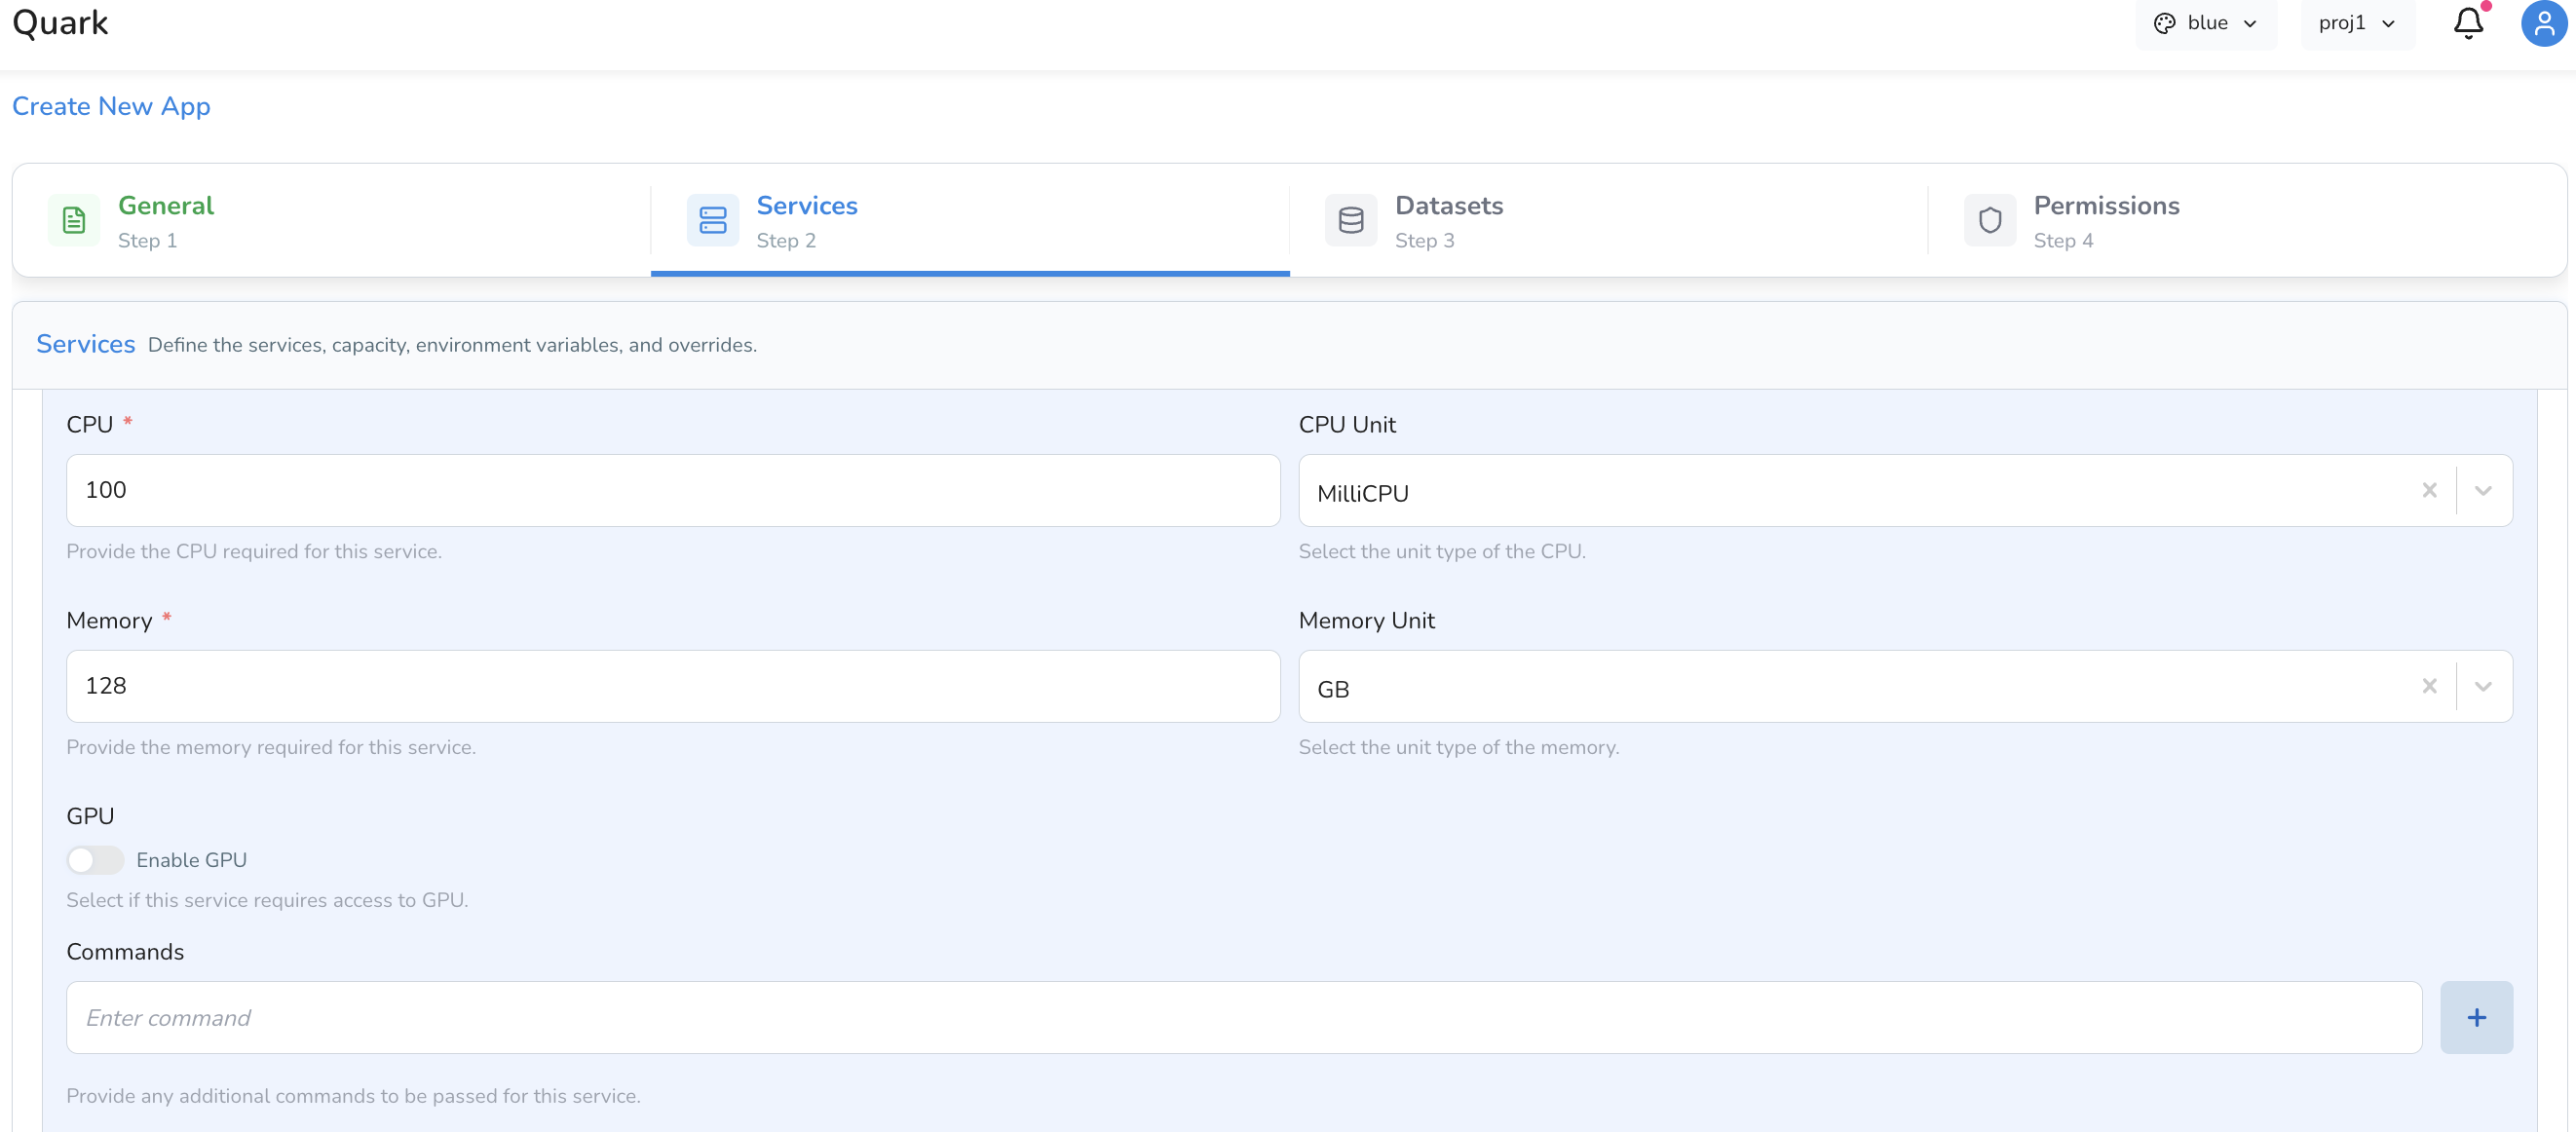
| Field | Description |
|---|---|
| CPU | Number of CPU units to allocate. |
| CPU Unit | The unit for the CPU value — e.g., millicores or cores. |
| Memory | Amount of memory to allocate. |
| Memory Unit | The unit for memory — e.g., Mi for mebibytes, Gi for gibibytes. |
| GPU | Toggle on if the service requires GPU acceleration — for example, for GPU-accelerated rendering or compute-intensive visualisations. |
Tip: Start with conservative compute values and scale up if the app feels slow or unresponsive. Over-allocating compute for lightweight visualisation tools can unnecessarily increase project costs.
Runtime Configuration
These fields control what happens when the container starts, and how it behaves during execution.
| Field | Description |
|---|---|
| Commands | Commands to run when the container starts. Leave blank to use the image's default startup behaviour. |
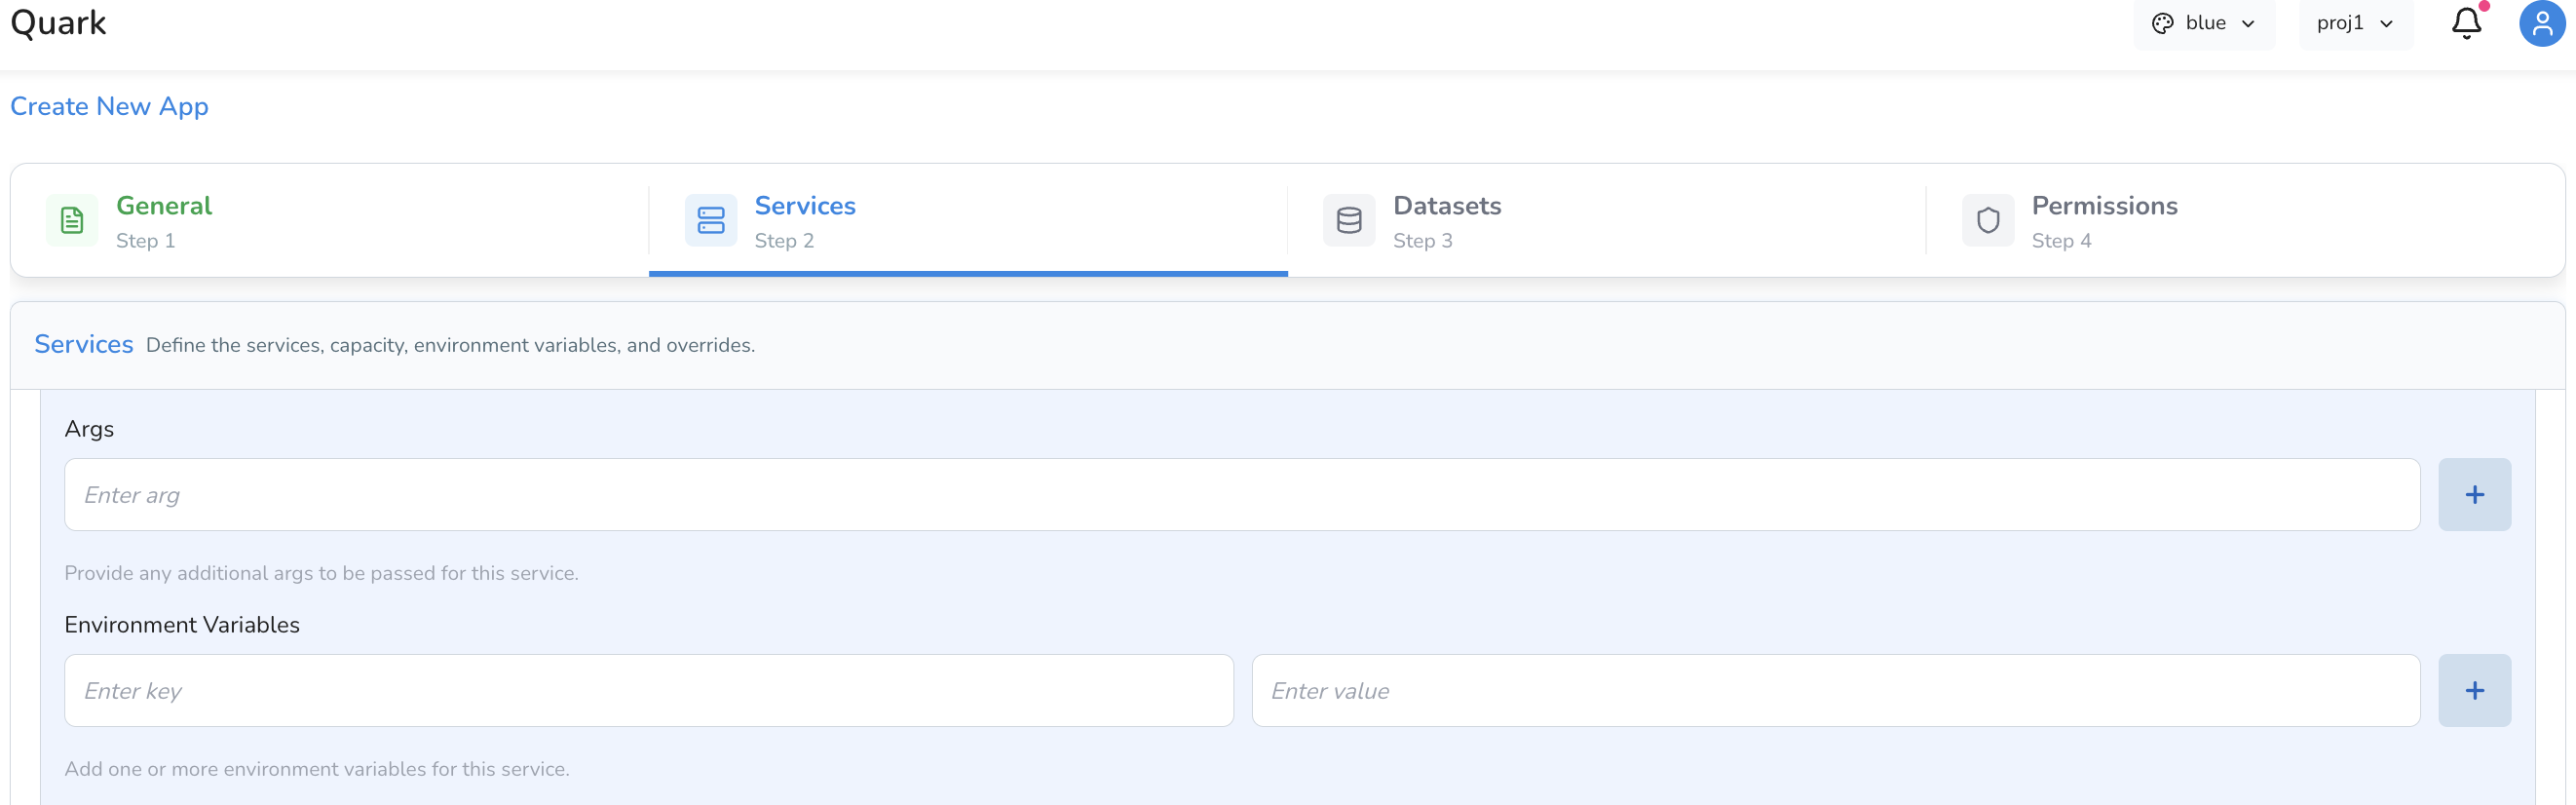
| Args | Arguments to pass to the container's entry command. |
| Environment Variables | Key-value pairs that will be available as environment variables within the running container — useful for passing configuration values, API endpoints, or feature flags without modifying the image itself. |
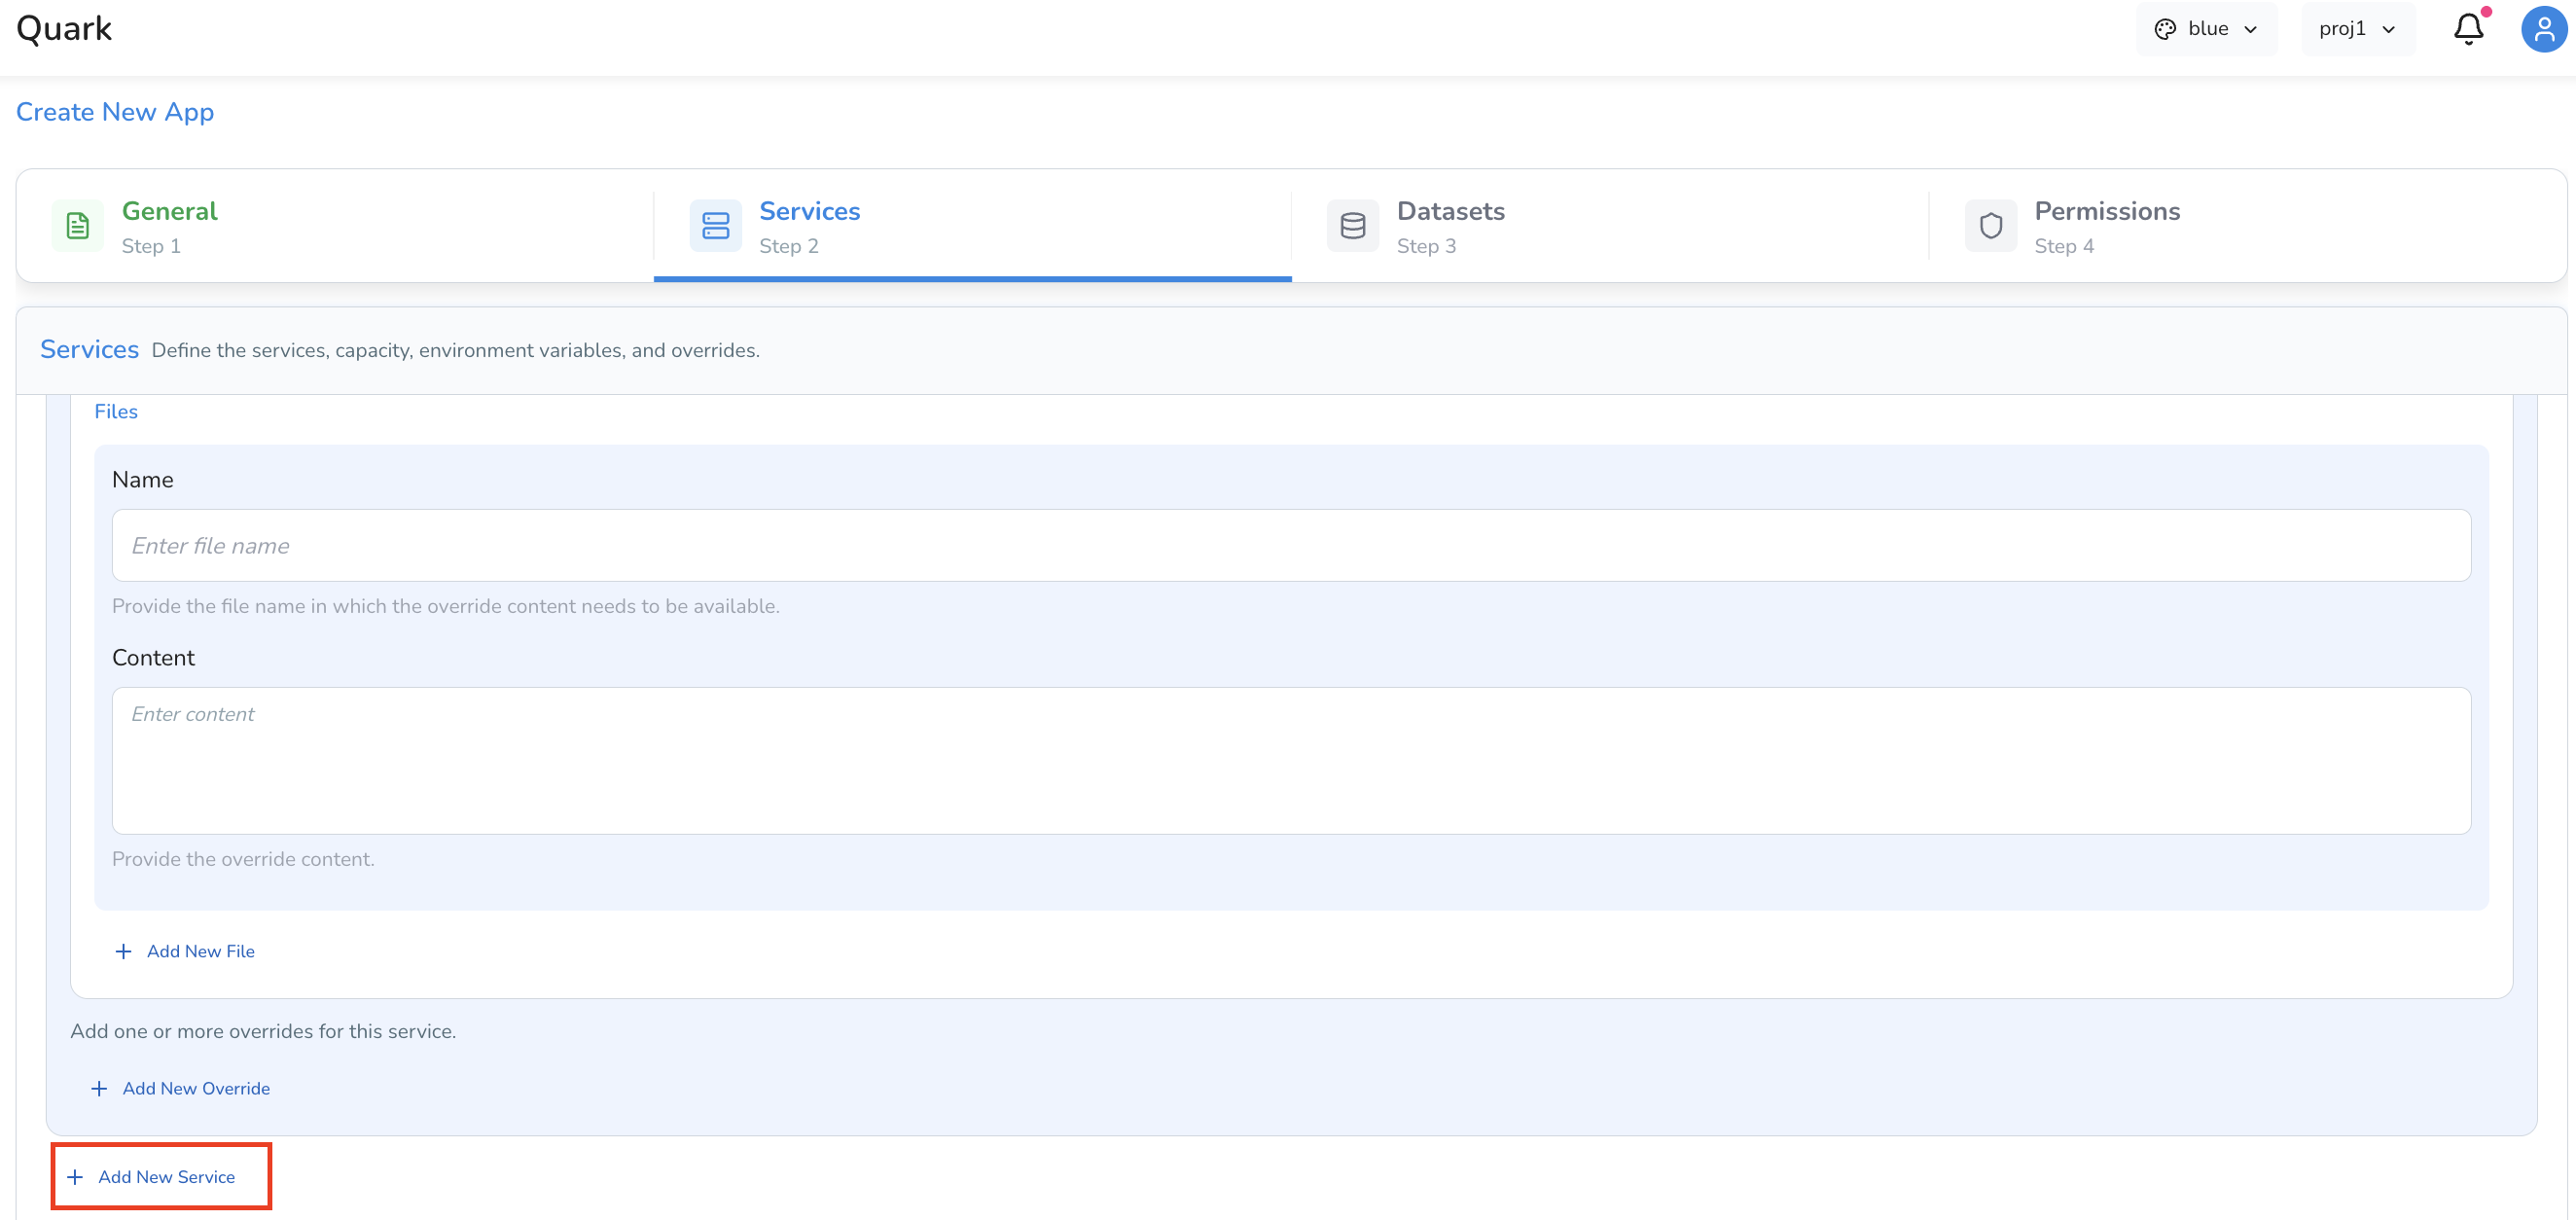
Overrides
Overrides let you mount configuration files directly into the container at a specified path — useful for config files, reference files, or scripts the app needs at runtime that aren't already baked into the container image.
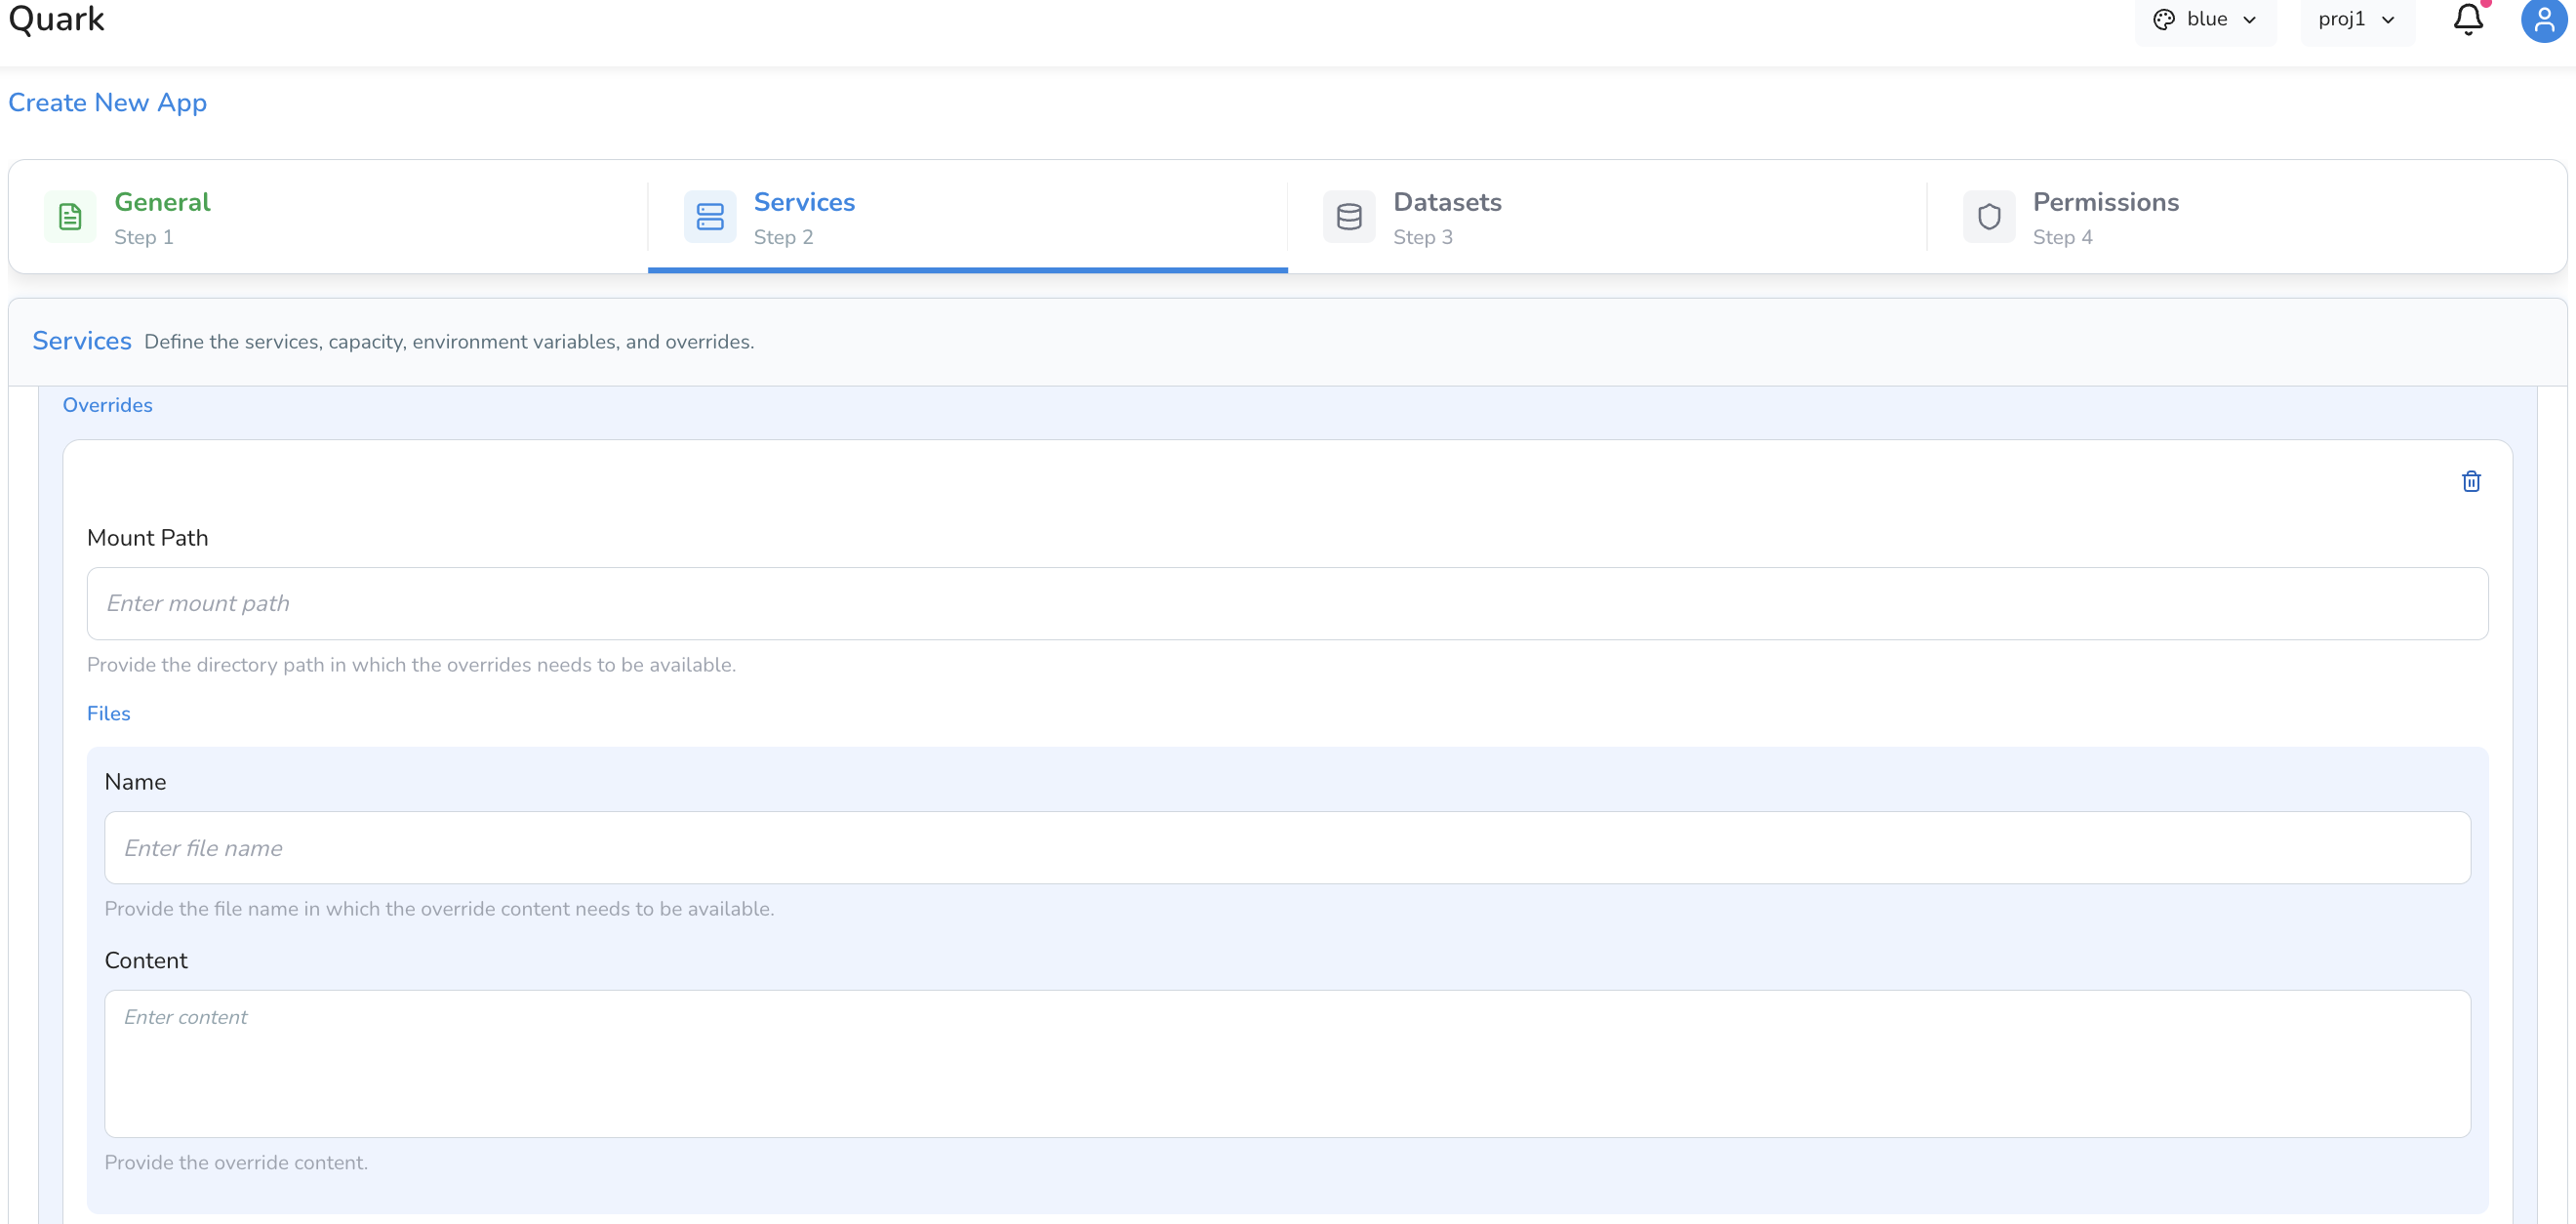
| Field | Description |
|---|---|
| Mount Path | The file path inside the container where the file will be mounted. |
| File Name | The name of the file to be created at the mount path. |
| Content | The content of the file, entered directly in the configuration screen. |
Adding Multiple Services
If your app requires more than one container — for example, a frontend visualisation service paired with a backend data-processing service — click Add New Service to configure each additional service using the same fields described above.
Step 3: Datasets
The Datasets tab connects your app to the data it will visualise. By default, apps do not have access to any data — including your own pipeline results — so this step is required for the app to display anything meaningful.
Important: Apps do not automatically connect to My Files → Results. You must explicitly mount the relevant data using one of the options below.
| Option | Description |
|---|---|
| Mount a dataset | Mount a specific dataset available on the platform directly into the app's container. Use this when your app needs to visualise a registered dataset rather than your own pipeline output. |
| Map a directory | Specify a directory path to mount — most commonly used to point the app at a Results directory from a completed pipeline run. |
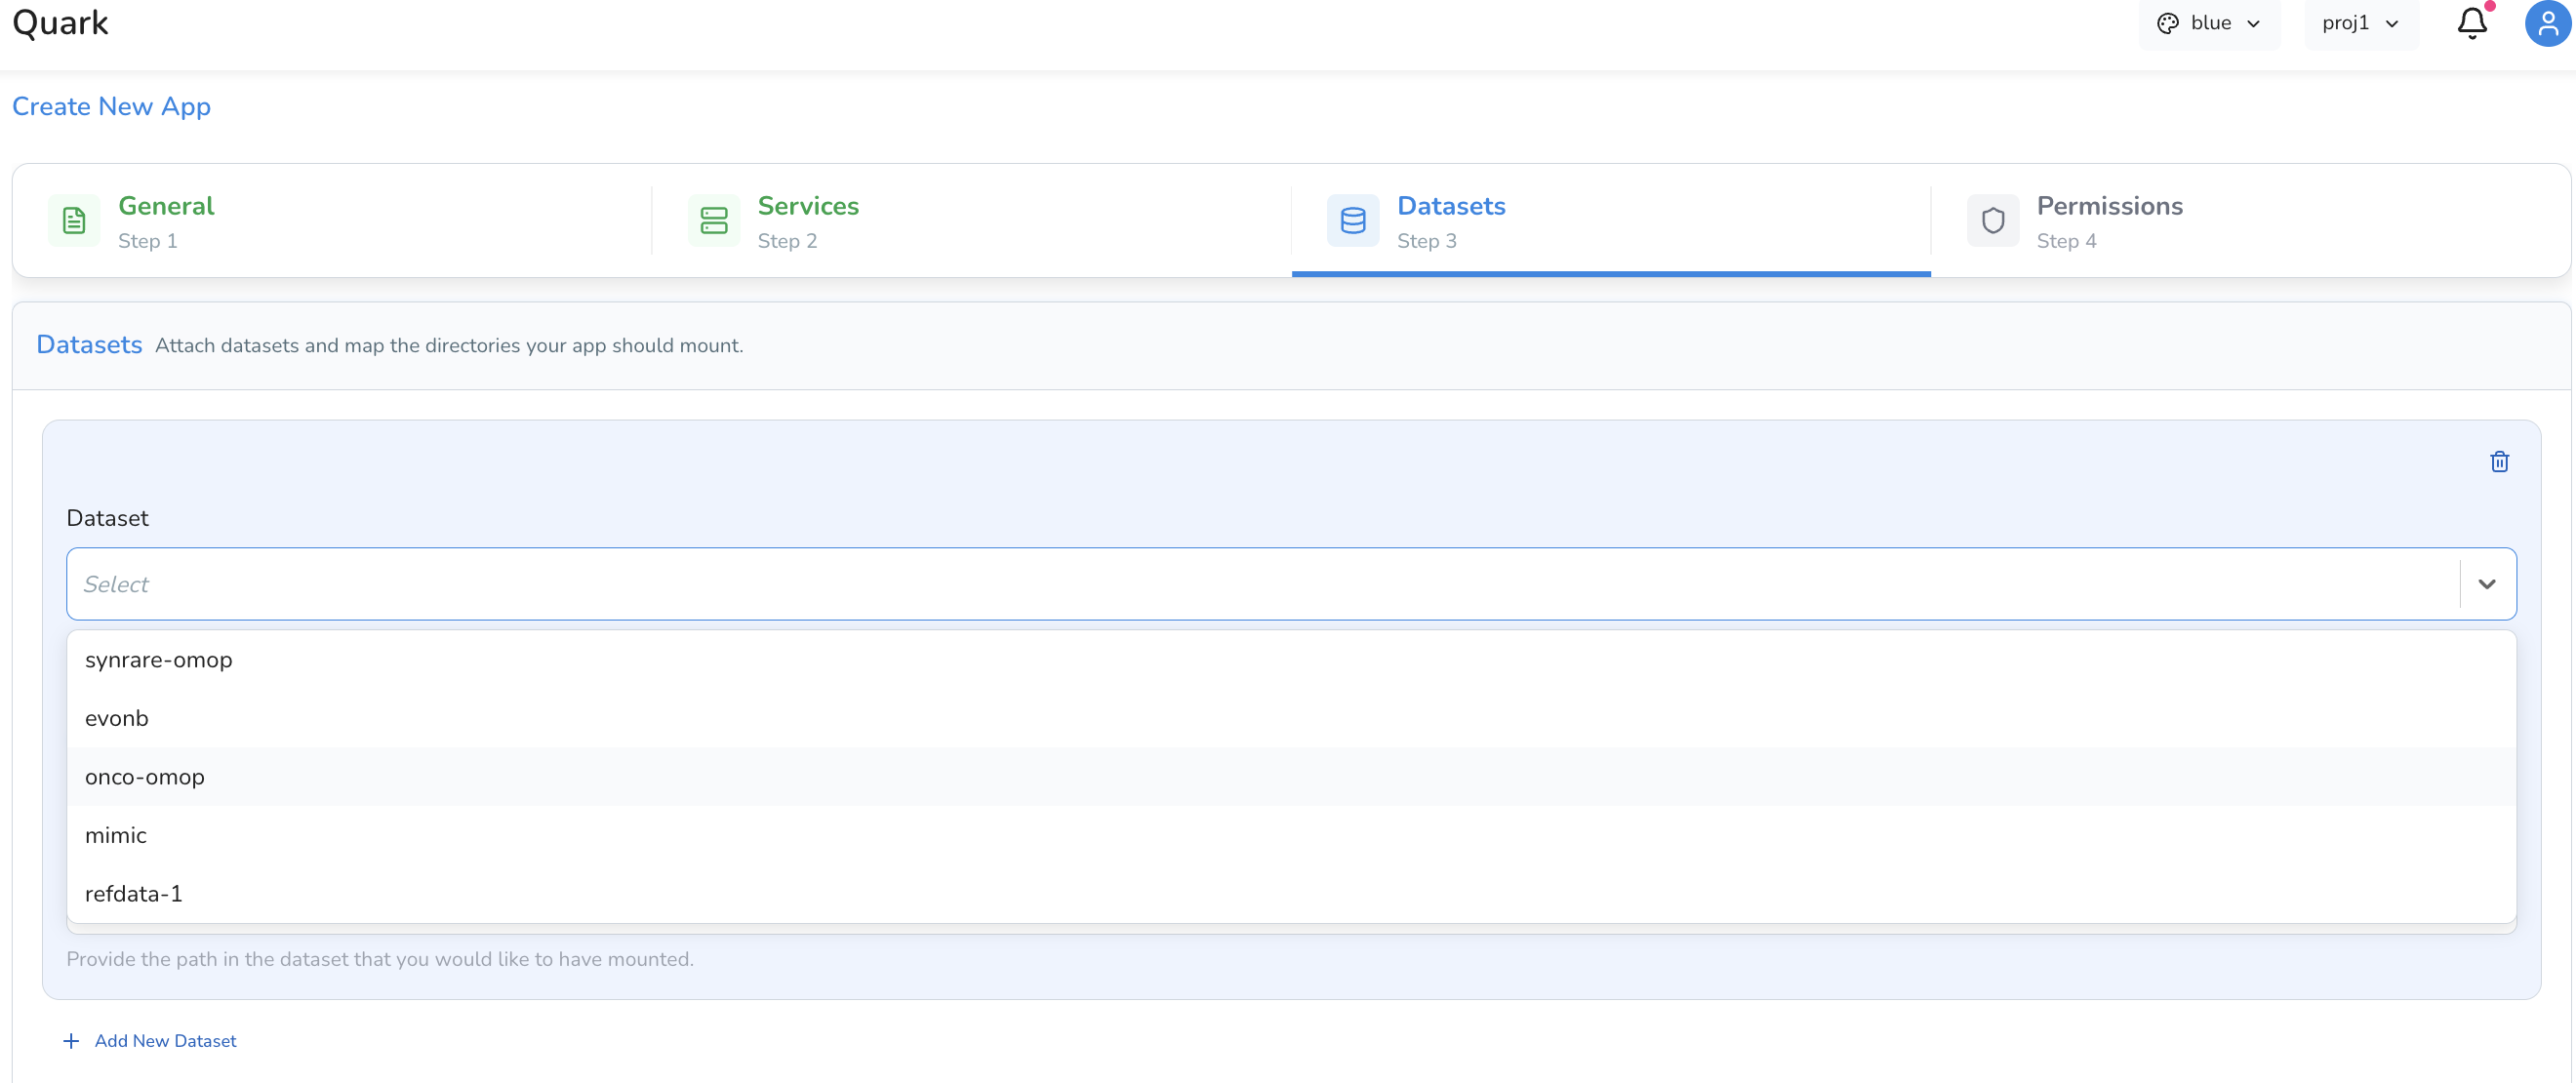
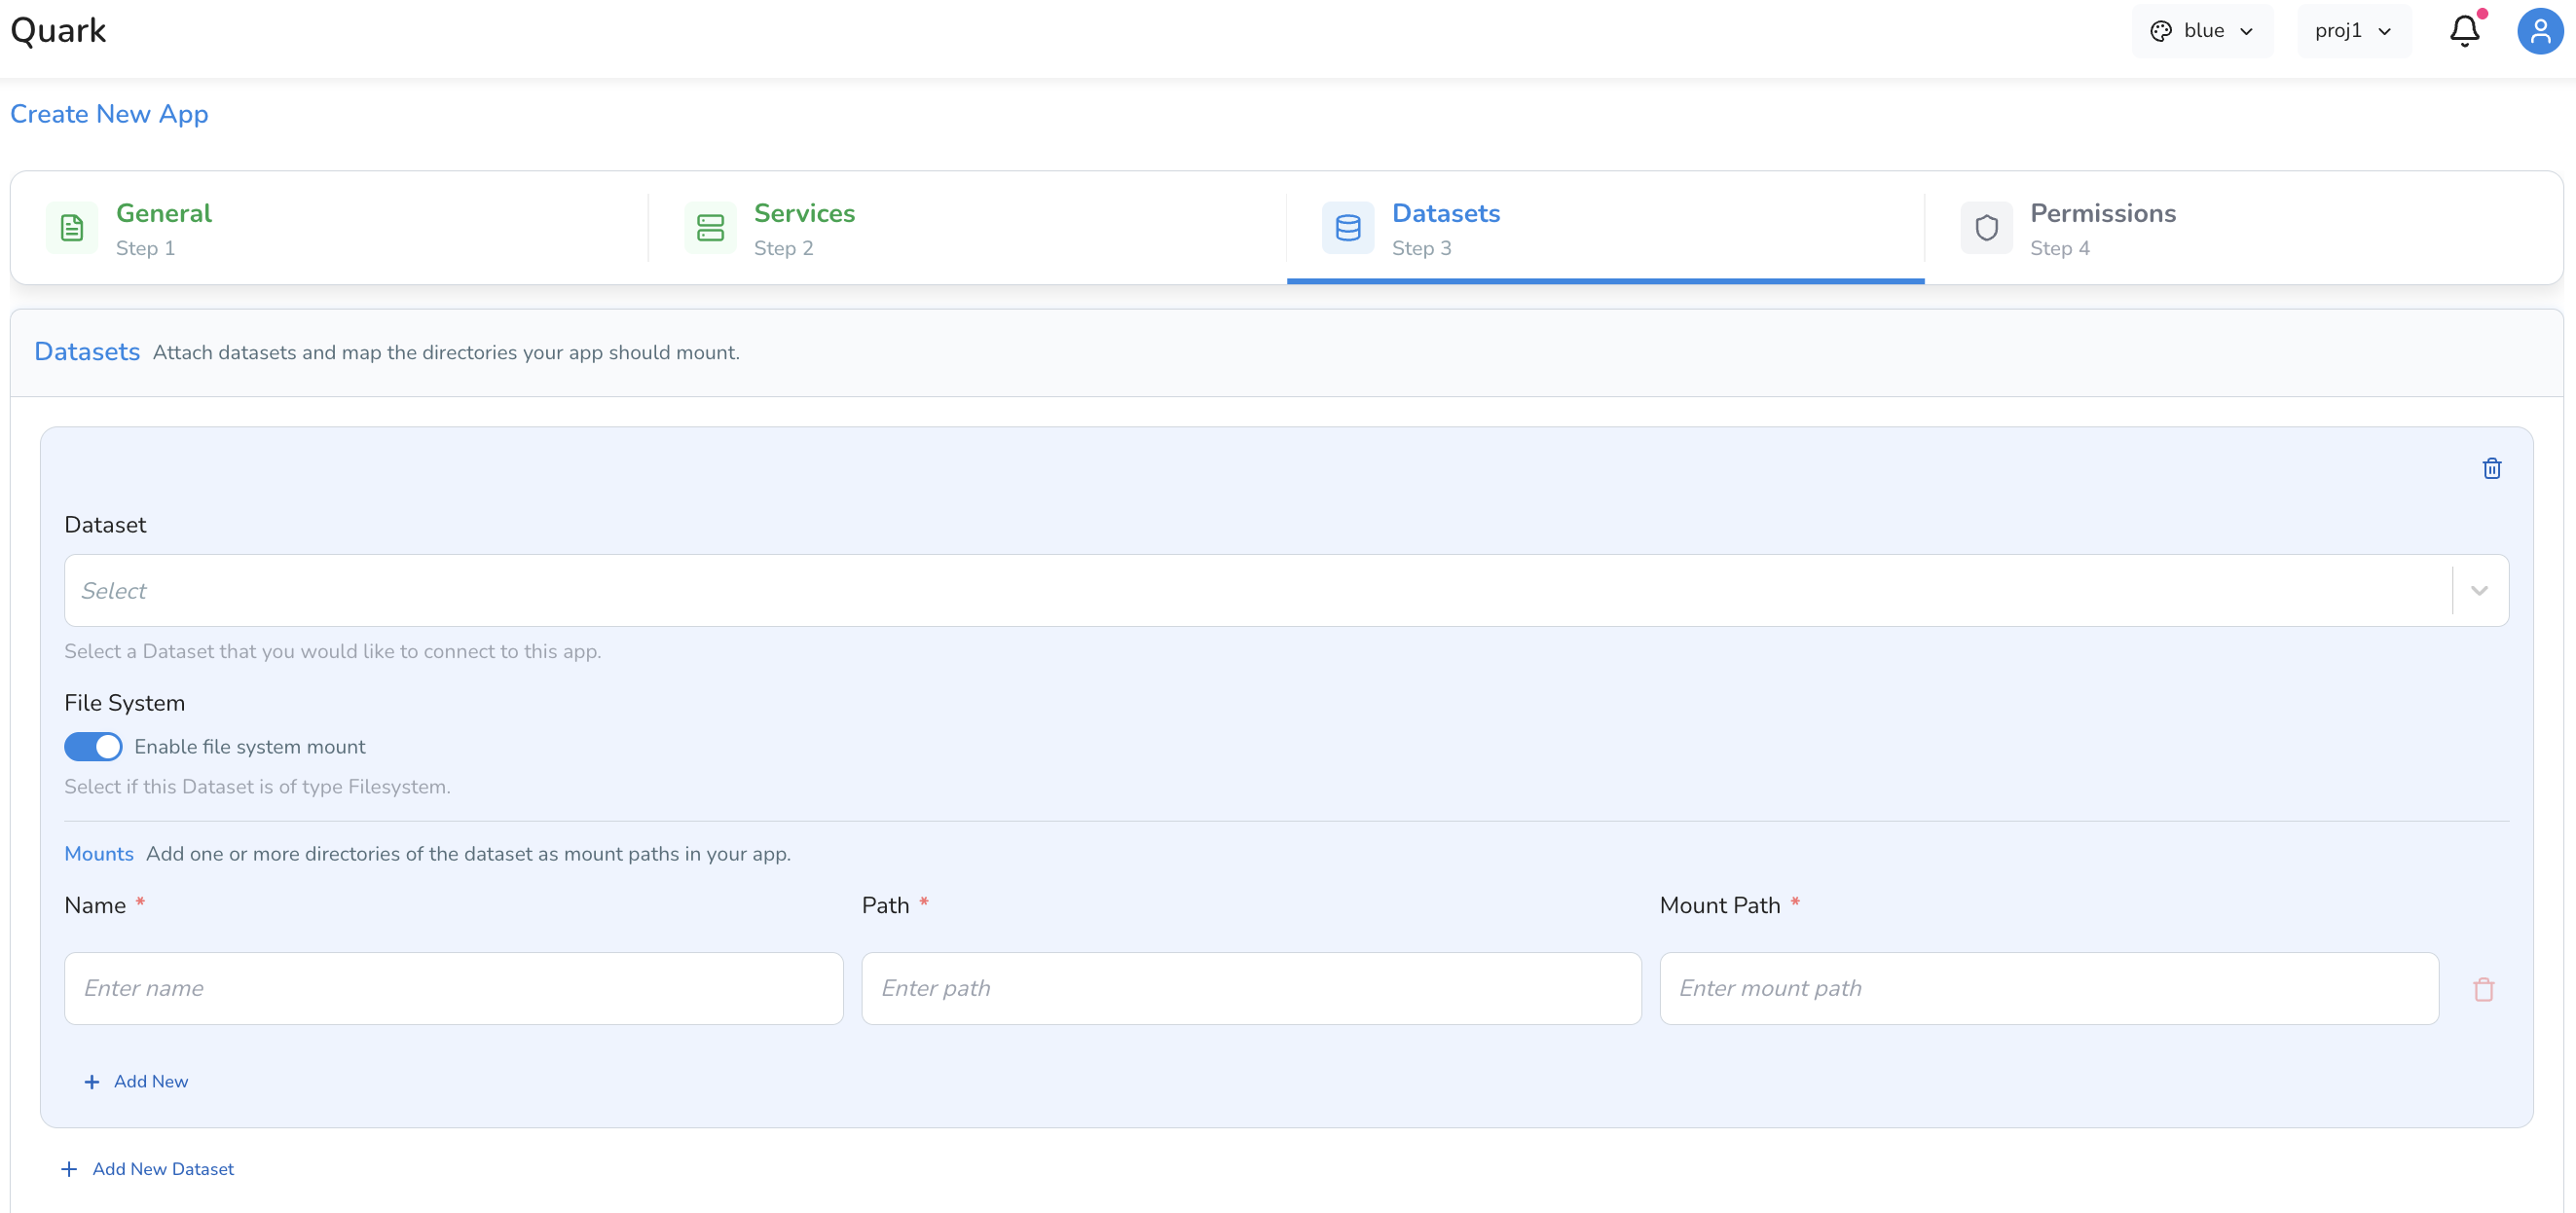
If your app needs access to more than one data source, click Add New Dataset to mount additional datasets or directories.
Tip: To visualise results from a pipeline run, use Map a directory and provide the path to the relevant output directory in My Files → Results.
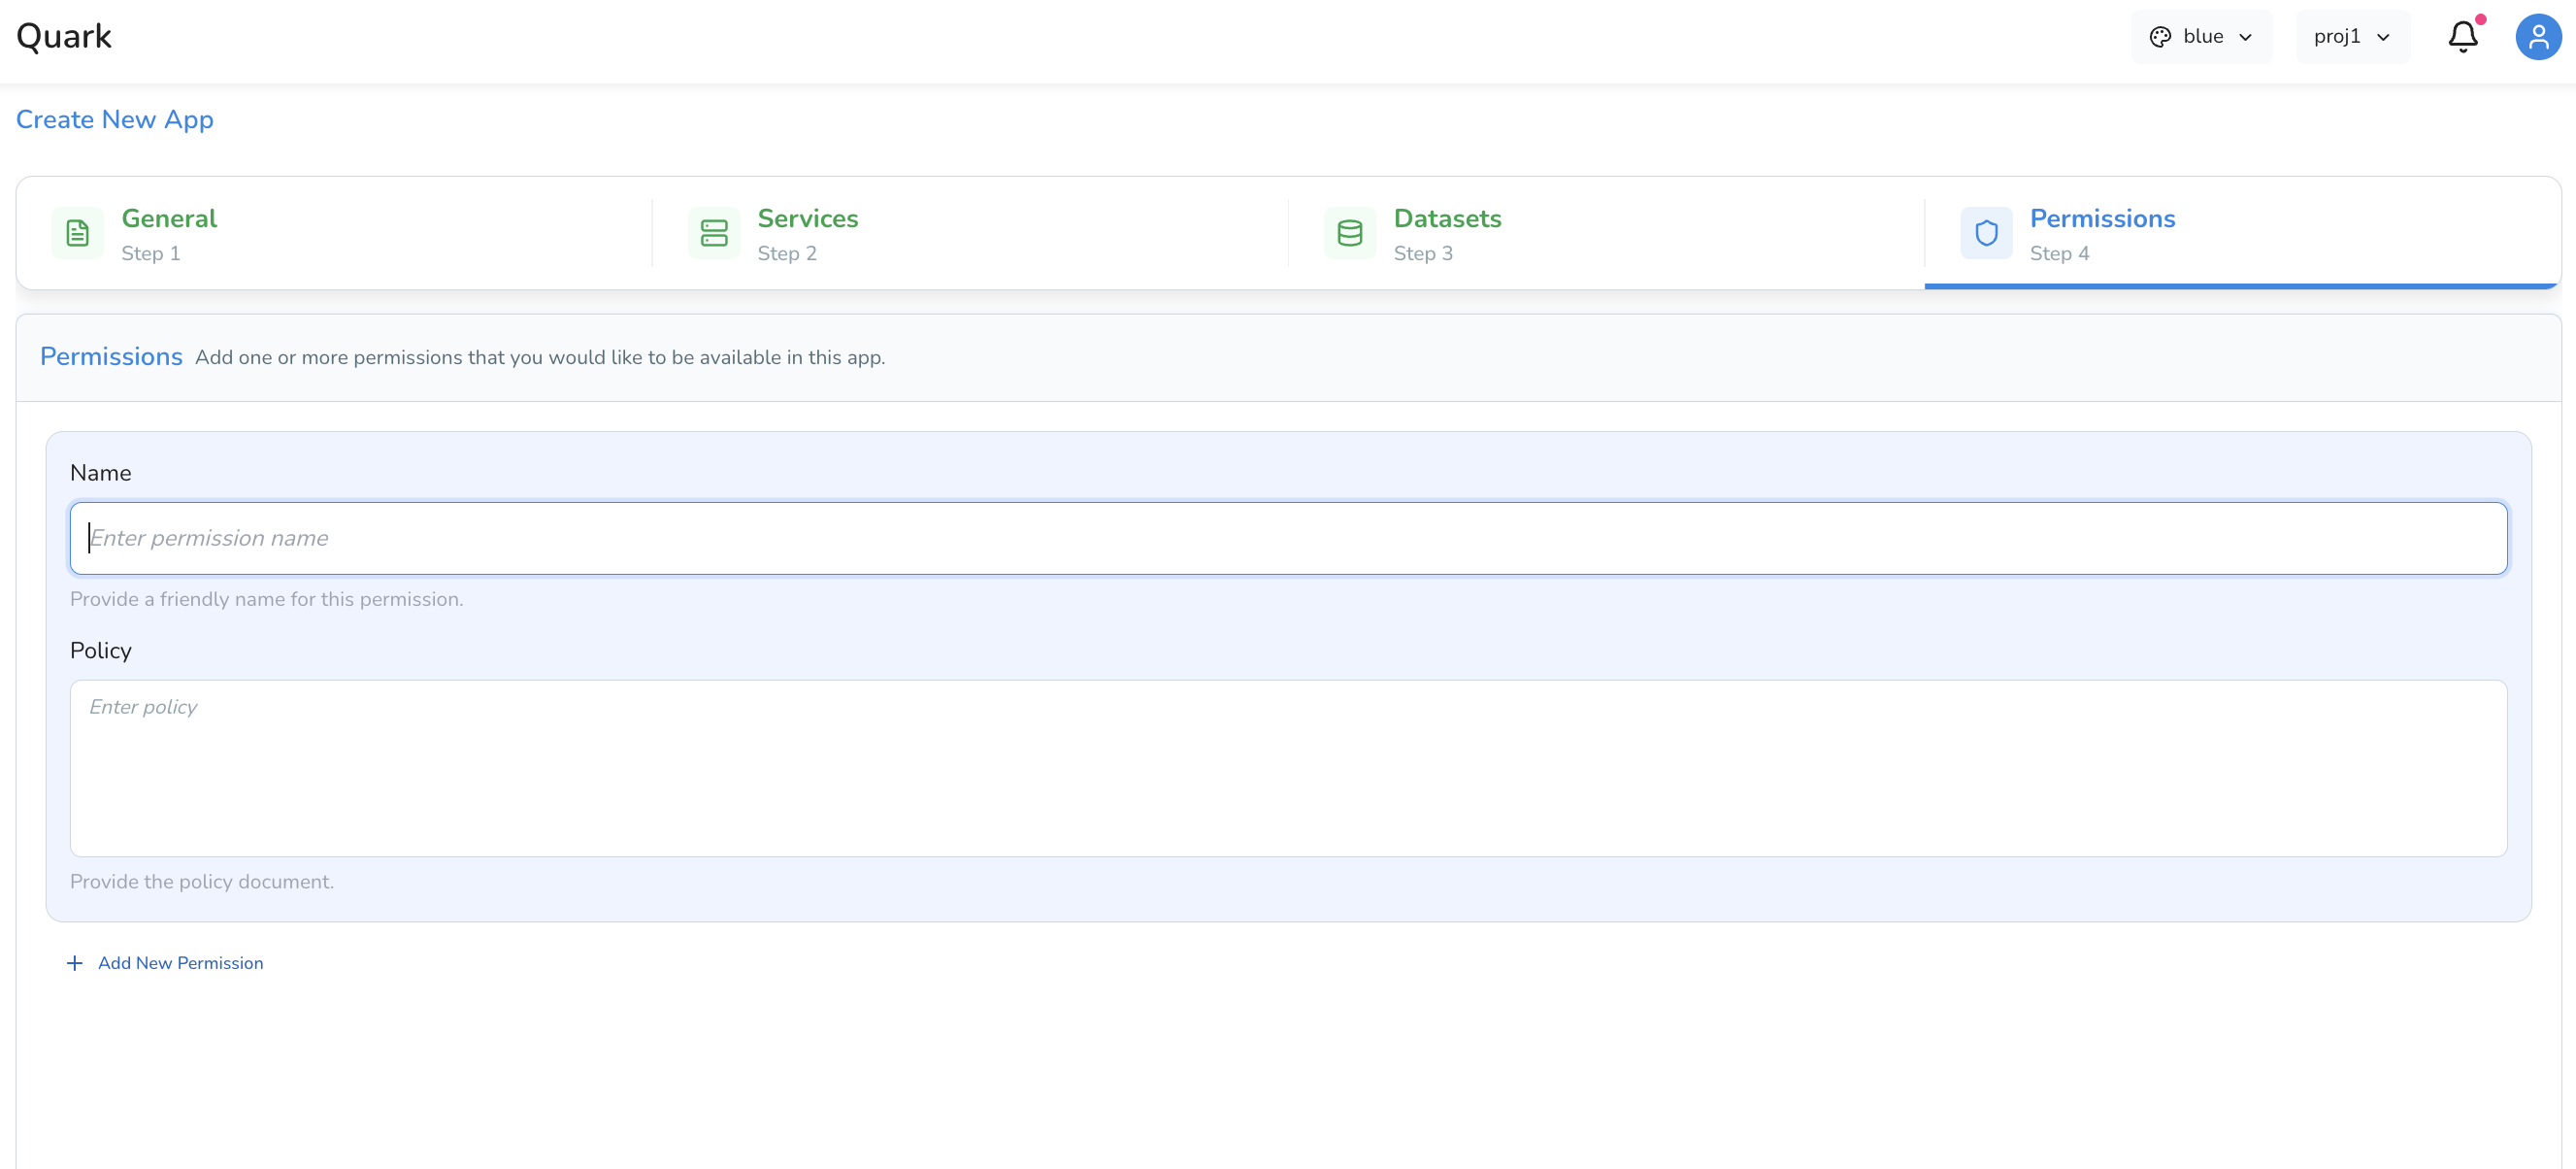
Step 4: Permissions
The Permissions tab determines who, beyond yourself, can access this app once it's running.
- Set access controls to keep the app private to yourself, or share it with other members of your project or organisation.
- Permissions configured here are managed at the app level — they are independent of, and in addition to, project-level access controls. A user with project access does not automatically have access to every app within that project.
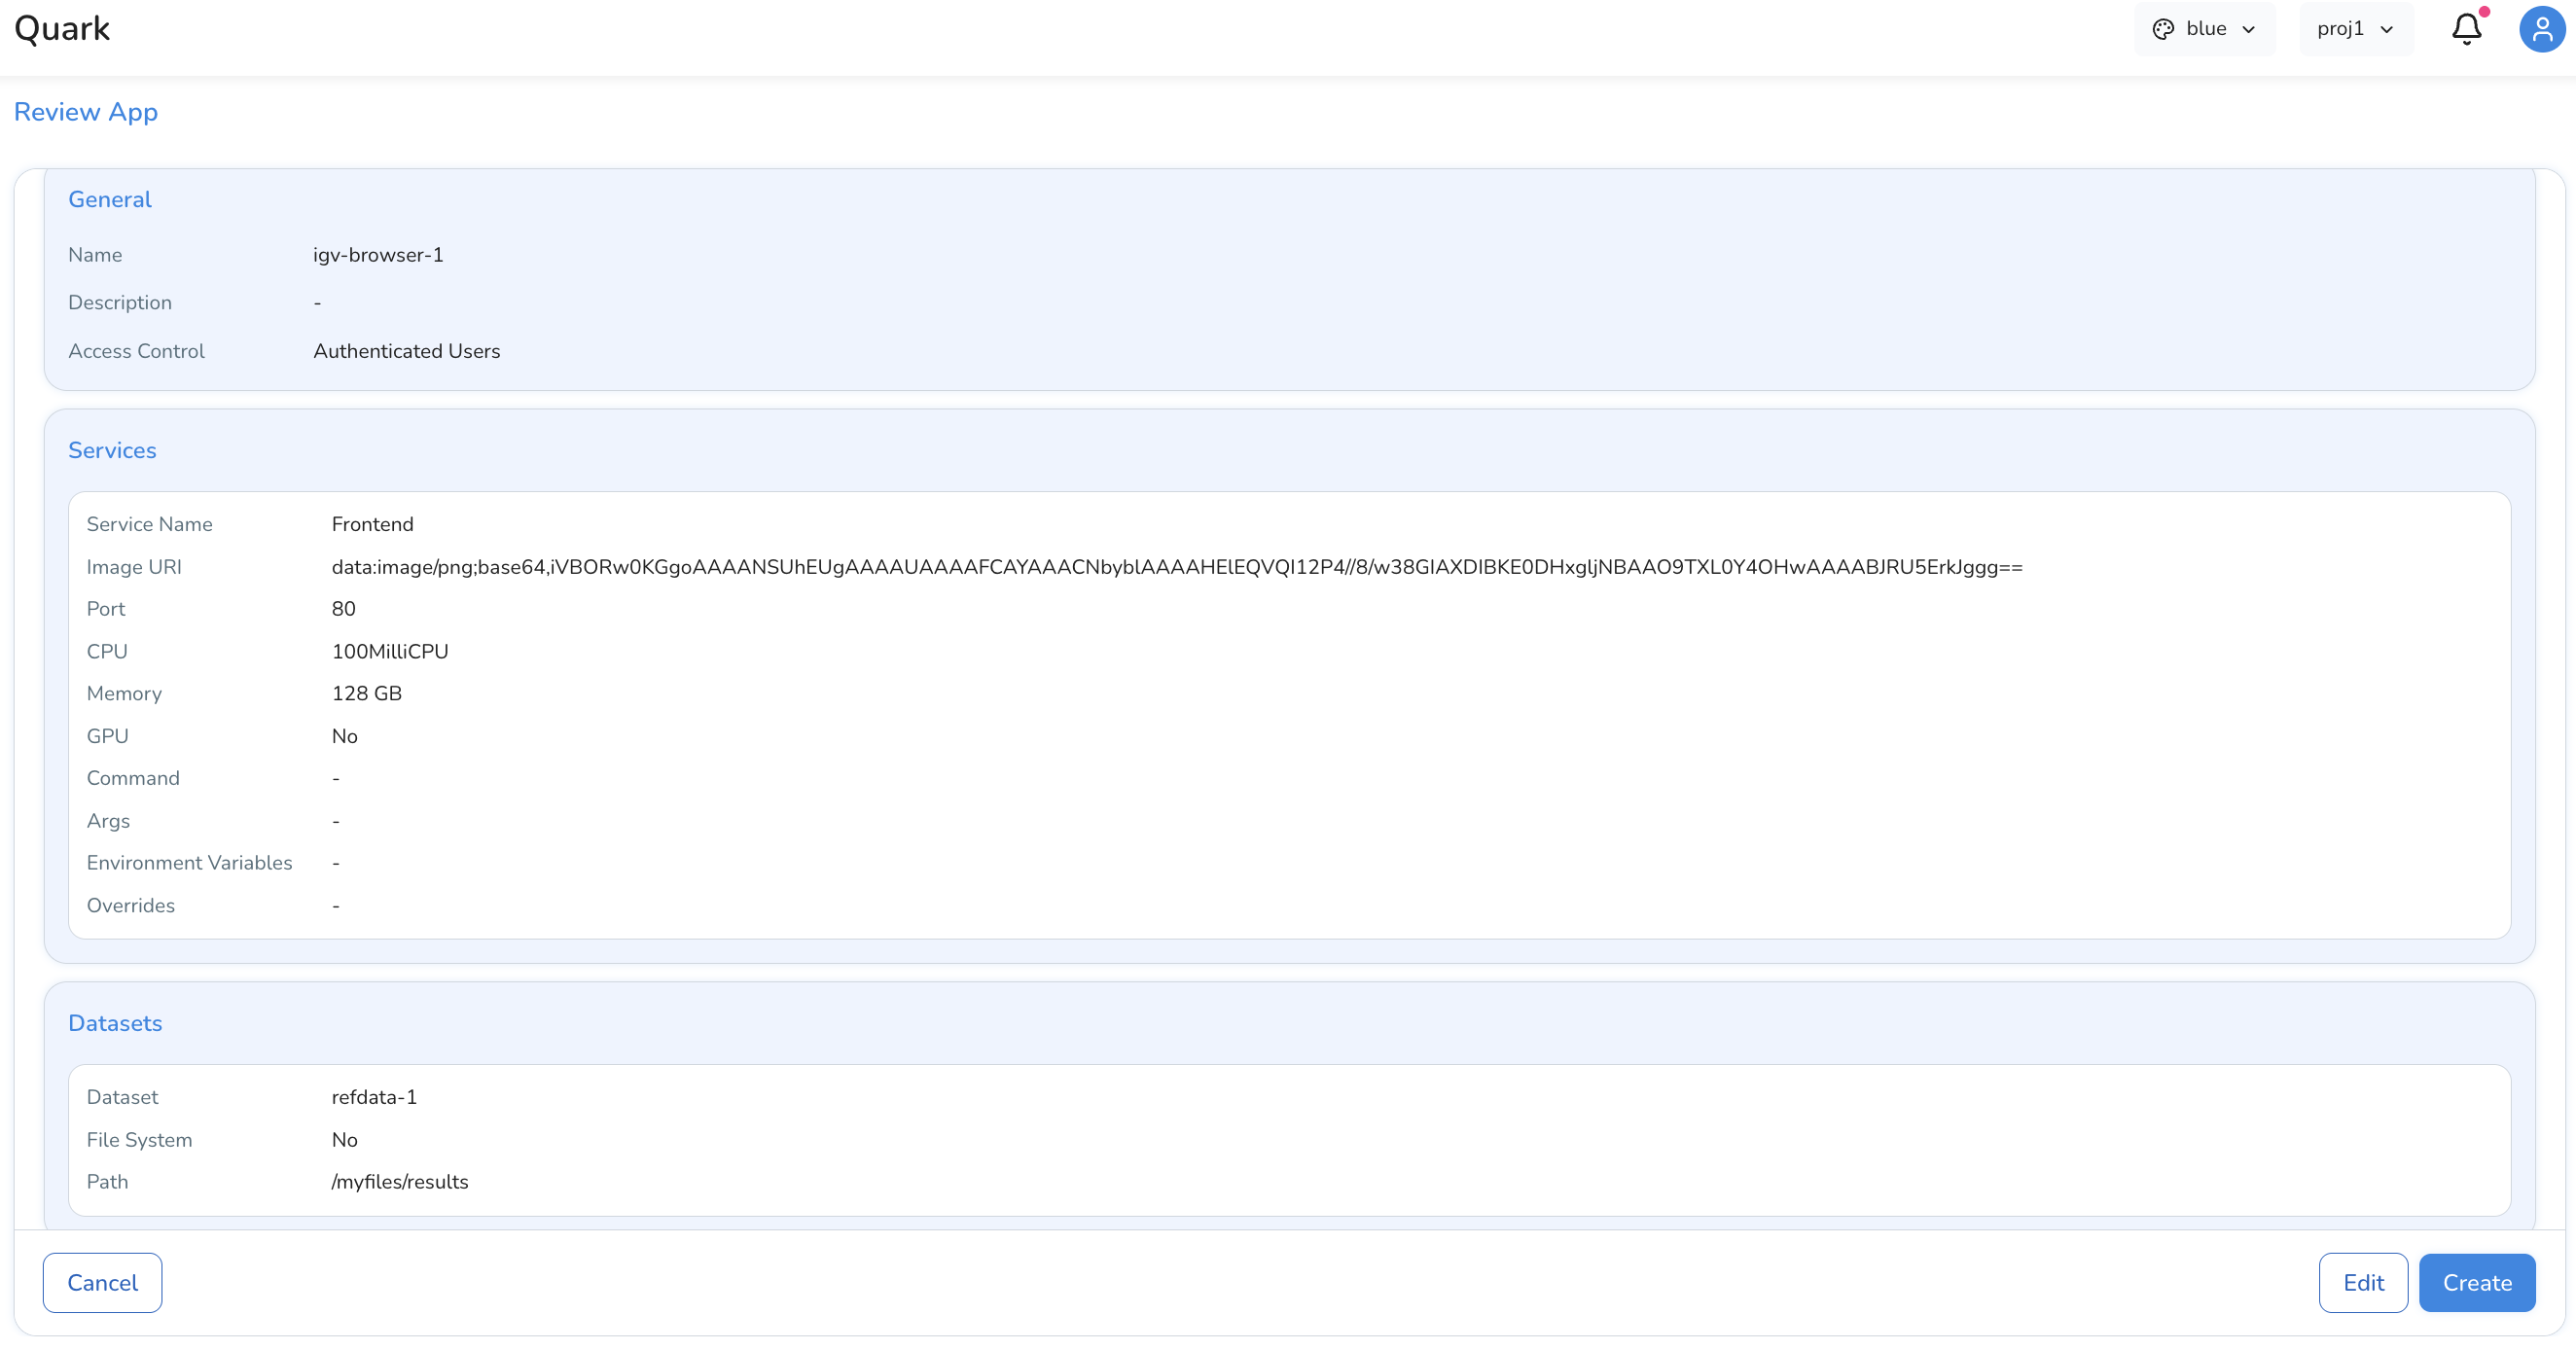
Reviewing and Creating the App
Once all four tabs are complete, click Review to see a consolidated summary of your app's configuration — general details, services, datasets, and permissions all in one place. This is your opportunity to check everything is correct before the app is deployed.
When you're satisfied everything is configured correctly, click Create to finalise and deploy the app. The app will appear in the Apps list, and you can use the Connect action to open it once it has started.
Example: Configuring an IGV App
IGV (Integrative Genomics Viewer) is a widely used tool for visualising alignment files (BAM), variant call files (VCF), and genome annotations. The table below walks through a complete example configuration for an IGV app set up to review the output of a DNA-Seq pipeline run.
| Tab | Field | Example Value |
|---|---|---|
| General | Name | igv-dna-seq-viewer |
| General | Description | IGV app for reviewing DNA-Seq alignment outputs |
| Services | Service Name | Frontend |
| Services | Image URI | (your IGV container image URI) |
| Services | Port | 80 |
| Services | CPU / Memory | 2 CPU, 8 Gi memory |
| Datasets | Dataset | Map directory → path to your DNA-Seq run output in My Files → Results |
| Permissions | Access | Restricted to project members |
With this configuration, any project member can connect to the app to browse the DNA-Seq run's alignment files directly in their browser, without needing to download the data or install IGV locally.
What's Next
- HealthOmics Pipelines — Run pipelines whose outputs you will visualise with Apps.
- Workstations — If users need a persistent interactive environment rather than a visualisation app, direct them to Workstations.