Platform Audit Logs
Overview
The Audit Logs section gives you an immutable, platform-wide record of every API call and UI action taken in the TRE — essential for SOC 2, HIPAA, and internal security reviews. User actions, resource changes, access events, and administrative decisions are all captured.
Navigation: Select Audit Logs from the left-hand navigation pane.
The Audit Log
When you open Audit Logs, the log lists entries in reverse chronological order — the most recent events appear at the top.
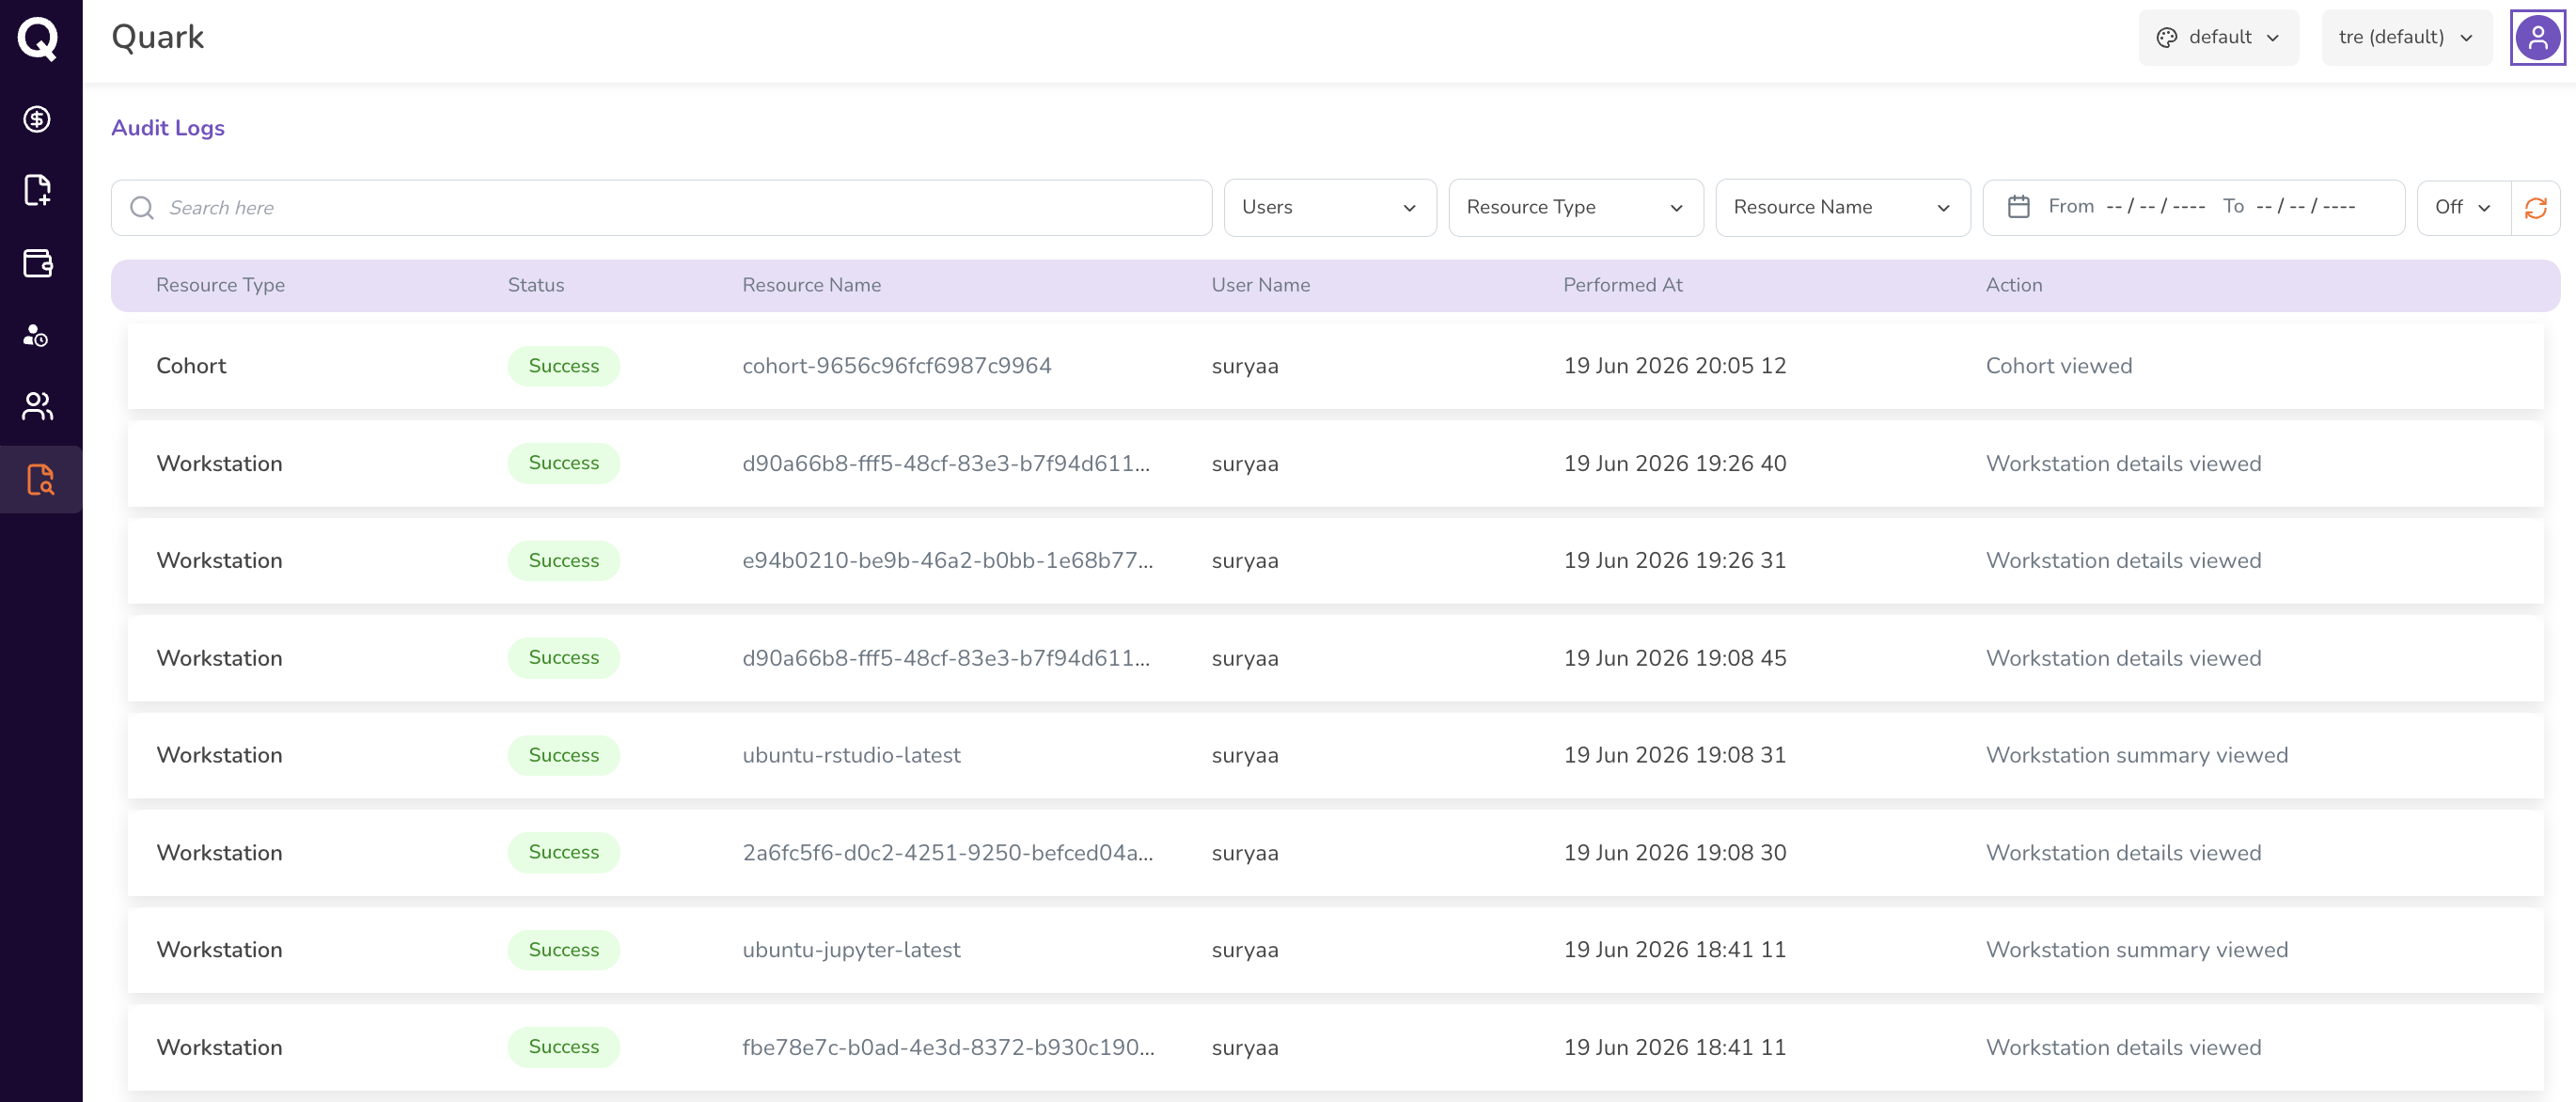
Each row shows:
| Column | Description |
|---|---|
| Resource Type | The category of resource the action was performed on (e.g., Workstation, Cohort, Project, User). |
| Status | Whether the action succeeded or failed, shown as a colour-coded badge. |
| Resource Name | The specific resource the action was performed on. |
| User Name | The user who performed the action. |
| Performed At | The exact date and time the action occurred. |
| Action | A description of what was done (e.g., Workstation creation requested, Cohort creation requested, Workstation metrics accessed). |
Use the filter controls in the toolbar to narrow by User, Resource Type, Resource Name, or Date Range, or use the search bar.
Reviewing a Log Entry
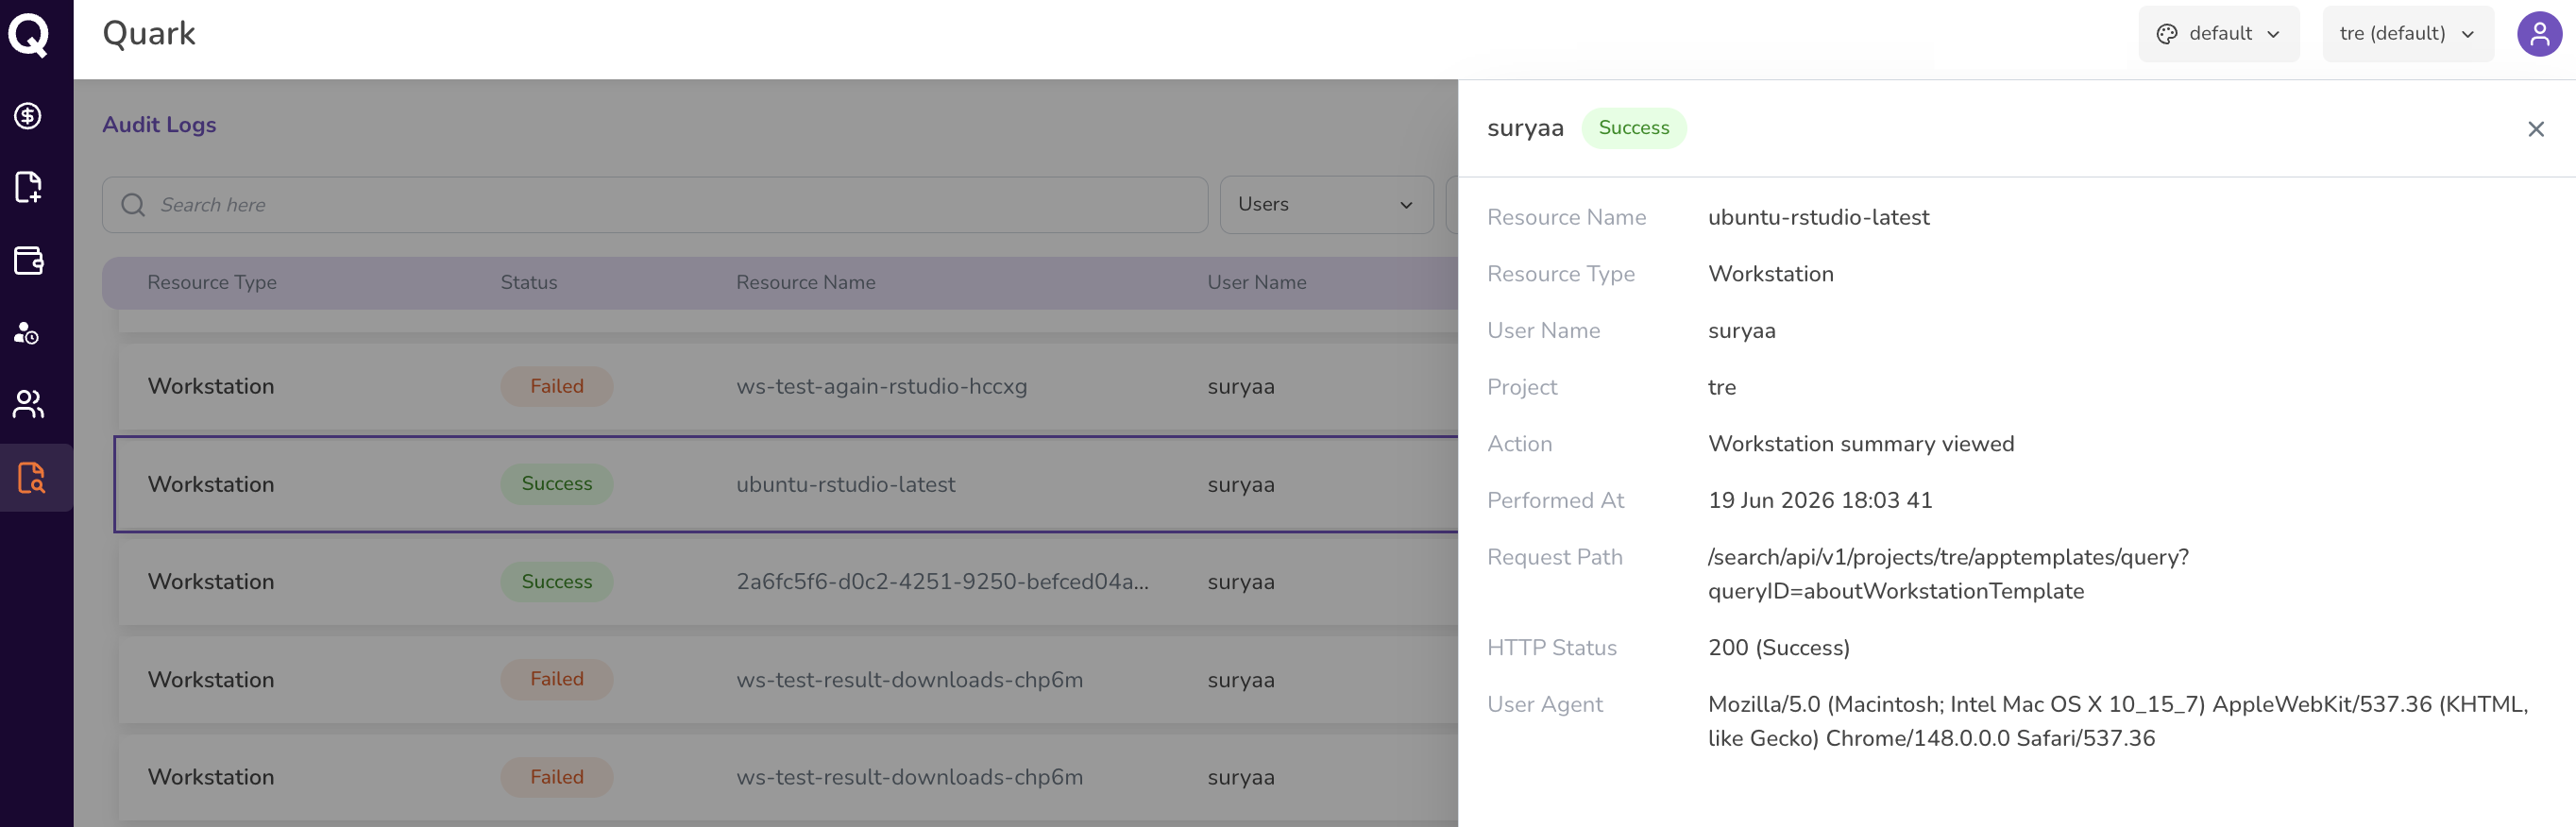
Click any row to open its full detail view as a side panel:
| Field | Description |
|---|---|
| Resource Name | The specific resource the action was performed on. |
| Resource Type | The category of the resource (e.g., Workstation, Cohort). |
| User Name | The user who performed the action. |
| Project | The project context in which the action occurred. |
| Action | The action that was taken. |
| Performed At | The exact date and time of the action. |
| Request Path | The API endpoint that handled the action — useful for technical investigation. |
| HTTP Status | The response code — distinguishes successful actions (e.g., 200) from failed attempts (e.g., 403 Forbidden, 500 Internal Server Error). |
| User Agent | The client from which the action originated — browser type, OS, and version. |
Tip: A 4xx status indicates a failed or unauthorised attempt; a 5xx status points to a platform-side error.
Common Audit Tasks
Correlating with a Cost Anomaly
- Identify the date range of the anomaly in Platform Cost.
- Apply the same date range in the Audit Logs date picker.
- Filter by Resource Type to match the resource category driving the cost spike (e.g., Workstation or Pipeline).
- Review the actions in that window to identify the user and resource responsible.
Preparing a Compliance Report
- Apply a Date Range matching your reporting period.
- Export using the download icon (top-right of the screen) if available, or review entries directly for the period in question.
- Use the Resource Type filters to produce focused views for specific resource categories as needed.
Important Notes
- Audit log entries are immutable — they cannot be edited or deleted by any role, including platformadmin.
- The log captures both successful and failed actions. Failed actions (4xx and 5xx HTTP status codes) may warrant investigation, particularly if they represent repeated unauthorised access attempts.
What's Next
- User Activity — for a higher-level view of user engagement trends, use User Activity alongside the granular Audit Log.
- Platform Cost — correlate audit events with cost anomalies to trace unexpected spend to specific users or actions.
- Users — if audit findings reveal suspicious or unauthorised activity, review and act on the relevant user account.