Project Audit Logs
Overview
The Audit Logs section provides a chronological, immutable record of all actions and events within your project. Every user action, resource change, access event, and administrative decision is captured as a log entry that cannot be edited or deleted.
This view is scoped to your assigned projects.
Navigation: Select Audit Logs from the left-hand navigation pane.
The Audit Log Dashboard
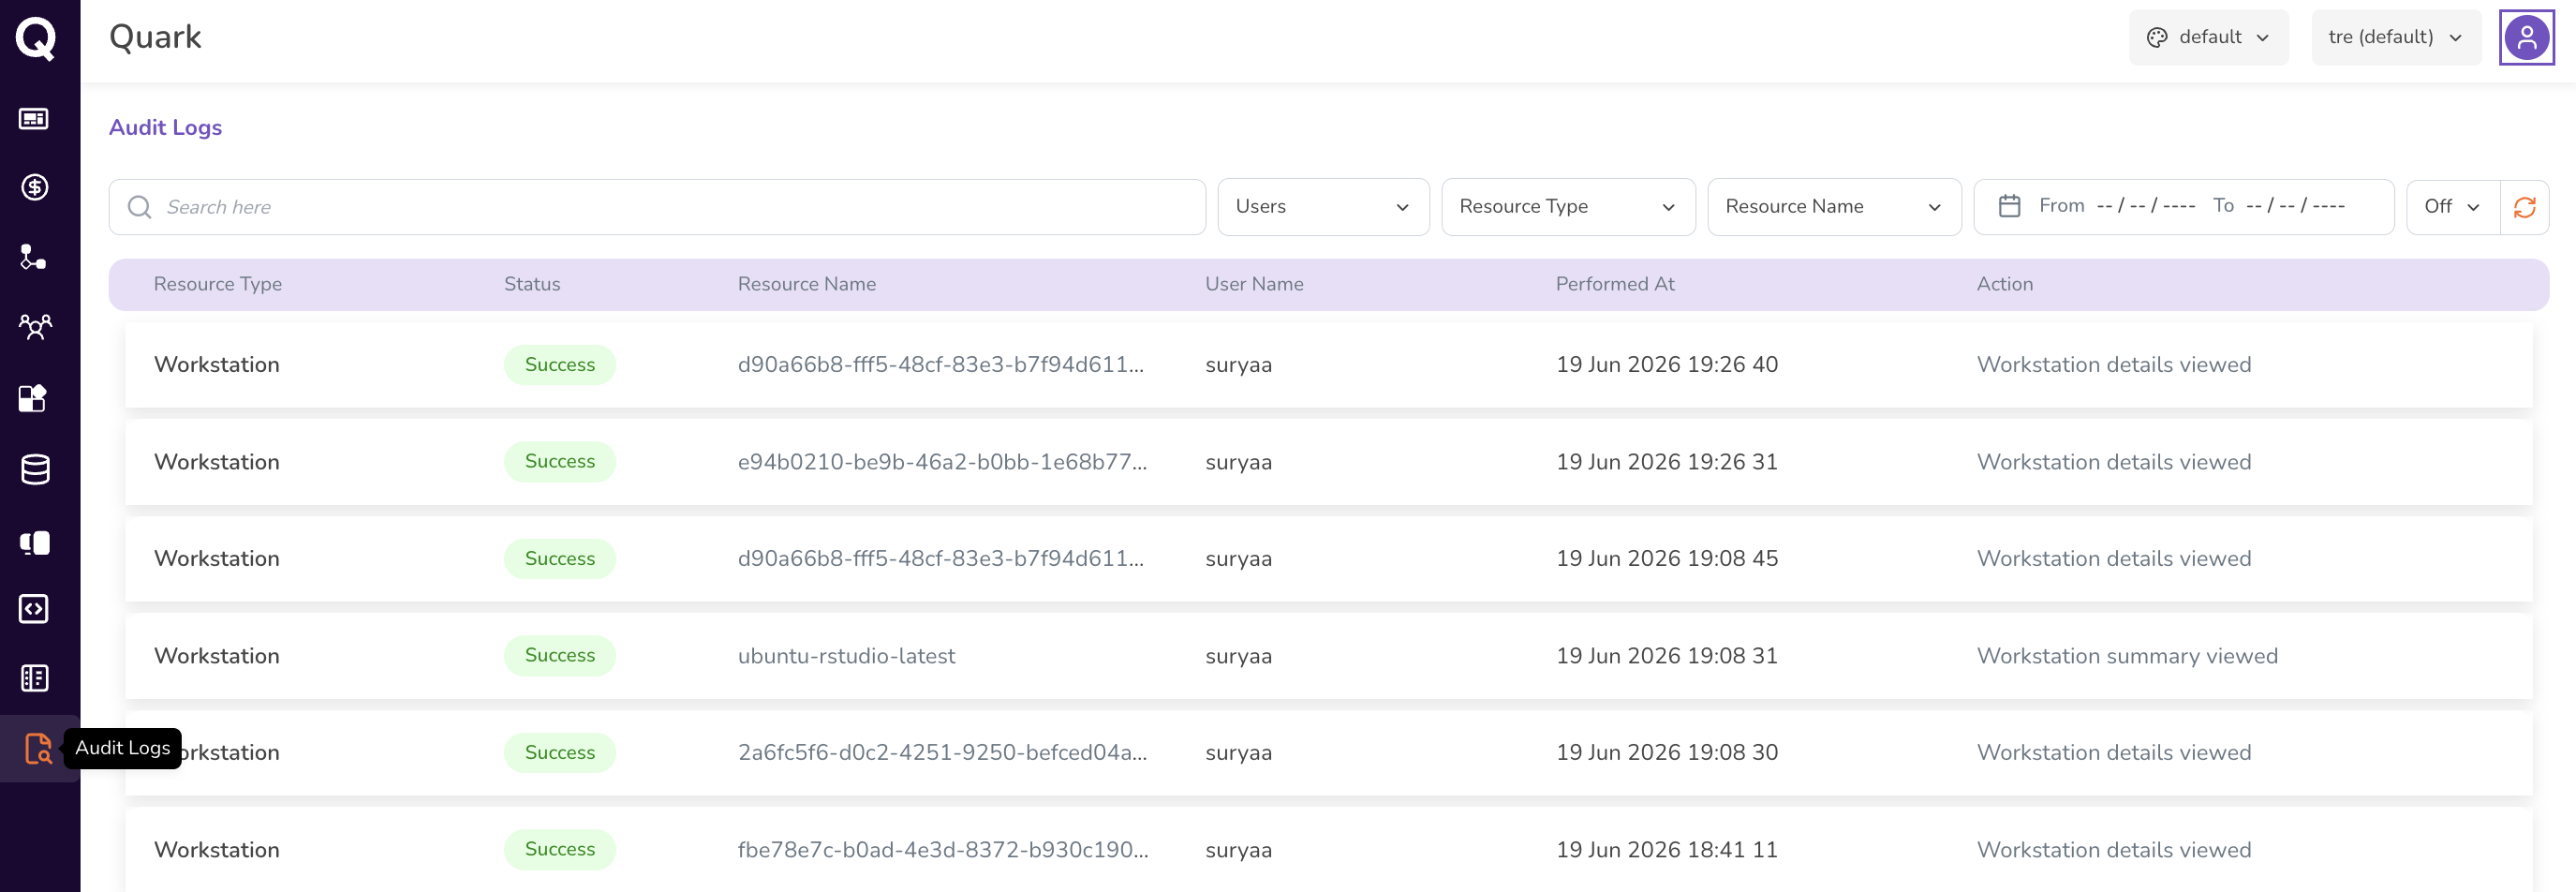
When you open Audit Logs, the dashboard lists log entries in reverse chronological order — the most recent events appear at the top.
Filtering the Audit Log
The log can contain a high volume of entries. Use the filter controls to narrow the view to the events most relevant to your current investigation or review task.
- Filter by User — scope the log to all actions performed by a specific user, useful for reviewing an individual's activity as part of an access review or incident investigation.
- Filter by Resource Name — look up all events affecting a specific named resource, for example a particular workstation, dataset, or job run.
-
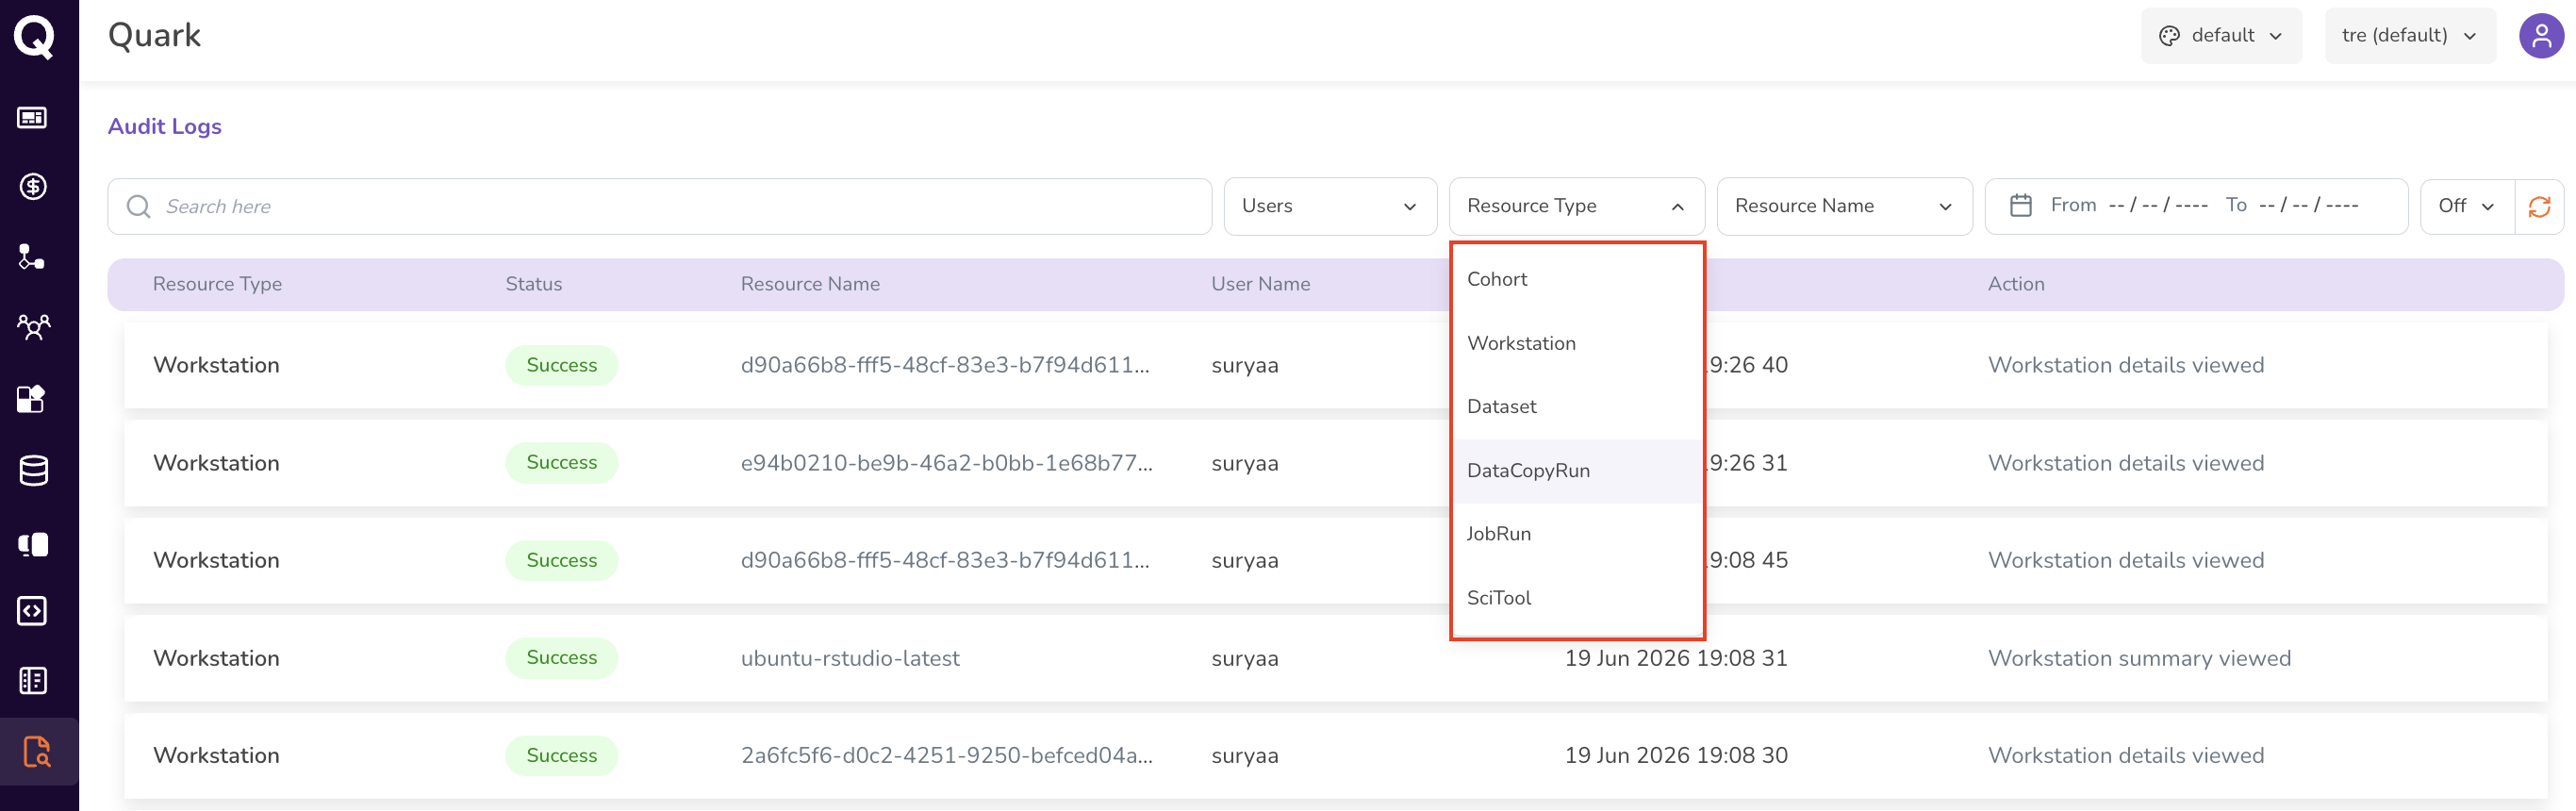
Filter by Resource Type — filter to a category of resource.
-
Filter by Date Range — focus on a specific time window, useful for investigating an incident, preparing a compliance report, or correlating events with cost anomalies.
Reviewing Individual Log Entries
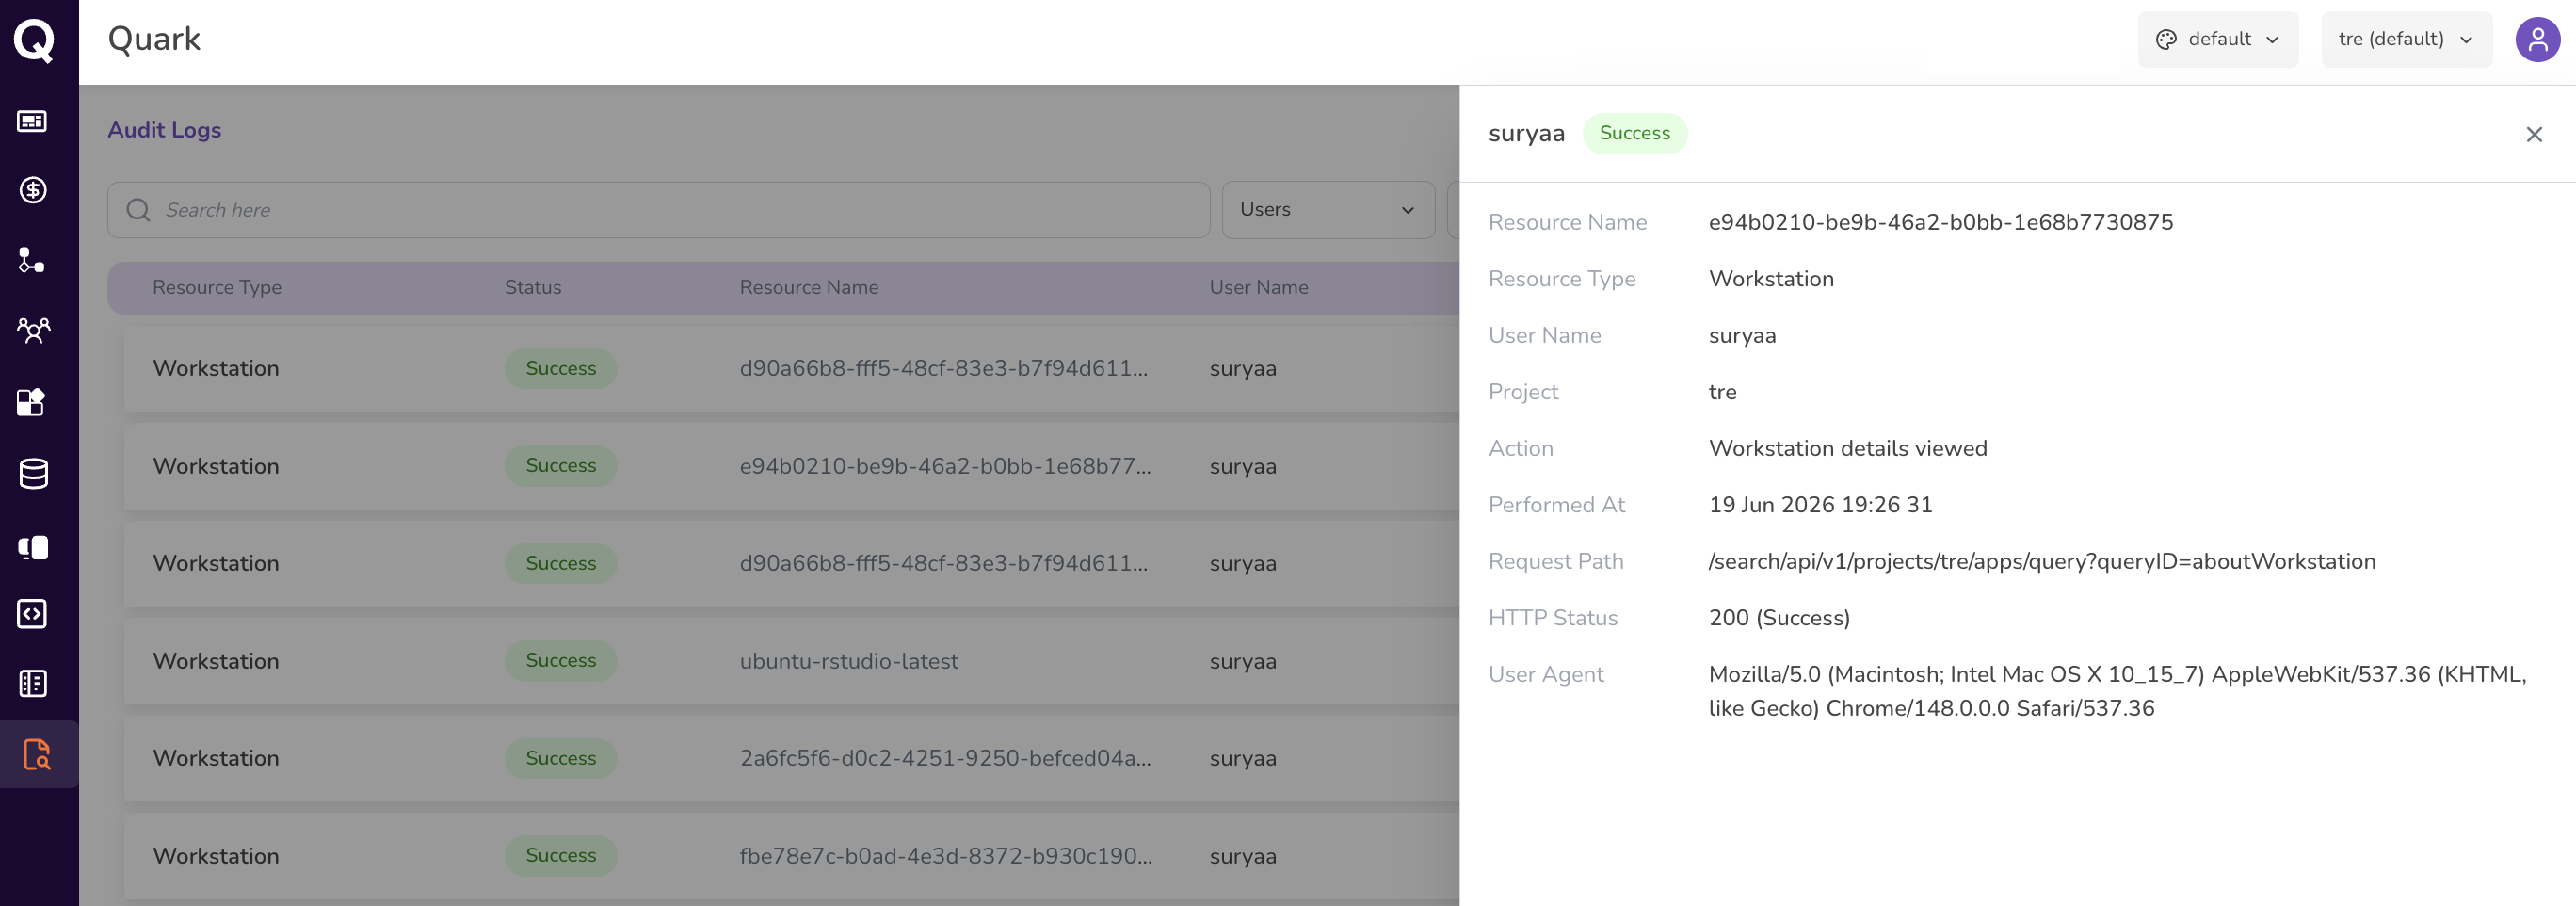
Click any row in the audit log to open its full detail view. Each entry contains:
| Field | Description |
|---|---|
| Resource Name | The specific resource the action was performed on. |
| Resource Type | The category of resource (workstation, dataset, project, user, settings). |
| Username | The user who performed the action. |
| Associated Project | The project context in which the action occurred, if applicable. |
| Performed Action | The action taken (e.g., create, update, delete, access, login, approve, reject). |
| Timestamp | The exact date and time the action occurred. |
| Request Path | The API endpoint that handled the action — useful for technical investigation. |
| HTTP Status | The response status code — distinguishes successful actions (e.g., 200) from failed attempts (e.g., 403 Forbidden, 500 Internal Server Error). |
| User Agent | The client from which the action originated — browser, CLI, or SDK. |
Common Audit Tasks
Investigating a Sensitive Data Access Event
- Filter by Resource Type = Dataset (or Workstation, if accessed via a workstation session).
- Optionally filter by the specific Resource Name of the dataset in question.
- Open entries to review which users accessed the dataset, and when.
Auditing Workstation Sessions
- Filter by Resource Type = Workstation.
- Optionally filter by user to scope the results.
- Open each workstation entry to confirm which templates were used and which datasets were accessed during the session.
Correlating with Cost Anomalies
If Project Cost shows an unexpected spike in a particular period:
- Filter the audit log by the same Date Range as the cost anomaly.
- Filter by Resource Type = Workstation or Pipelines, depending on where the cost spike originates.
- Review the actions in that window to identify the user and resource responsible.
Important Notes
- Audit log entries are immutable — they cannot be edited or deleted by any role.
- The log captures both successful and failed actions. Use the HTTP Status field to distinguish between them: 4xx and 5xx status codes indicate failed attempts that may warrant investigation.
- All approval and rejection actions taken in Reviewing & Approving Requests are captured here, providing a complete administrative decision trail.
What's Next
- Reviewing & Approving Requests — if audit findings reveal unauthorised or unexpected access attempts, review the related requests history.
- Project Cost — correlate audit events with cost spikes to trace resource consumption to specific users or actions.
- Monitoring Workstations — if audit entries reveal workstations left running or accessed outside expected hours, review and terminate them.