Datasets
Overview
The Datasets section gives the Infrastructure Administrator a view of all datasets that have been made available on the platform, organised by project. From here you can browse the catalog, inspect the aggregate statistics that researchers see when evaluating a dataset, and drill into the underlying record-level data — the same detailed view that researchers gain access to after receiving approval.
Navigation: Select Datasets from the left-hand navigation pane. The Datasets section opens directly to the Catalog tab.
The Datasets Catalog
The Catalog lists every dataset that has been published to the platform as cards, each showing the dataset name, a short description, its data type tag (e.g., Genomics Data, Clinical Data), and the date it was last updated.
Use the search bar at the top of the Catalog to filter datasets by name or description.
Use the project selector dropdown in the top-right corner to filter the catalog to datasets made available under a specific project — confirming exactly which datasets are visible to researchers in each project.

Dataset Summary Dashboard
Click any dataset card to open its Dataset Summary Dashboard. This dashboard presents the aggregate statistics and visualisations of the dataset's population — the same view researchers see when evaluating a dataset before submitting an access request.
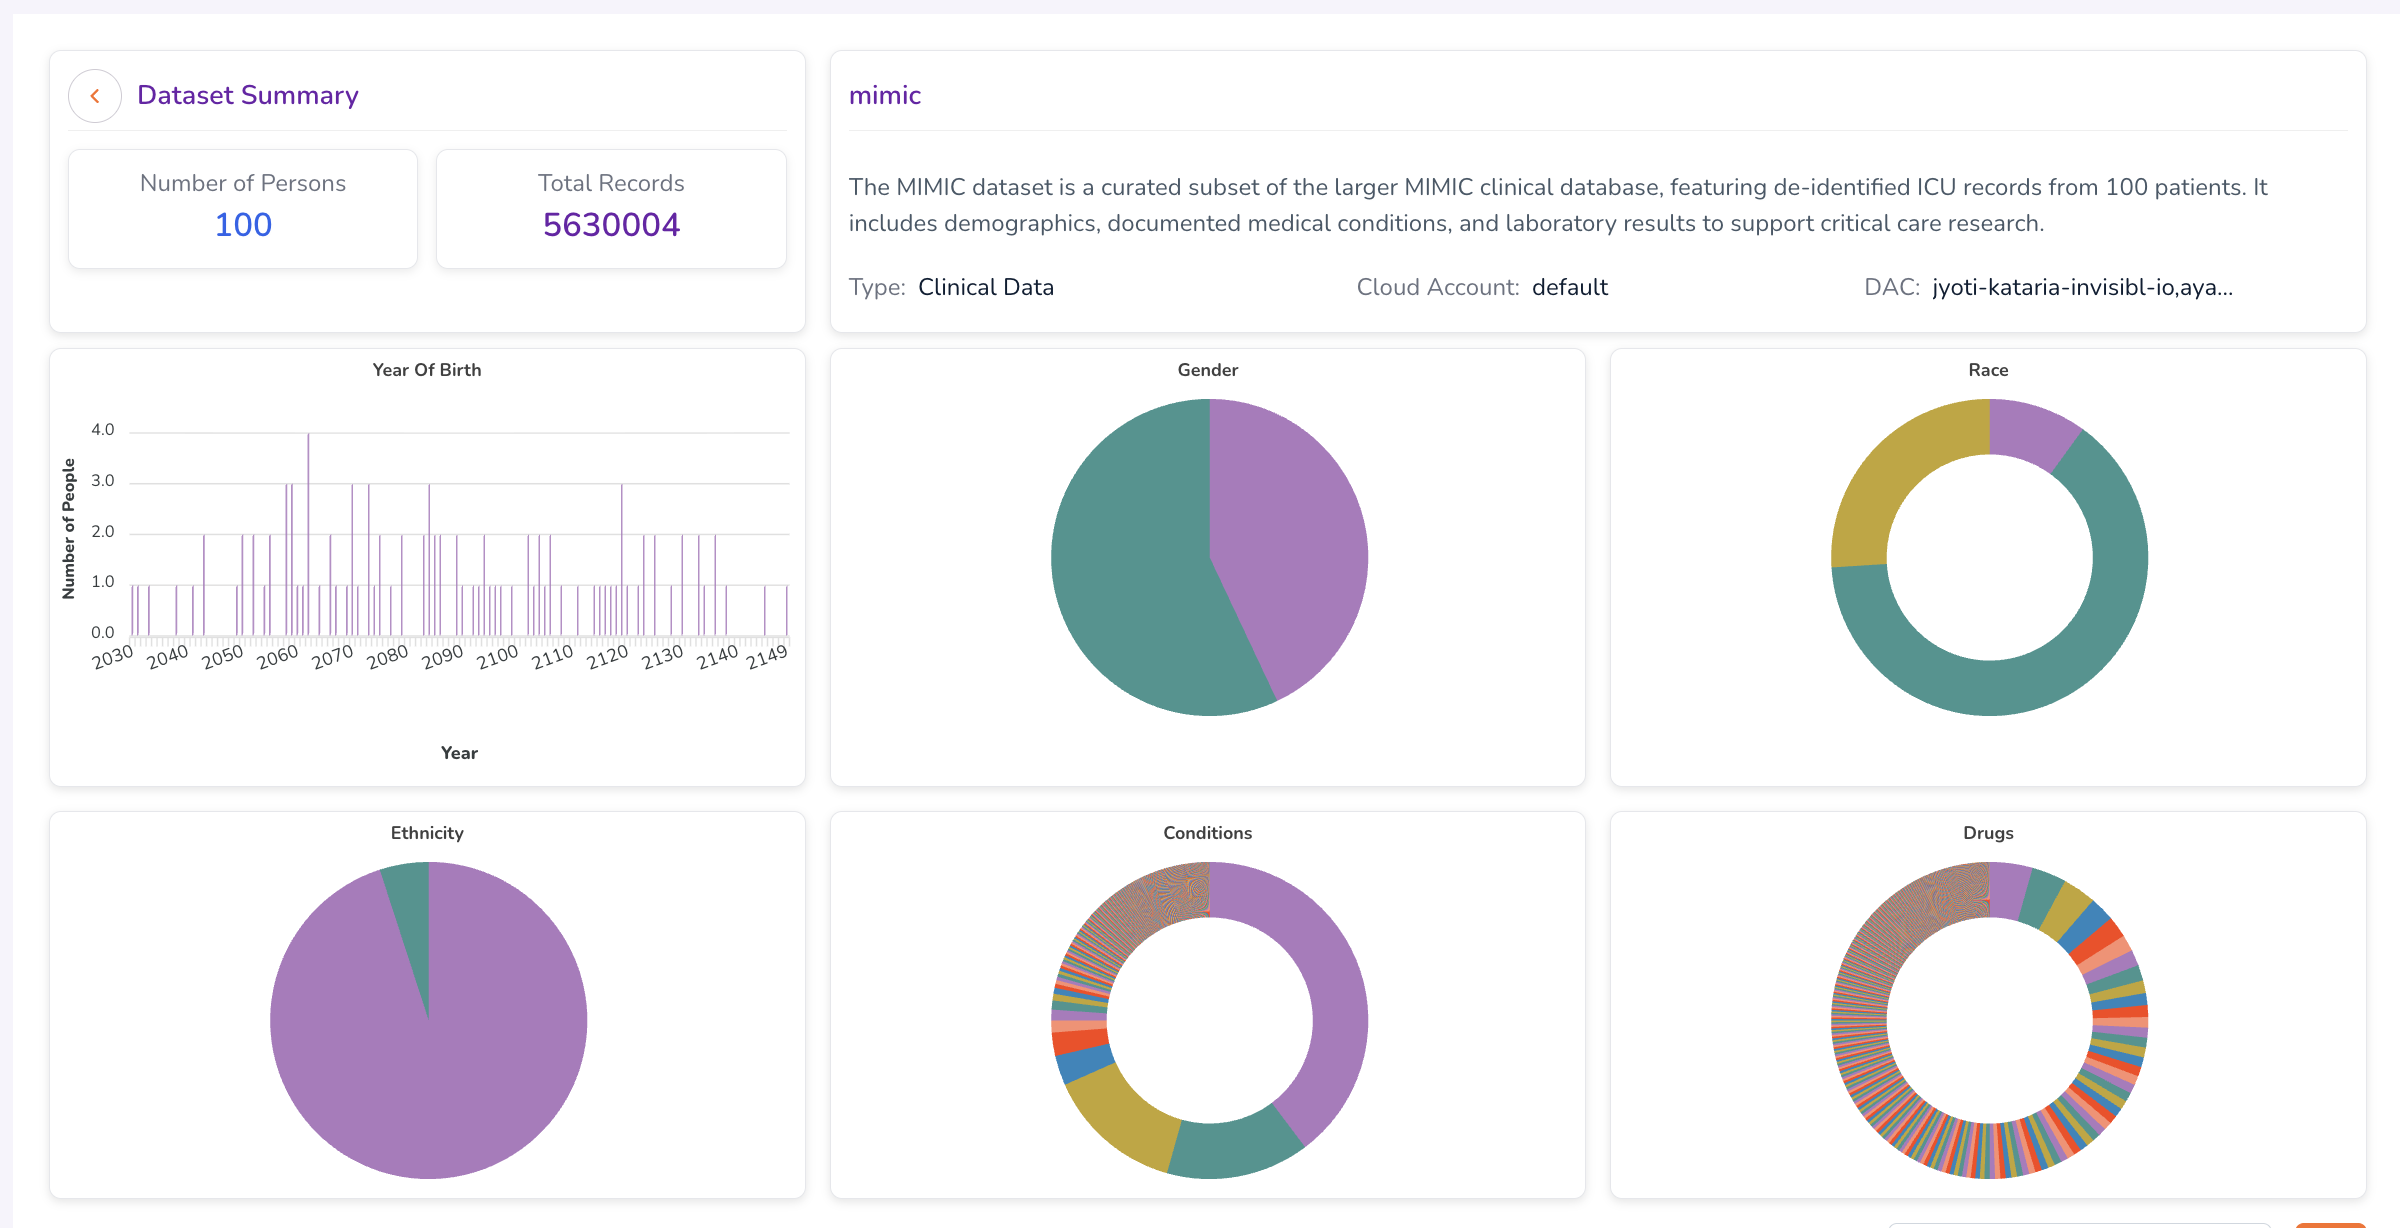
The summary includes charts and metrics across the following attributes:
| Attribute | Description |
|---|---|
| Year of Birth | Distribution of patient birth years within the dataset. |
| Gender | Breakdown of patient gender demographics. |
| Race | Racial composition of the dataset population. |
| Ethnicity | Ethnic composition of the dataset population. |
| Conditions | Prevalence of medical conditions represented in the dataset. |
| Drugs | Distribution of drug prescriptions or exposures across the patient population. |
Hover over individual charts to view exact counts and additional detail.

Record-Level Data
Scrolling below the Dataset Summary Dashboard reveals the record-level table. This table is not visible to researchers until they have received explicit Data Access Committee approval — the Infrastructure Administrator has access to it at all times.
The table displays either Person-level or Specimen-level records. Use the dropdown in the top-right corner of the table to toggle between the two views.

Person Dashboard
To inspect an individual patient record, type a Person ID into the search field within the Person ID column of the Person table, then click the Person ID in the results.
This opens the Person Dashboard — an anonymised view of that patient's full medical record within the dataset. The Person Dashboard is organised into three sections.
Medical History
The Medical History section displays the patient's anonymised clinical history, including a Sankey chart that visualises the progression of conditions and treatments over time — showing how diagnoses map to drug exposures across the patient's record.

Drug Exposure
The Drug Exposure section shows the patient's full drug exposure history. Toggle between two views using the controls at the top of the section:
- Plot View — A graphical timeline showing drug exposure periods and durations.
- Table View — A tabular listing of drug exposure records, including drug name, start date, and end date.


Specimen Data
The Specimen Data tab within the Person Dashboard provides a summary of genomic variants found in the patient's associated sample — giving a high-level view of the specimen data linked to this individual record.
Specimen Dashboard
To inspect a specific specimen record in detail, return to the record-level table, toggle the dropdown to Specimen, type a Specimen ID into the search field, and click the Specimen ID in the results.
This opens the Specimen Dashboard, which provides an in-depth view of the genomic variant data associated with that specimen.

The Specimen Dashboard includes:
| Section | Description |
|---|---|
| Clinical Significance | Classification of the clinical significance of variants identified in the specimen. |
| Variant Class | Types of variants identified (e.g., SNP, insertion, deletion). |
| Impact | Predicted functional impact of each variant on gene expression or protein function. |
| Consequence | The consequence type for each variant (e.g., missense, synonymous). |
| Variant Occurrence Table | A detailed table listing all variant occurrences within the specimen, including genomic coordinates, allele frequencies, and annotation details. |
What's Next
- Reference Data — Upload and manage the static datasets and files that are made available through this catalog.
- Computes — Confirm that compute configurations are provisioned for the projects whose datasets appear in this catalog.
- Workstation Templates — Ensure researchers have the right workstation environments to analyse data from the datasets available to their project.