Audit Logs
Overview
The Audit Logs section provides the DS Administrator with a chronological, immutable record of all actions and events across the platform. Every user action, resource change, access event, and administrative decision is captured as a log entry that cannot be edited or deleted.
Navigation: Select Audit Logs from the left-hand navigation pane.
The Audit Log Dashboard
When you open Audit Logs, the dashboard lists log entries in reverse chronological order — the most recent events appear at the top.
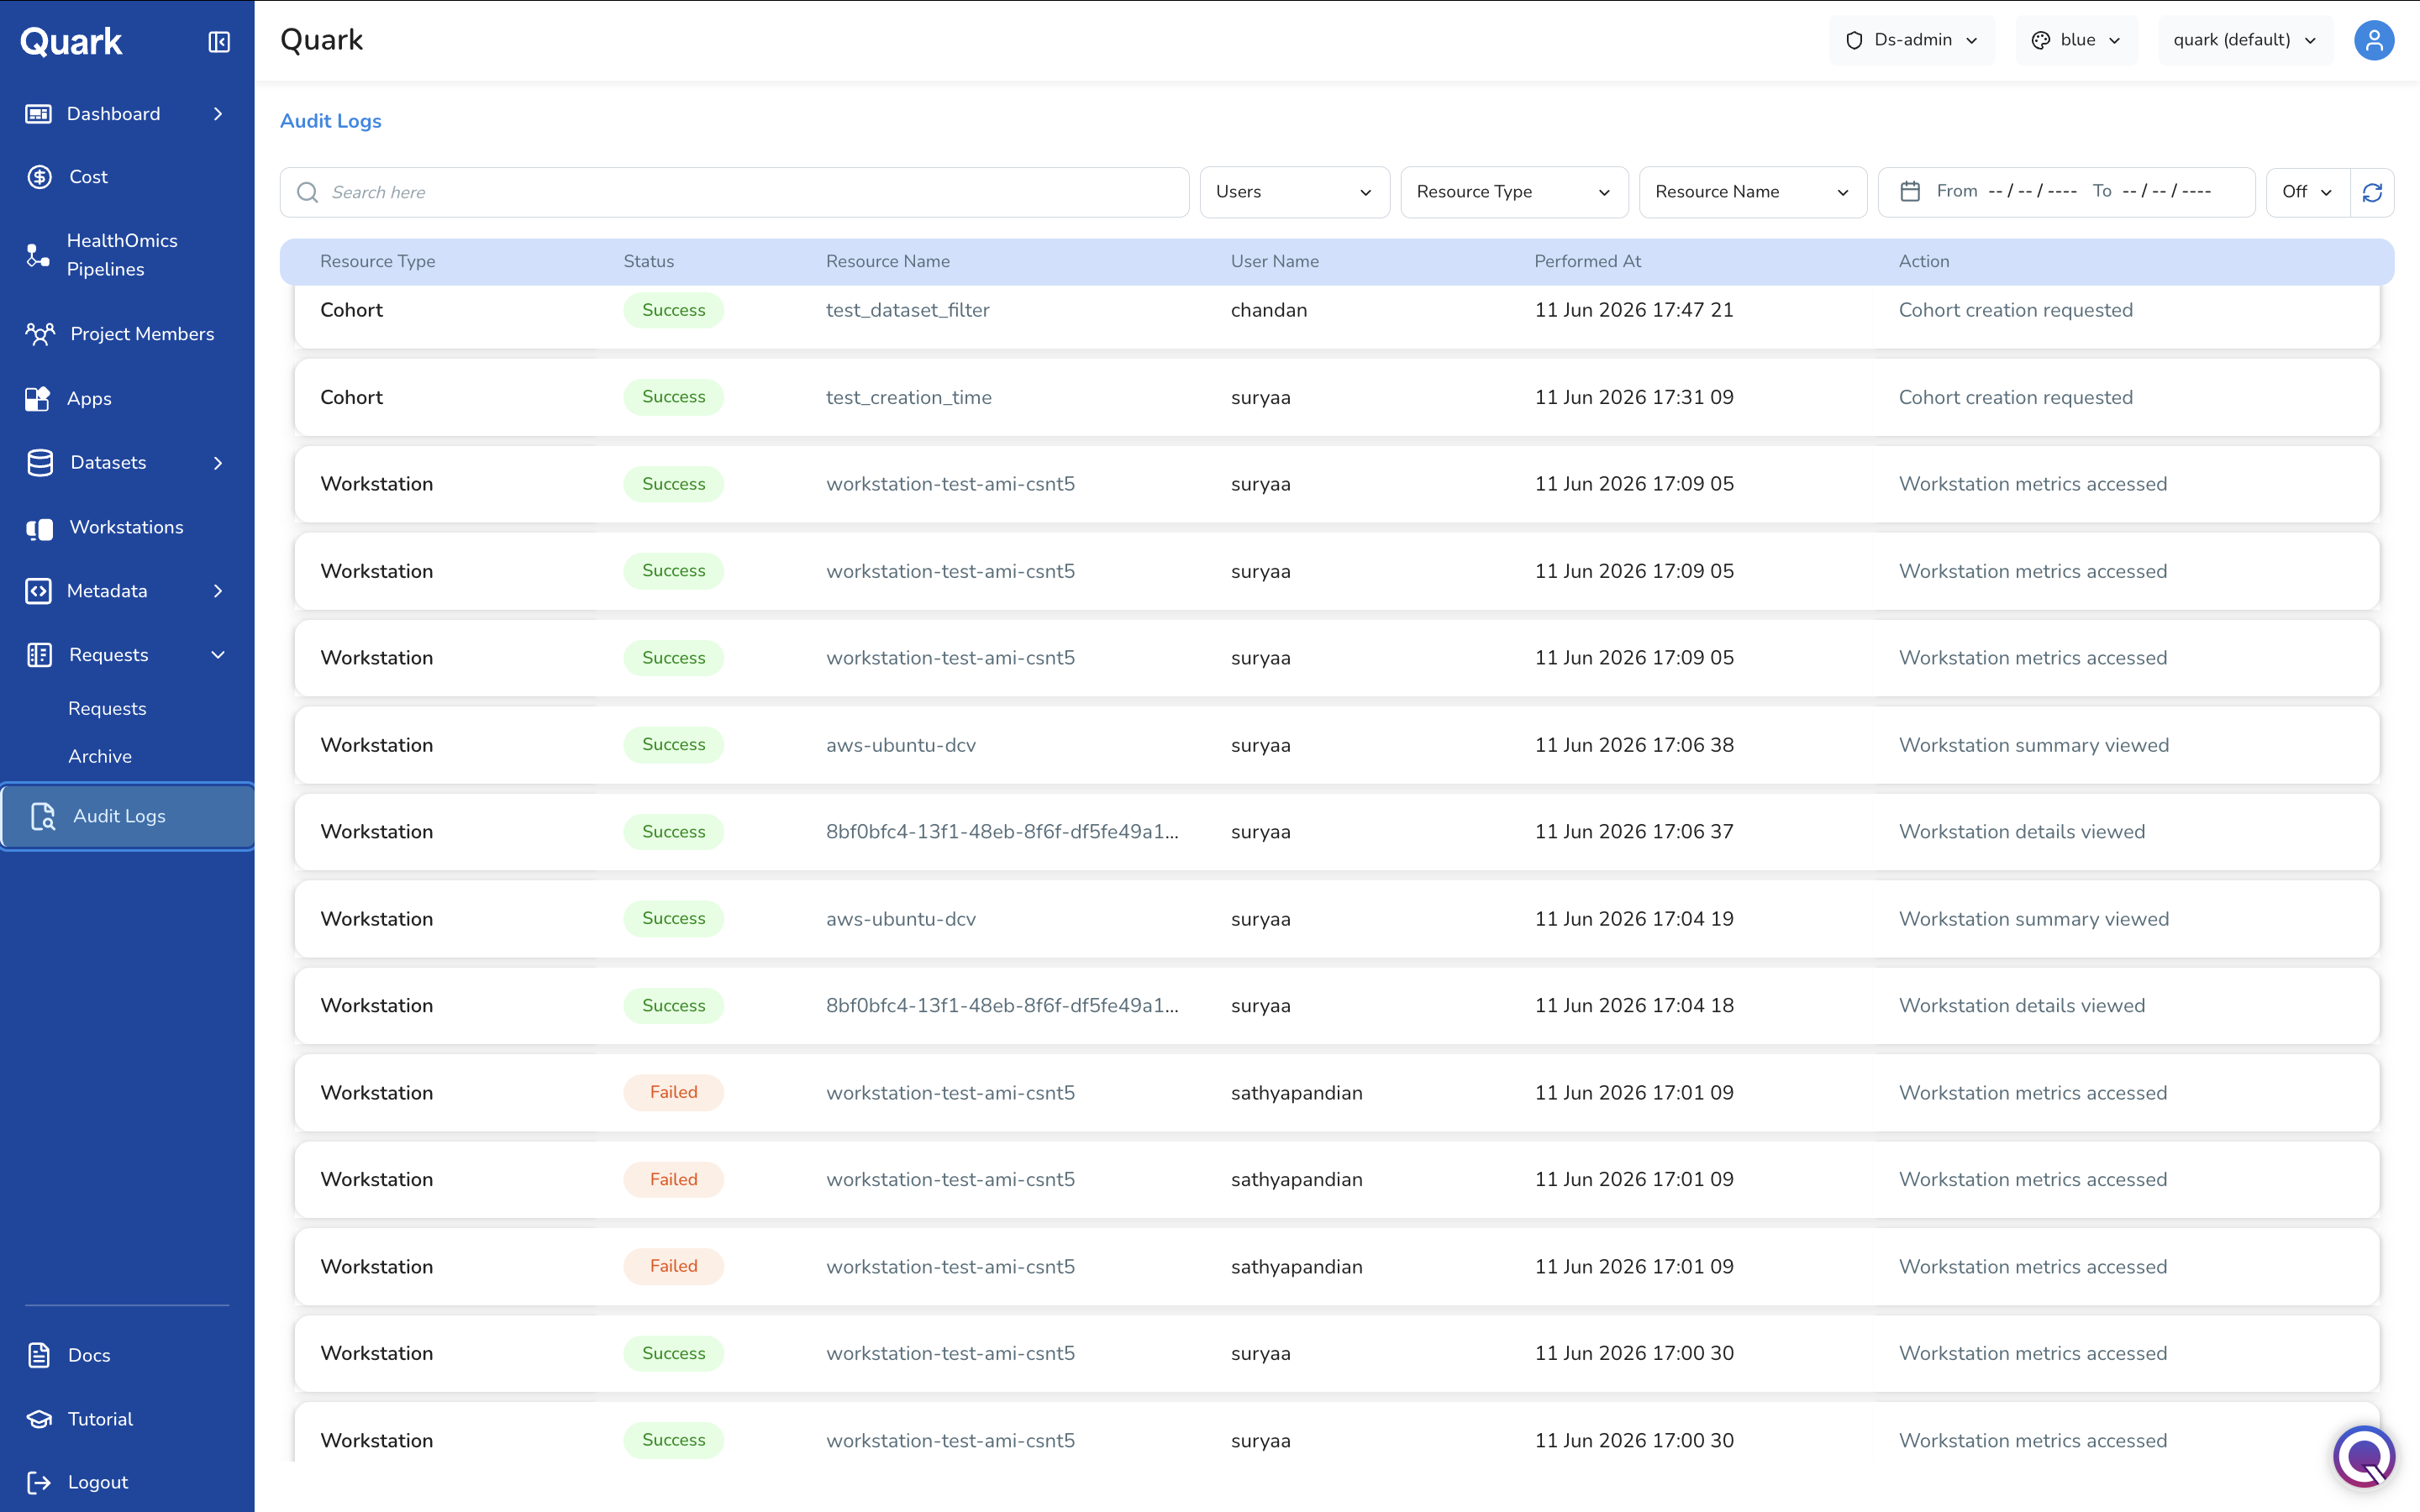
Filtering the Audit Log
The log can contain a high volume of entries. Use the filter controls to narrow the view to the events most relevant to your current investigation or review task.
Filter by User
Scope the log to all actions performed by a specific user — useful for reviewing an individual's activity as part of an access review or incident investigation.
Filter by Resource Name
Look up all events affecting a specific named resource — for example, a particular workstation, dataset, project, or pipeline.
Filter by Resource Type
Filter the log to a category of resource:
| Resource Type | Examples |
|---|---|
| Workstations | Workstation launch, connect, stop, terminate events. |
| Datasets | Dataset access, cohort creation, download events. |
| Projects | Project creation, membership changes, configuration updates. |
| Users | User login attempts, role changes, onboarding events. |
| Settings | Platform configuration changes, metadata rule updates. |
Filter by Date Range
Focus the log on a specific time window. This may be useful for investigating an incident, preparing a compliance report for a defined period, or correlating log events with cost anomalies.
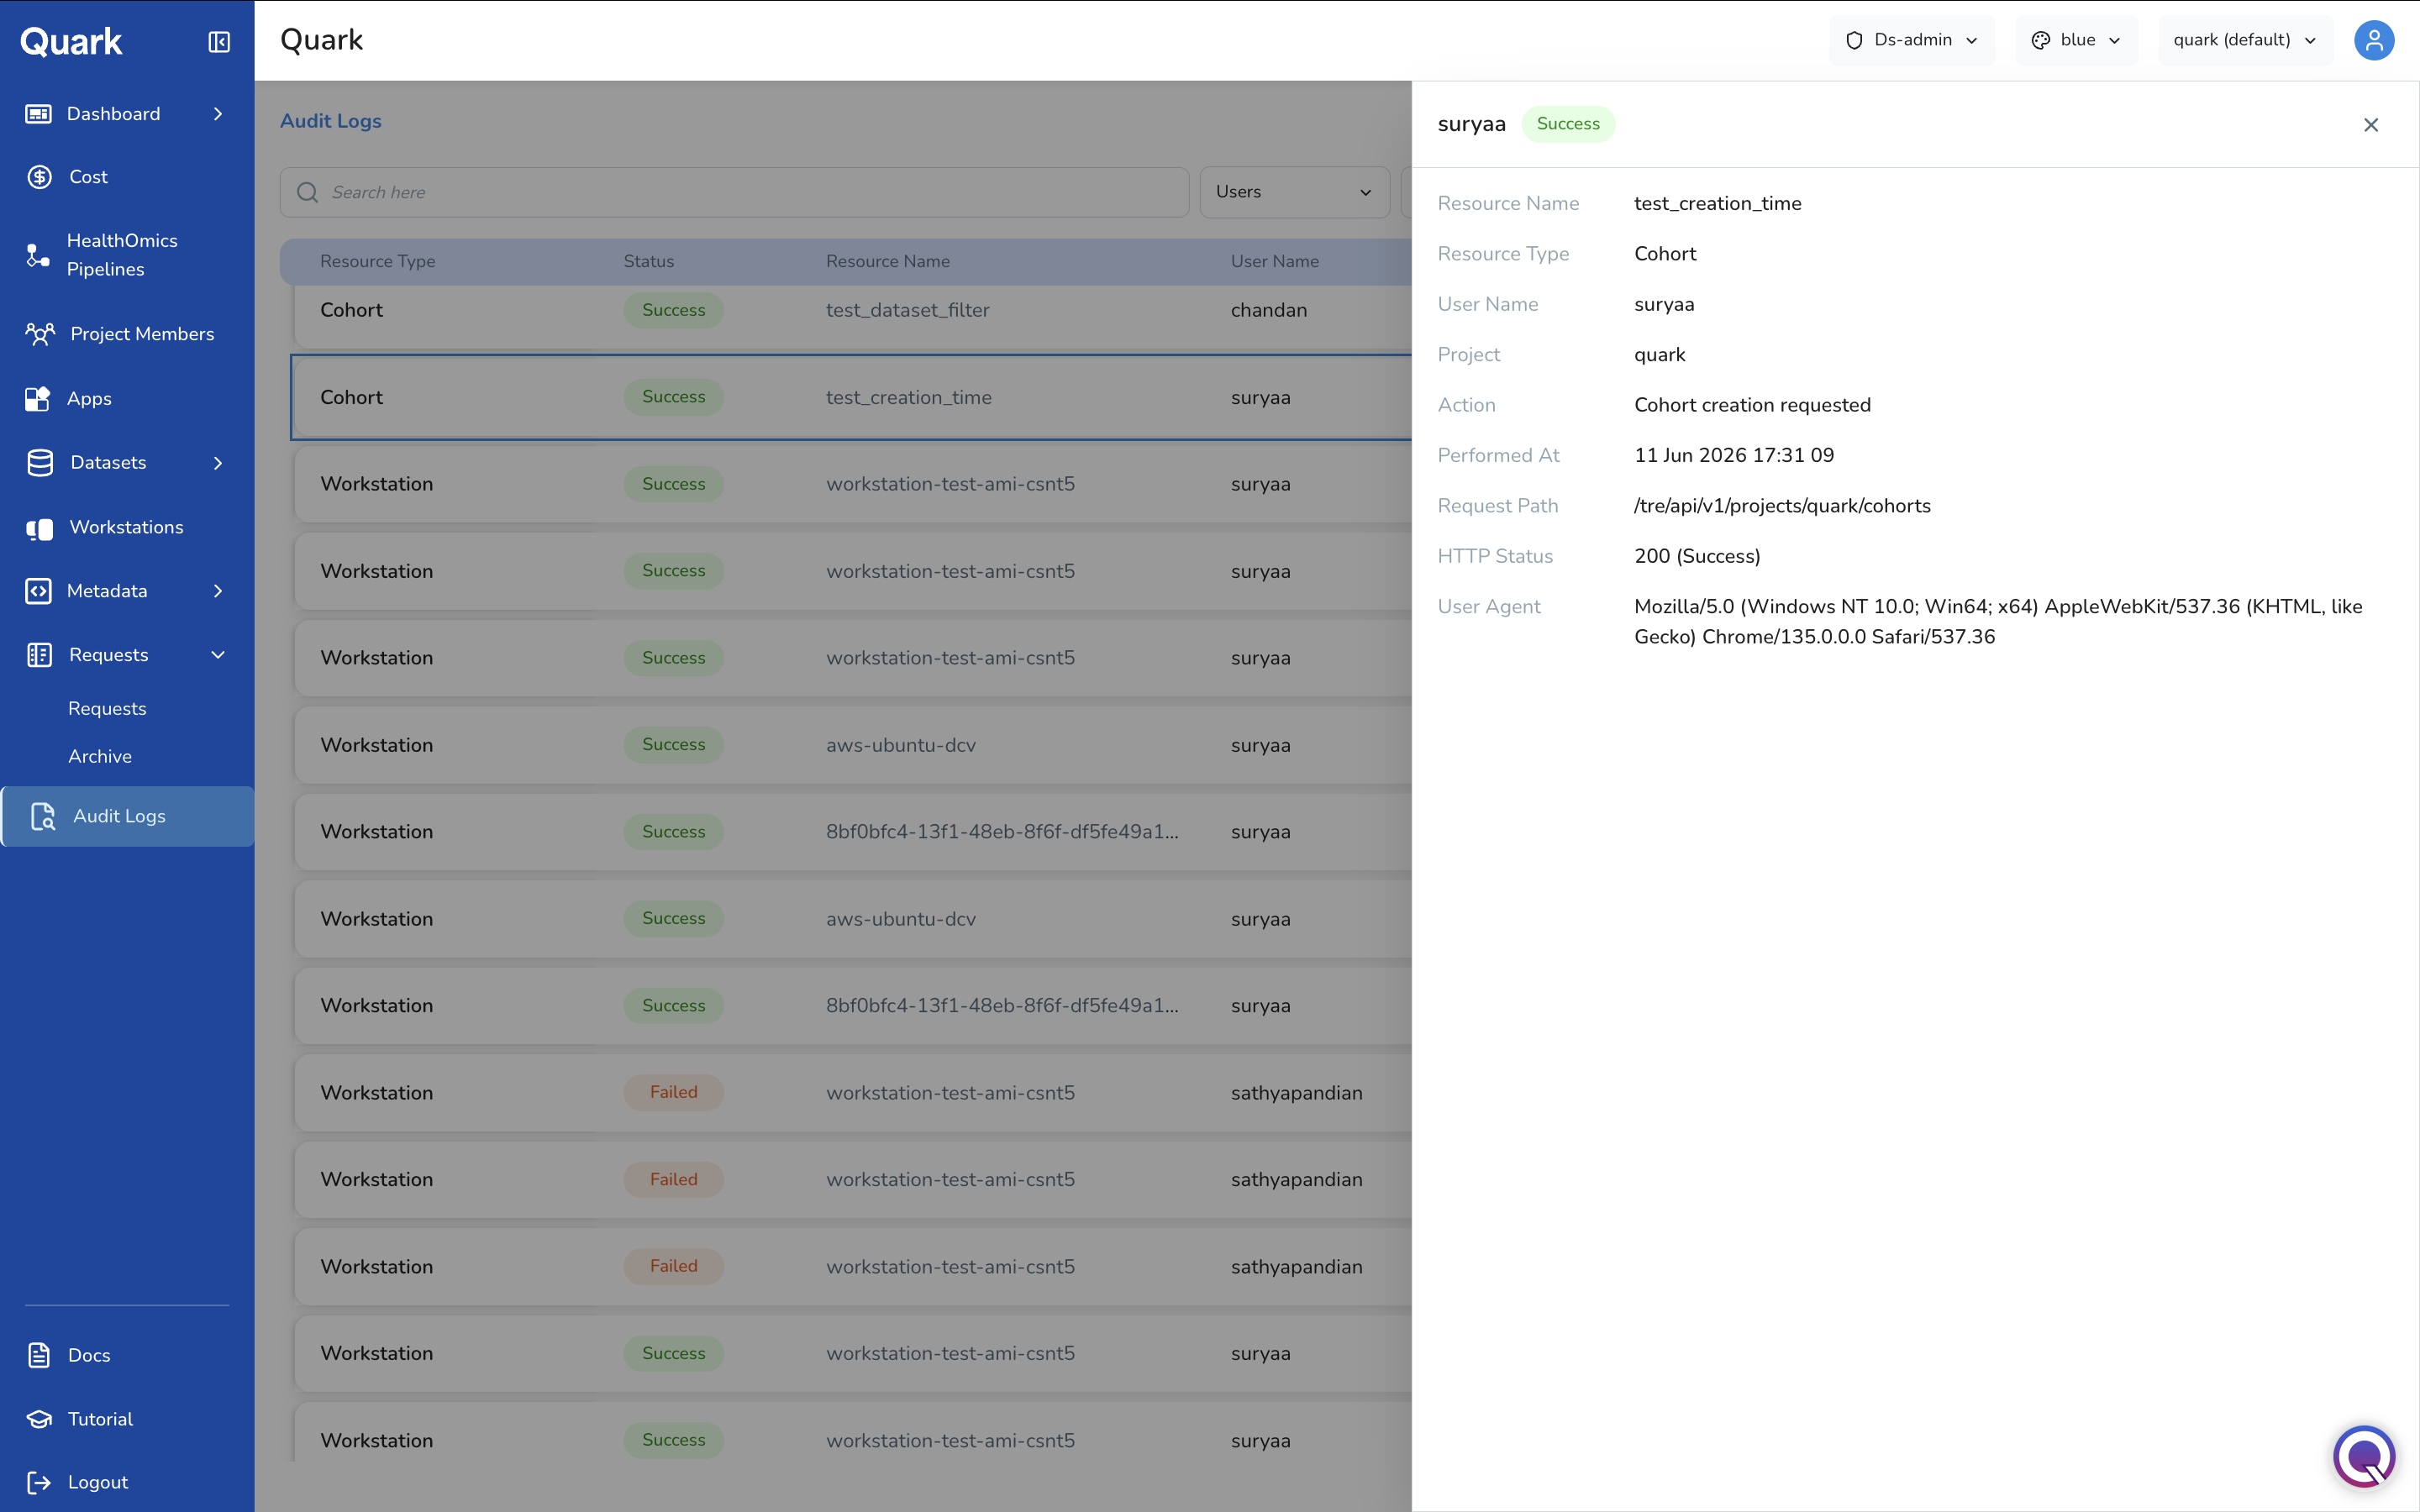
Reviewing Individual Log Entries
Click any row in the audit log to open its full detail view. Each log entry contains:
| Field | Description |
|---|---|
| Resource Name | The specific resource the action was performed on (e.g., the name of the workstation or dataset). |
| Resource Type | The category of resource (workstation, dataset, project, user, settings). |
| Username | The user who performed the action. |
| Associated Project | The project context in which the action occurred, if applicable. |
| Performed Action | The action taken (e.g., create, update, delete, access, login, approve, reject). |
| Timestamp | The exact date and time the action occurred. |
| Request Path | The API endpoint that handled the action — useful for technical investigation of platform behaviour. |
| HTTP Status | The response status code. Use this to quickly distinguish successful actions (e.g., 200) from failed attempts (e.g., 403 Forbidden, 500 Internal Server Error). |
| User Agent | The client from which the action originated — browser, CLI, or SDK. |
Common Audit Tasks
Investigating a Sensitive Data Access Event
- Filter by Resource Type = Dataset (or Workstation, if accessed via a workstation session).
- Optionally filter by the specific Resource Name of the dataset in question.
- Open entries to review which users accessed the dataset, and when.
Auditing Workstation Sessions
- Filter by Resource Type = Workstation.
- Optionally filter by project or user to scope the results.
- Open each workstation entry to confirm which templates were used and which datasets were accessed during the session.
Correlating with Cost Anomalies
If the Cost dashboard shows an unexpected spike in a particular period:
- Filter the audit log by the same Date Range as the cost anomaly.
- Filter by Resource Type = Workstation or Pipelines, depending on where the cost spike originates.
- Review the actions in that window to identify the user and resource responsible.
Important Notes
- Audit log entries are immutable — they cannot be edited or deleted by any role, including the DS Administrator.
- The log captures both successful and failed actions. Use the HTTP Status field to distinguish between them: 4xx and 5xx status codes indicate failed attempts that may warrant investigation.
- All approval and rejection actions taken in Requests are captured in the audit log, providing a complete administrative decision trail.
What's Next
- Requests — If audit findings reveal unauthorised or unexpected access attempts, review the related requests history.
- Cost — Correlate audit events with cost spikes to trace resource consumption to specific users or actions.
- Workstations — If audit entries reveal workstations that were left running or accessed outside expected hours, review and terminate them from the Workstations section.