Datasets
Overview
The Datasets section gives researchers access to the clinicogenomic data assets available on Quark V3. It is organised into two tabs: Cohorts and Catalog.
- The Catalog tab is where you discover and evaluate datasets made available on the platform.
- The Cohorts tab is where you build, manage, and request access to filtered subsets of those datasets.
Quark V3 is designed to ensure that patient data remains confidential at all times while remaining Findable, Accessible, Interoperable, and Reusable for research, in accordance with FAIR data principles. To support this, the platform provides researchers with pre-access to aggregate dataset statistics — enabling them to understand a dataset's scope before requesting access to individual-level records.
Once approved, cohorts serve a dual purpose: they provide access to de-identified, person-level data for analysis, and they can be passed directly as inputs to pipeline runs.
Navigation: Select Datasets from the left-hand navigation pane. The section opens on the Cohorts tab by default.
Catalog Tab
Browsing the Data Catalog
The Catalog tab lists every dataset registered on the platform by your organisation. Each dataset is represented as a card showing its name, type, and last updated date.
To browse the catalog:
- Select Datasets from the navigation menu.
- Click the Catalog tab at the top of the page.
Use the search bar to filter datasets by name or description. All datasets visible to your organisation are listed here.
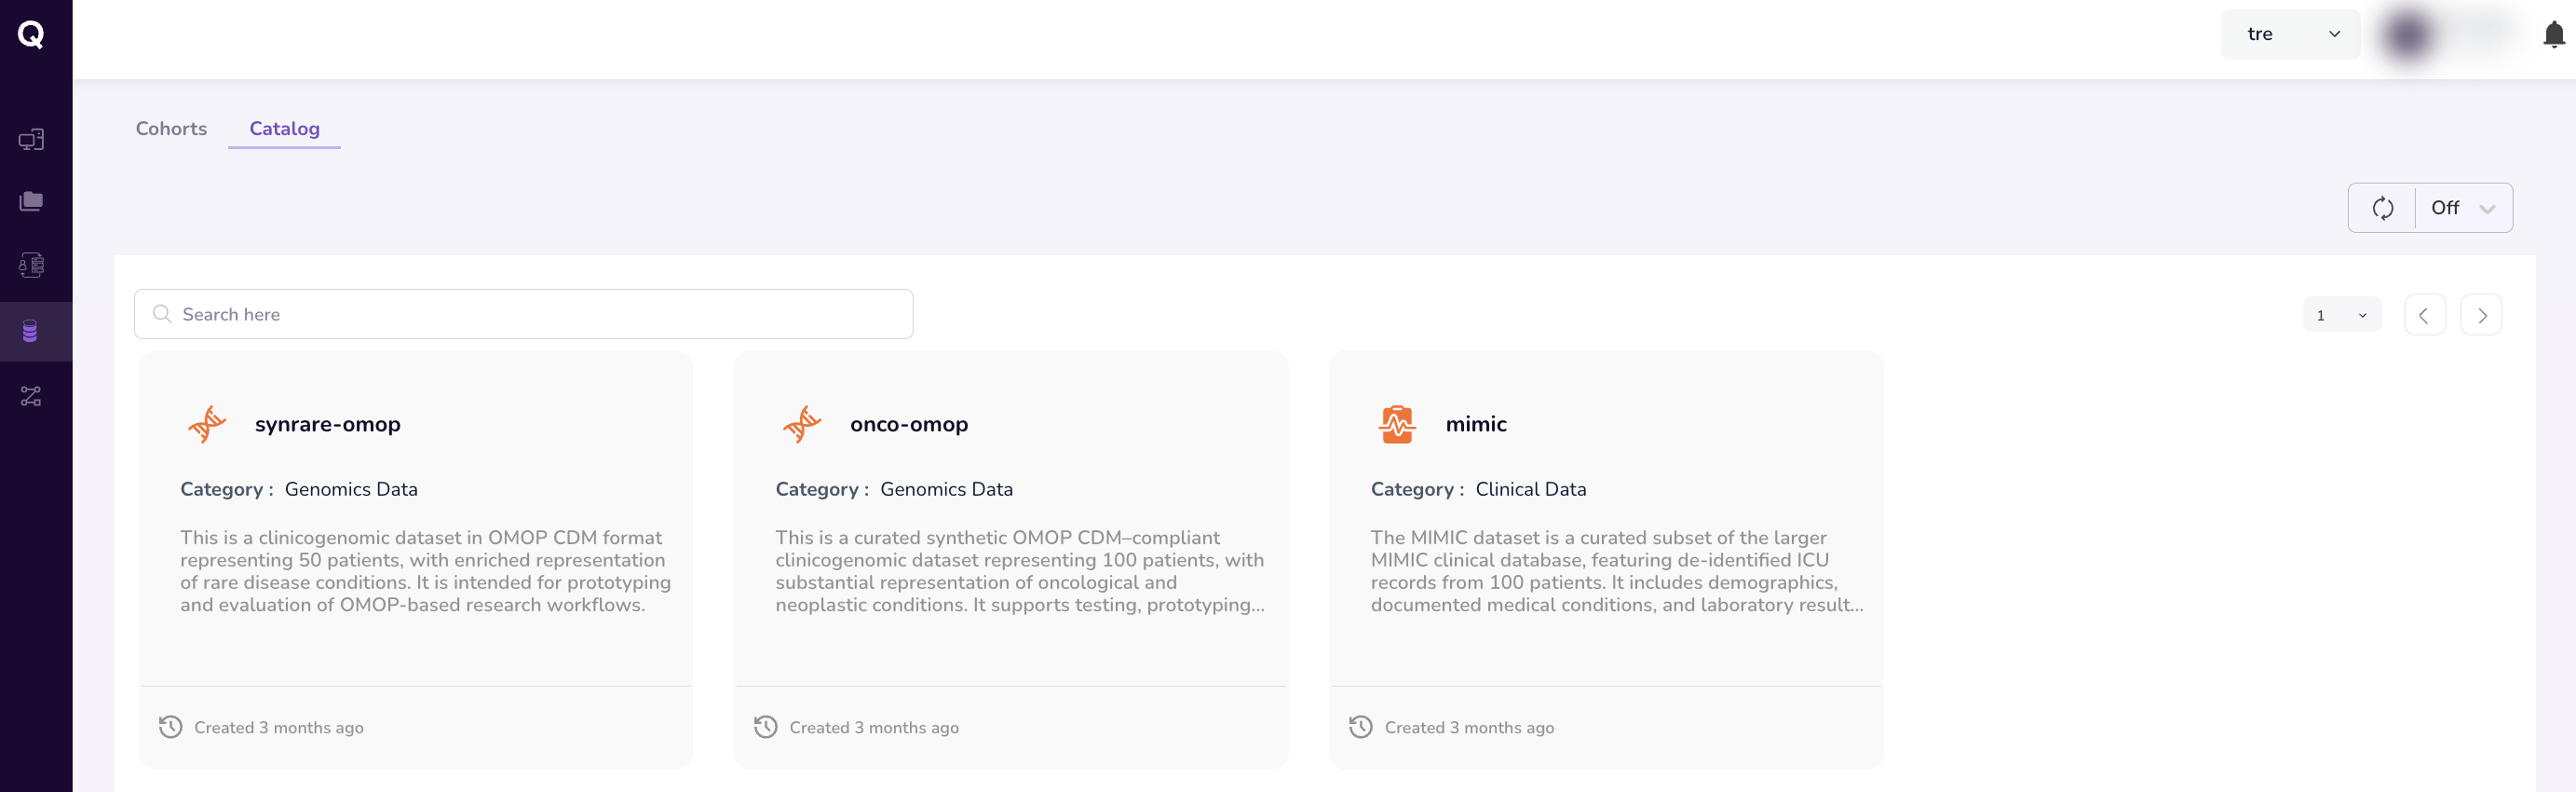
From any dataset card you can:
- Preview the schema — View the structure and field definitions of the dataset.
- Download a sample — Retrieve a representative sample for initial exploration.
- Reference in a pipeline — Copy the dataset reference for use in a pipeline parameter form.
Viewing the Dataset Summary Dashboard
Each dataset card opens a Dataset Summary dashboard that provides aggregate statistics and visualisations of the dataset's distribution — enabling you to evaluate its scope and relevance to your research without accessing individual-level records.
To open a Dataset Summary:
- Under the Catalog tab, click on a dataset of interest.
- The Dataset Summary dashboard opens, displaying a metadata overview of the dataset.
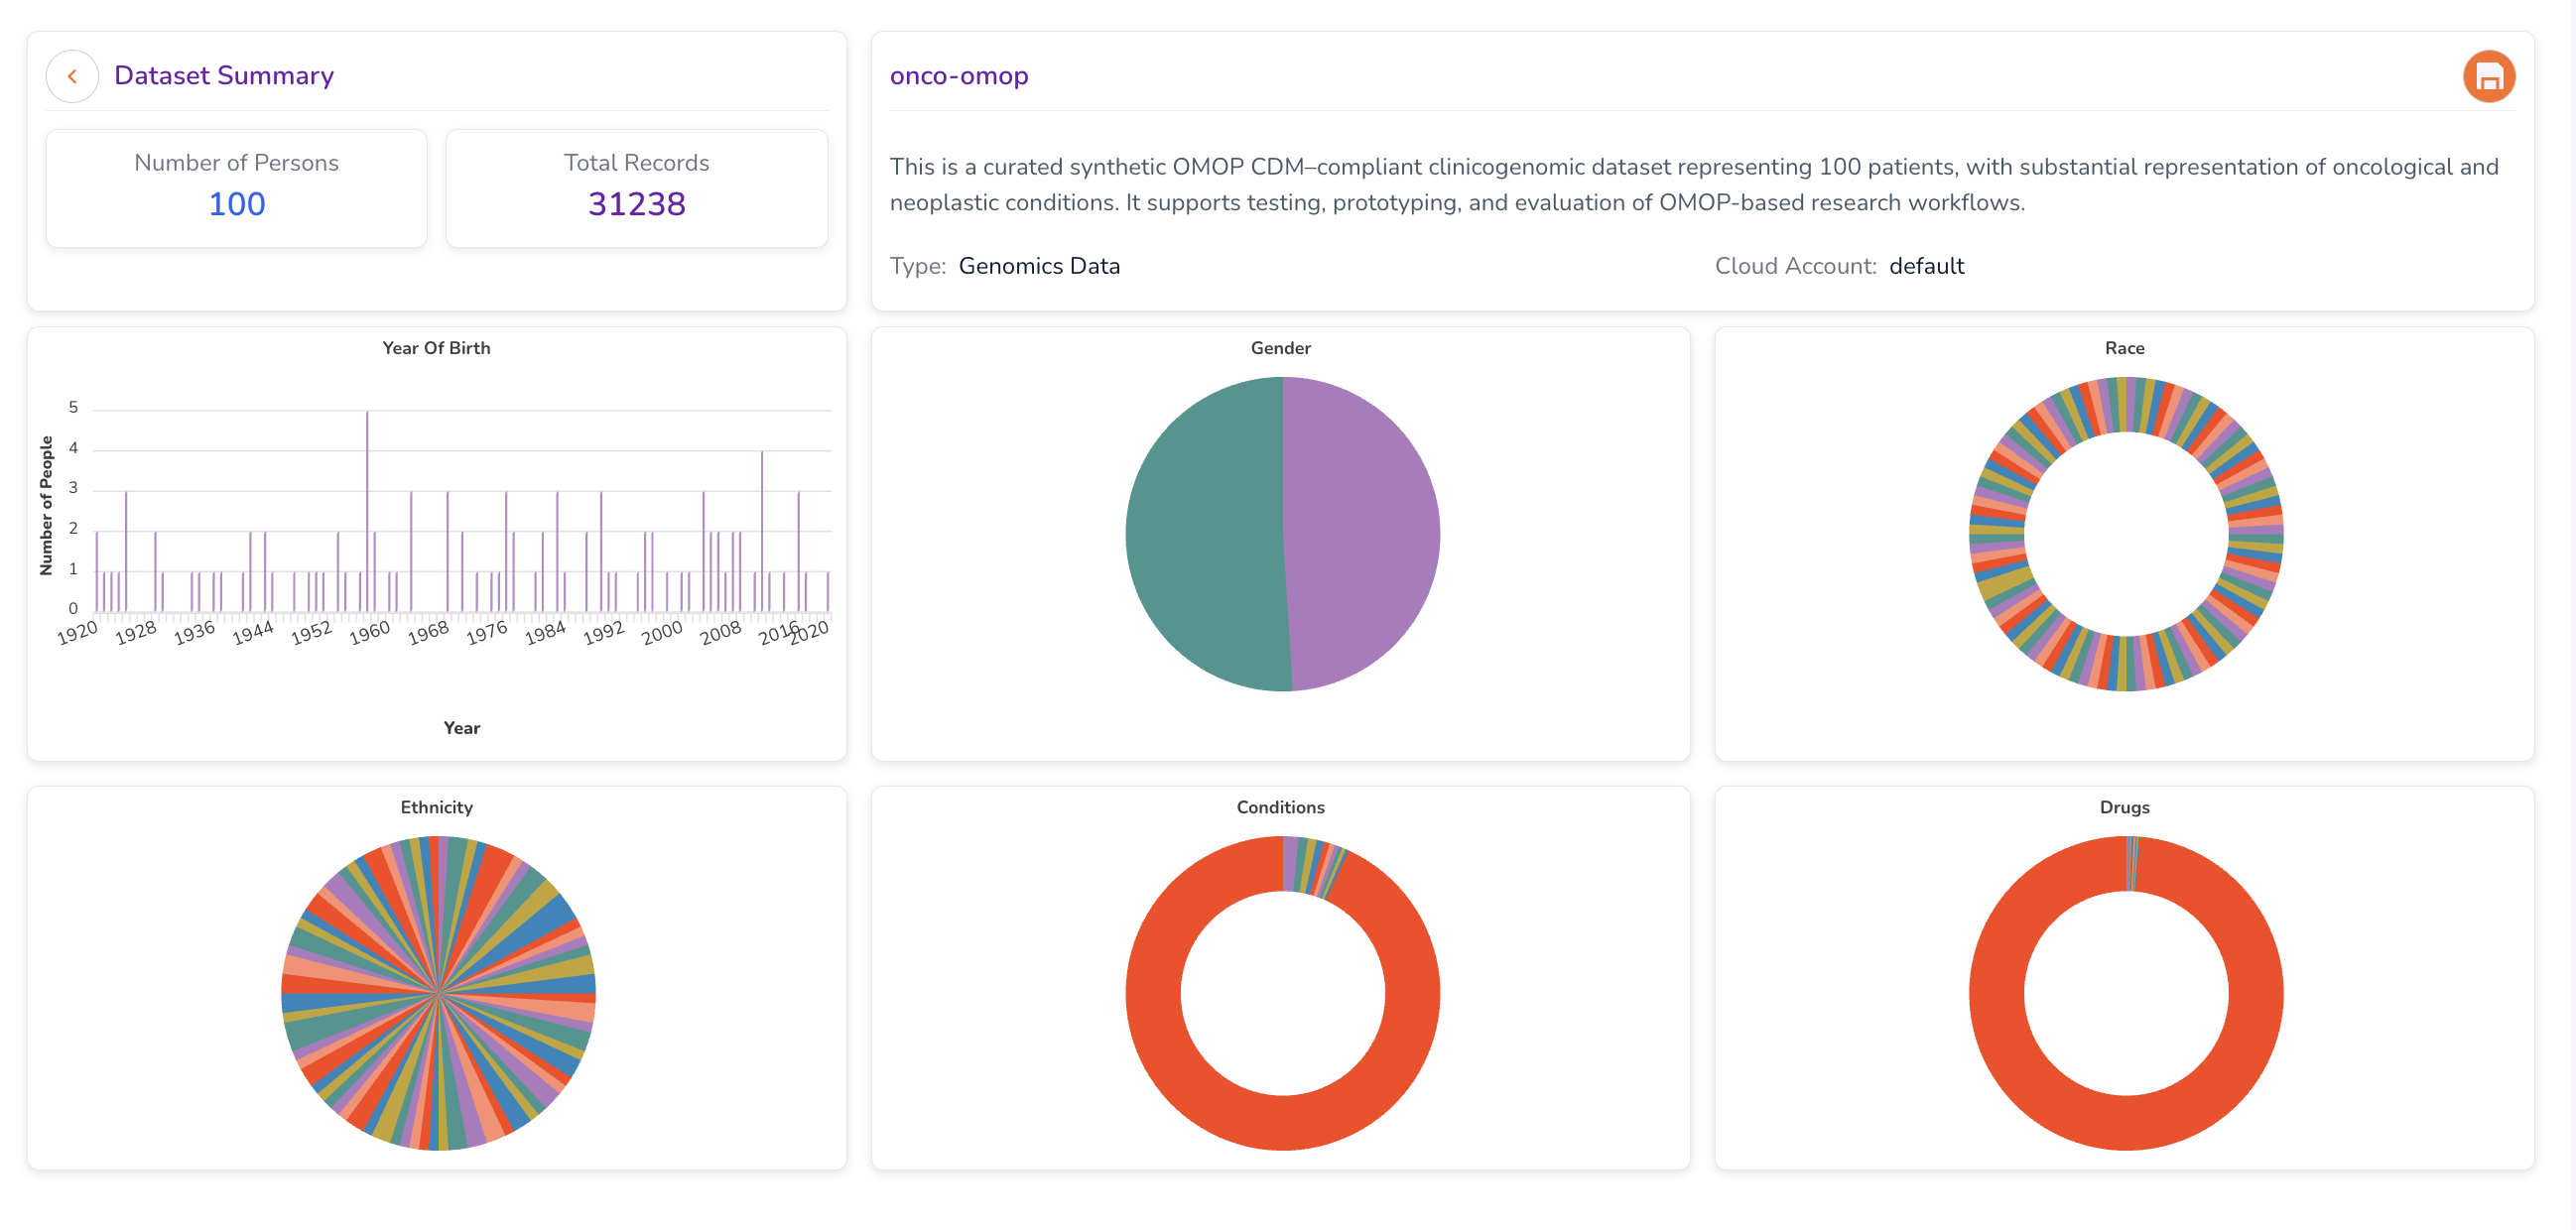
What the Dataset Summary Includes
The dashboard provides charts and metrics illustrating the size and composition of the dataset. Typical fields displayed include:
- Year of Birth — Distribution of patient birth years.
- Gender — Breakdown of patient gender demographics.
- Race — Racial composition of the dataset population.
- Ethnicity — Ethnic composition of the dataset population.
- Conditions — Prevalence of medical conditions.
- Drugs — Distribution of drug prescriptions or exposures.
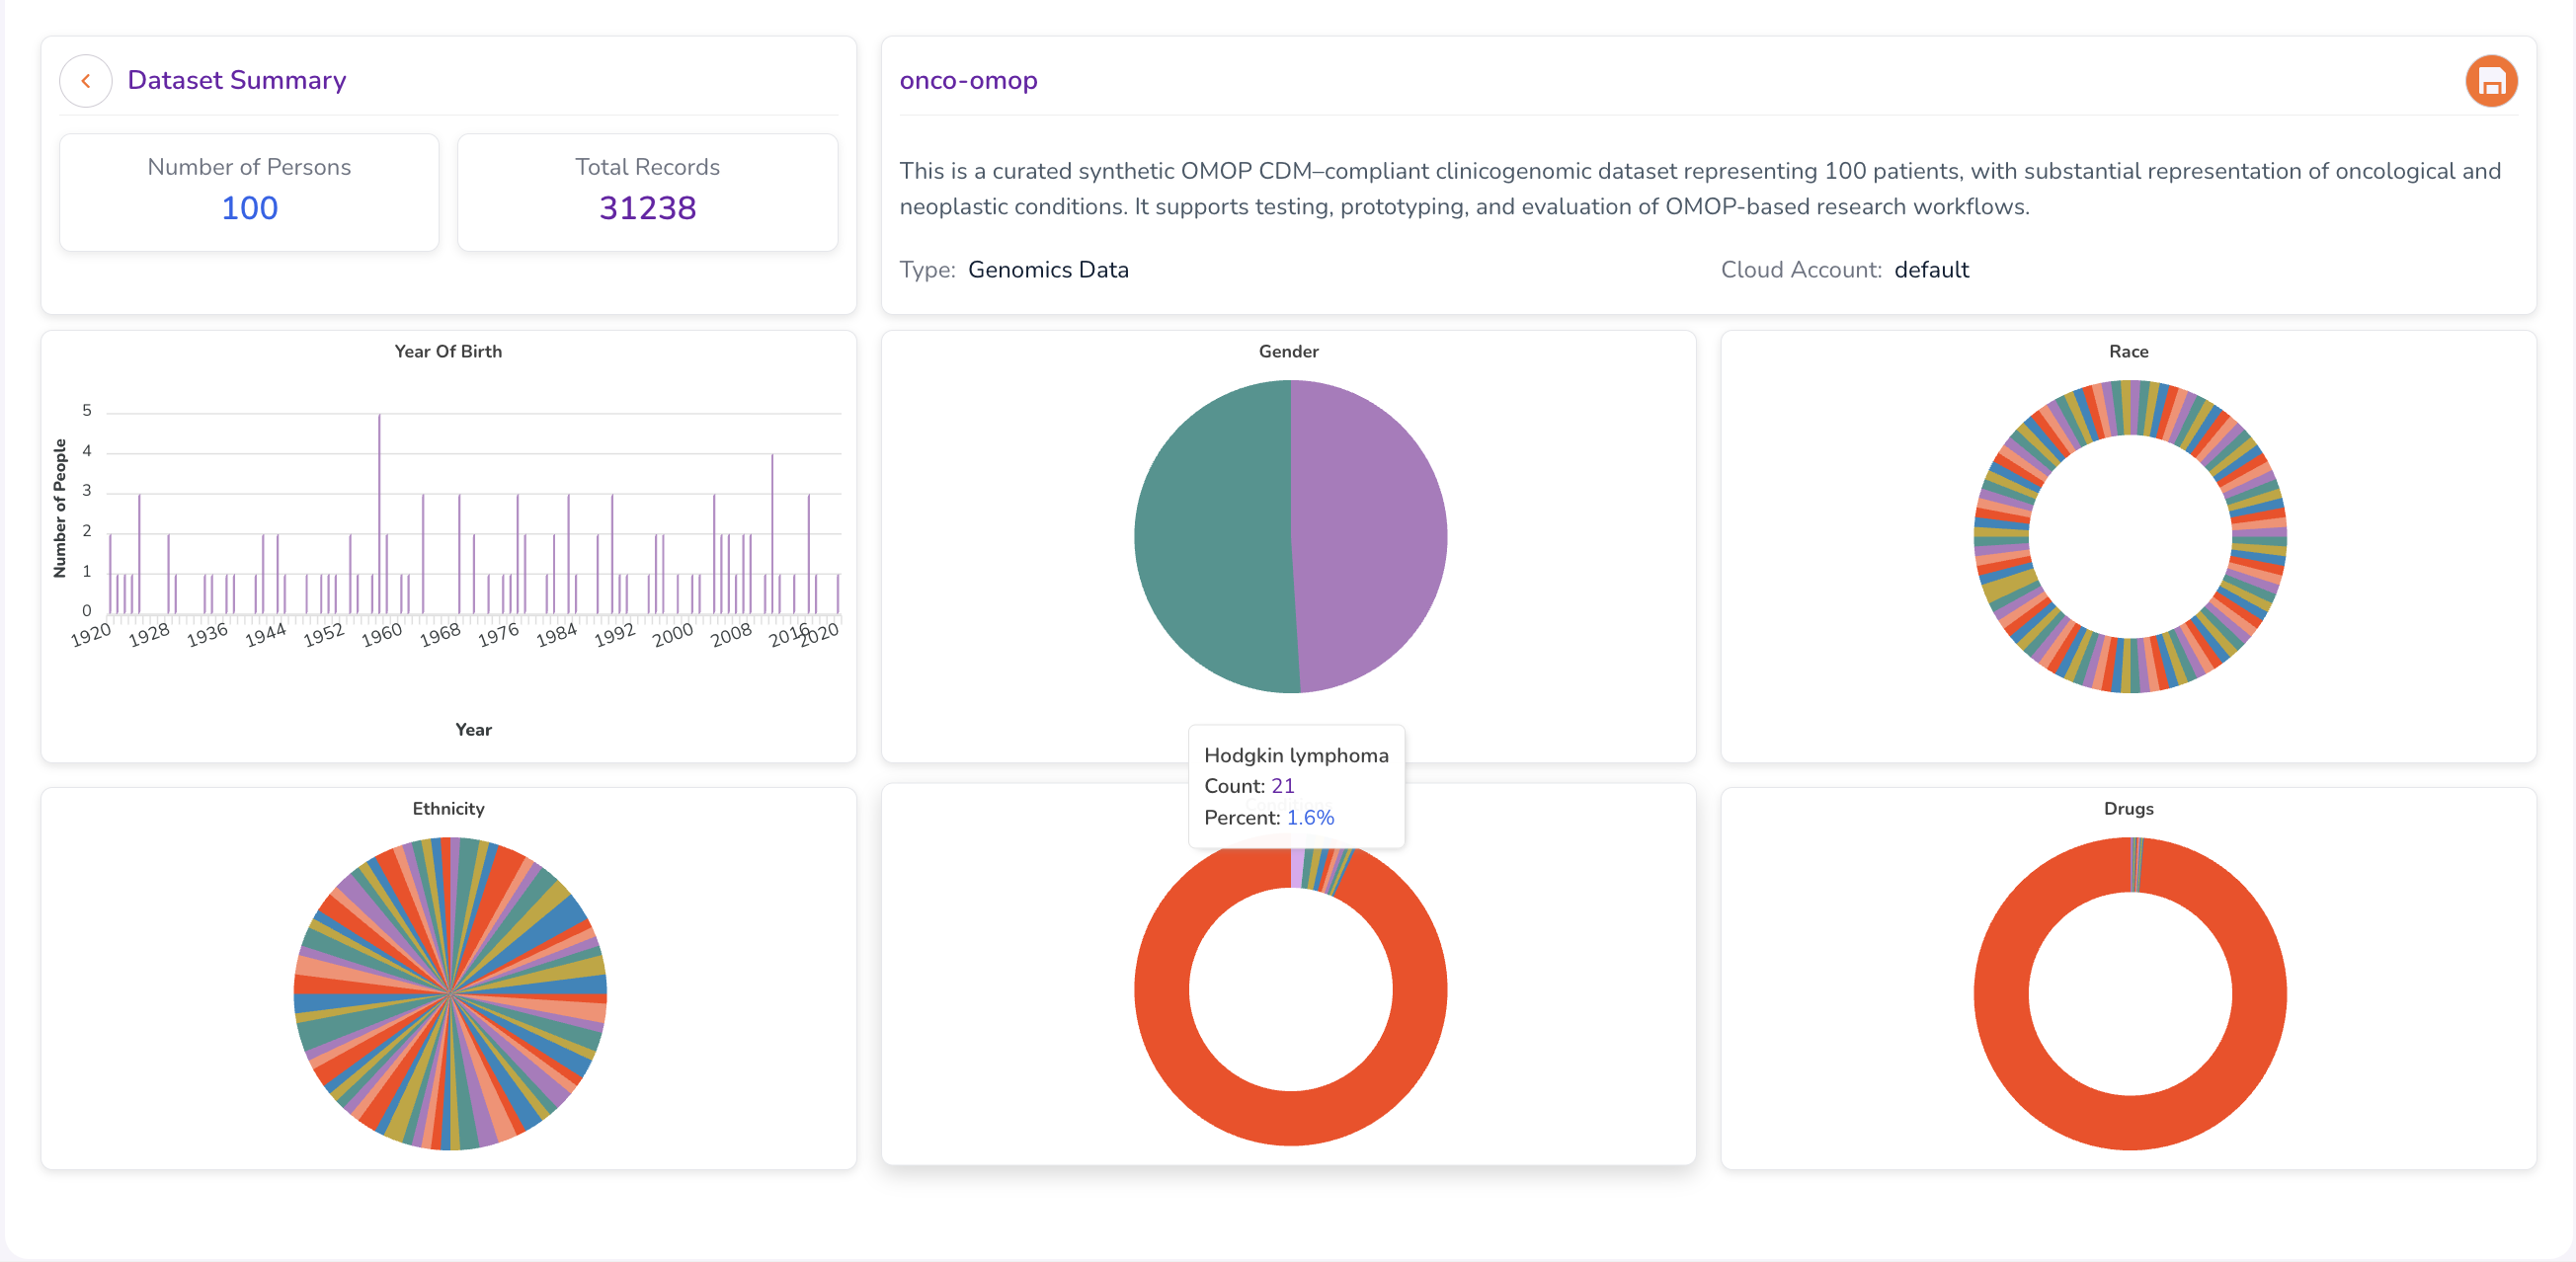
Hover over individual visualisations to view additional details and exact counts.
Evaluating Dataset Feasibility
The Dataset Summary enables you to validate whether a potential cohort is feasible before submitting an access request — confirming that the target dataset contains a viable population for your study to answer questions such as:
- Does the dataset contain a sufficient number of patients matching your demographic criteria?
- Are the relevant medical conditions and drug exposures represented?
- Is the dataset large enough to produce statistically meaningful results?
Understanding OMOP CDM
Quark V3 uses the Observational Medical Outcomes Partnership Common Data Model (OMOP CDM) to standardise clinical data into consistent structures and vocabularies (such as SNOMED and RxNorm). This standardisation provides:
- Day 1 Research Analysis — Standardised, retrievable data means you can begin analysis immediately upon gaining access.
- Reproducibility — Analytical workflows can be reproduced consistently across different workstations and environments.
- Federated Research — Studies can be run across multiple datasets using a single codebase.
OMOP-standardised tables are made accessible to researchers once their data access request has been approved, providing access to de-identified, person-level records.
Further reading: OMOP CDM documentation
Cohorts Tab
Browsing Your Cohorts
The Cohorts tab displays all cohorts you have saved or requested, each represented as a card. Click a card to view its composition, edit the definition, or use it as an input when launching a pipeline run.
Use the search bar to find an existing cohort by name.
Building a Cohort
A cohort defines a subset of a dataset that meets the specific phenotypic and/or genotypic criteria required by your research study. The Query Builder provides an interface for constructing cohort criteria without requiring knowledge of database query languages.
Cohort Building Workflow
| Step | Description |
|---|---|
| 1. Create a Cohort | Define your cohort's criteria using the Query Builder. |
| 2. Visualise the Cohort | Review aggregate statistics and visualisations. Refine criteria until the cohort meets your study requirements. |
| 3. Request Cohort Access | Submit an access request to your DS Administrator for review. |
Step 1: Creating a Cohort
Accessing the Query Builder
- Select Datasets from the navigation menu.
- Navigate to the Cohorts tab.
- Click Add Cohort in the top-right corner.
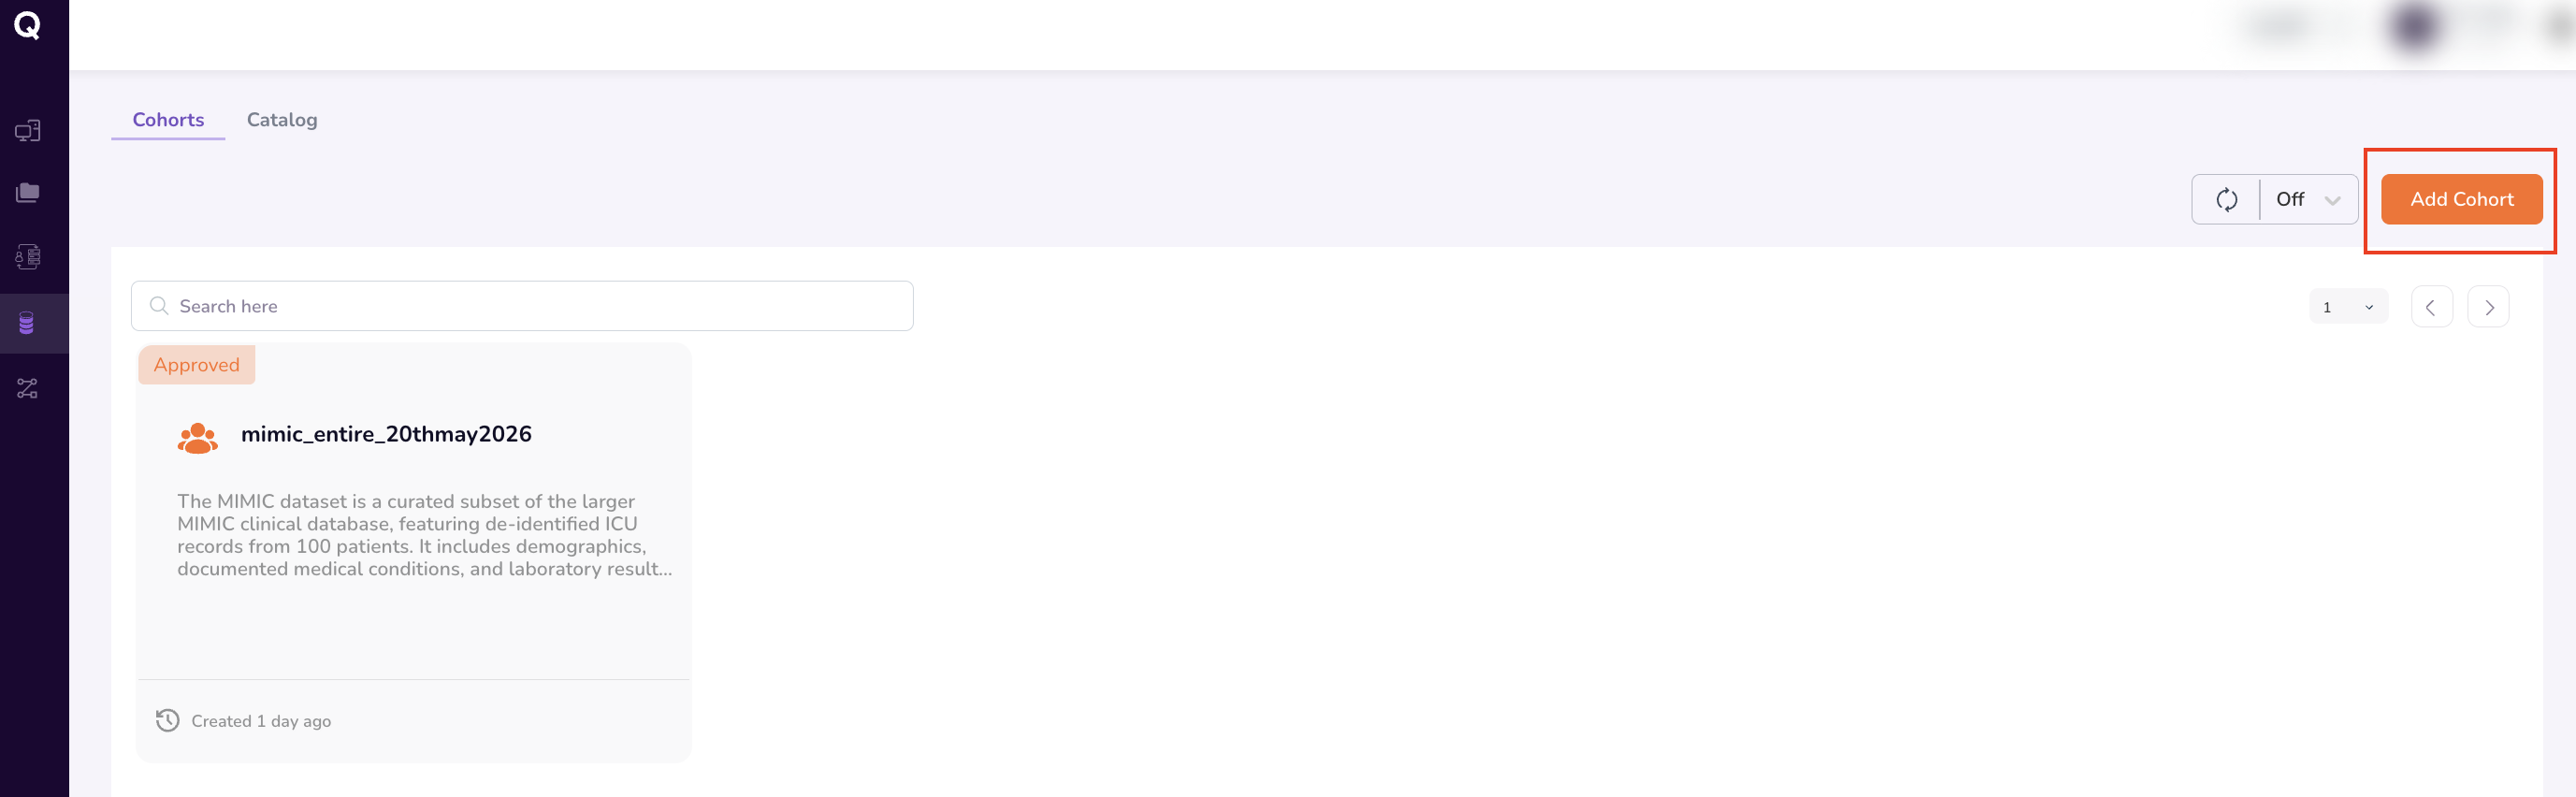
This opens the Query Builder interface.
Defining Cohort Criteria
The Query Builder constructs cohorts using a row-based filtering interface. For each criterion, define:
- Field — The data attribute to filter on (e.g.,
Year of Birth,Gender,Condition,Drug). - Operator — The logical comparison to apply (e.g.,
=,!=,>,>=,<,<=). - Value — The specific value or range to filter for (e.g.,
1980,Atrial Fibrillation).
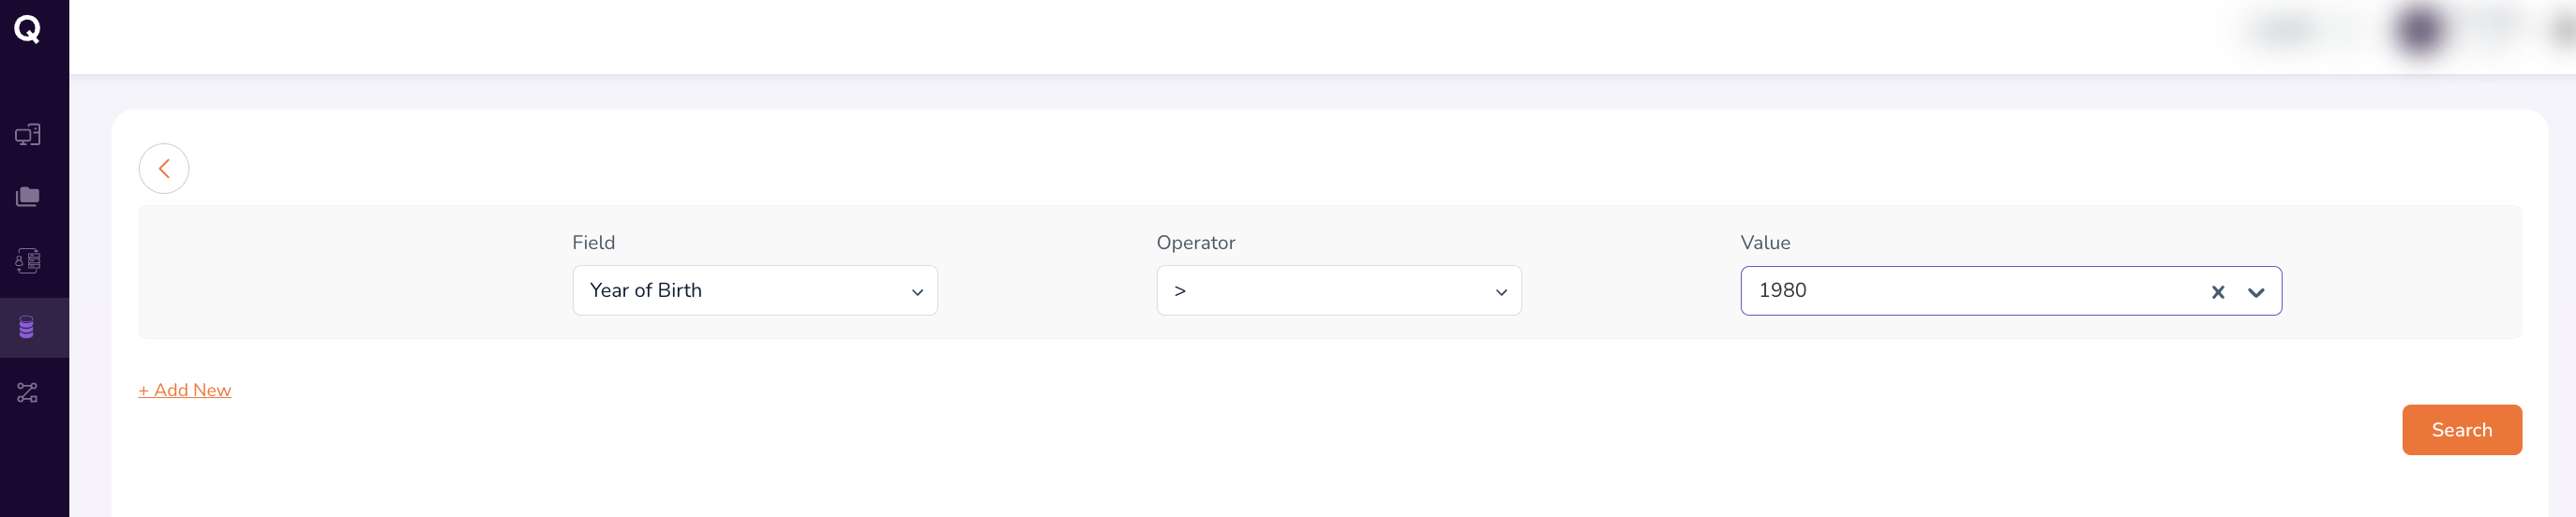
Adding Multiple Criteria
Click + Add New below the existing criterion row to add additional filters. Criteria are combined to narrow the cohort to the exact population your study requires.
For example:
| Field | Operator | Value |
|---|---|---|
| Year of Birth | > |
1980 |
| Conditions | = |
Atrial Fibrillation |
| Drug | = |
metoprolol tartrate 25 MG Oral Tablet |
Tip: When entering values for Conditions or Drug fields, begin typing the name and select the appropriate entry from the drop-down suggestions.

Running the Search
Once all criteria are defined:
- Review each row to confirm accuracy.
- Click Search at the bottom-right of the Query Builder.
The search retrieves matching records from all datasets available to you.
Step 2: Visualising the Cohort
Running a search generates a Cohort Summary dashboard. Use this to validate your cohort before requesting access.
Cohort Summary Dashboard
The Cohort Summary includes:
- Search query string — The criteria used to generate the cohort, displayed for easy review and modification.
- Aggregate statistics — Key demographic and clinical metrics for the retrieved population.
- Dynamic charts — Graphical distributions across cohort attributes.
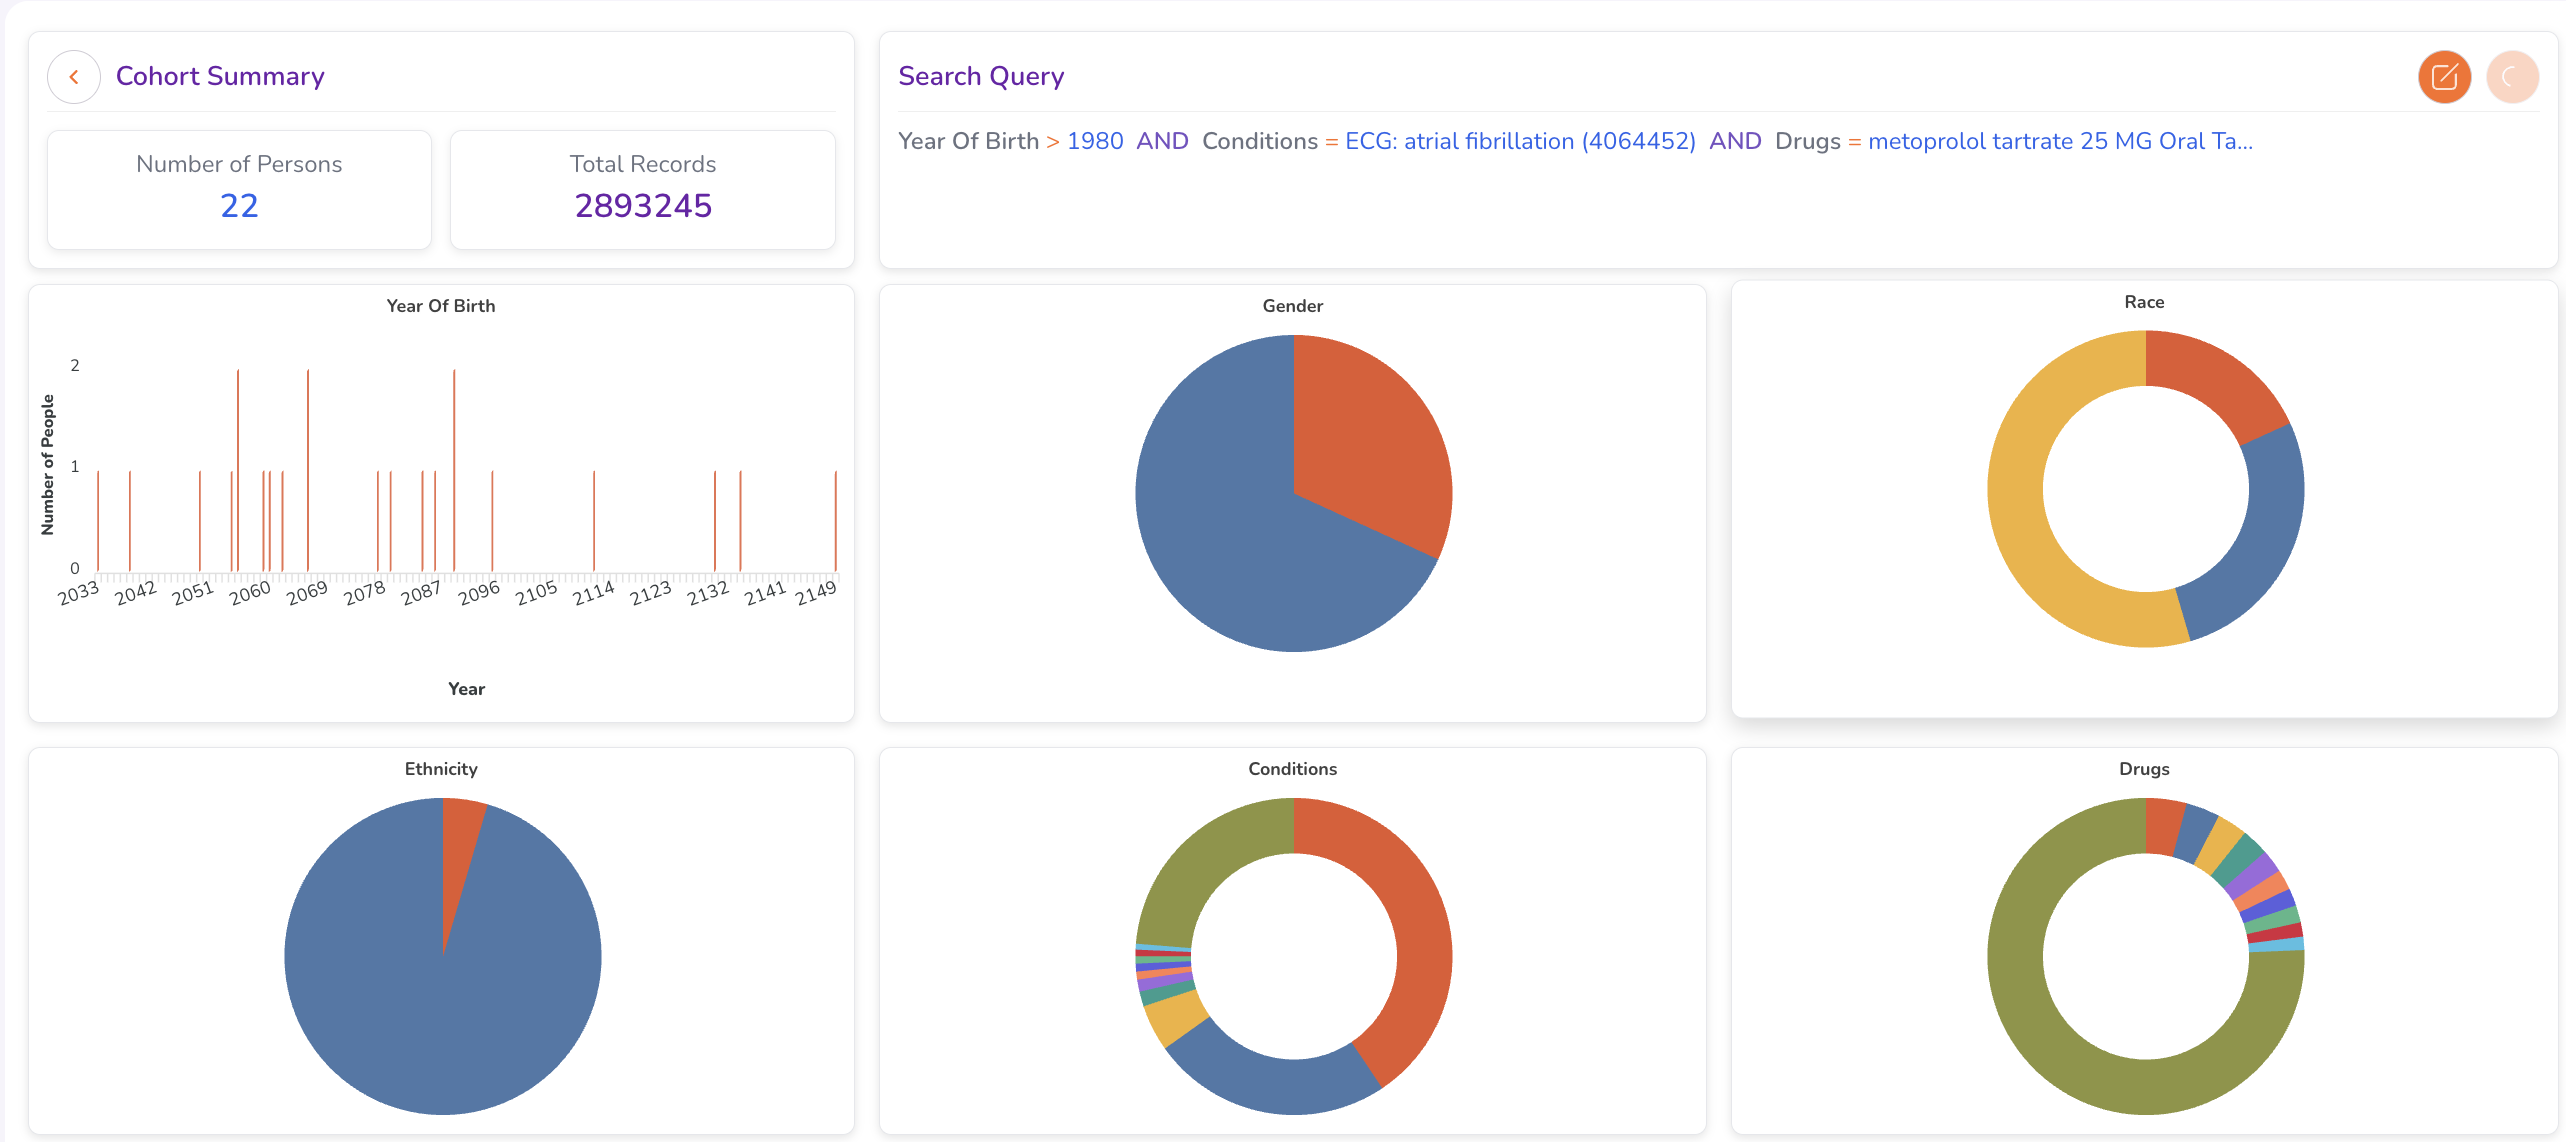
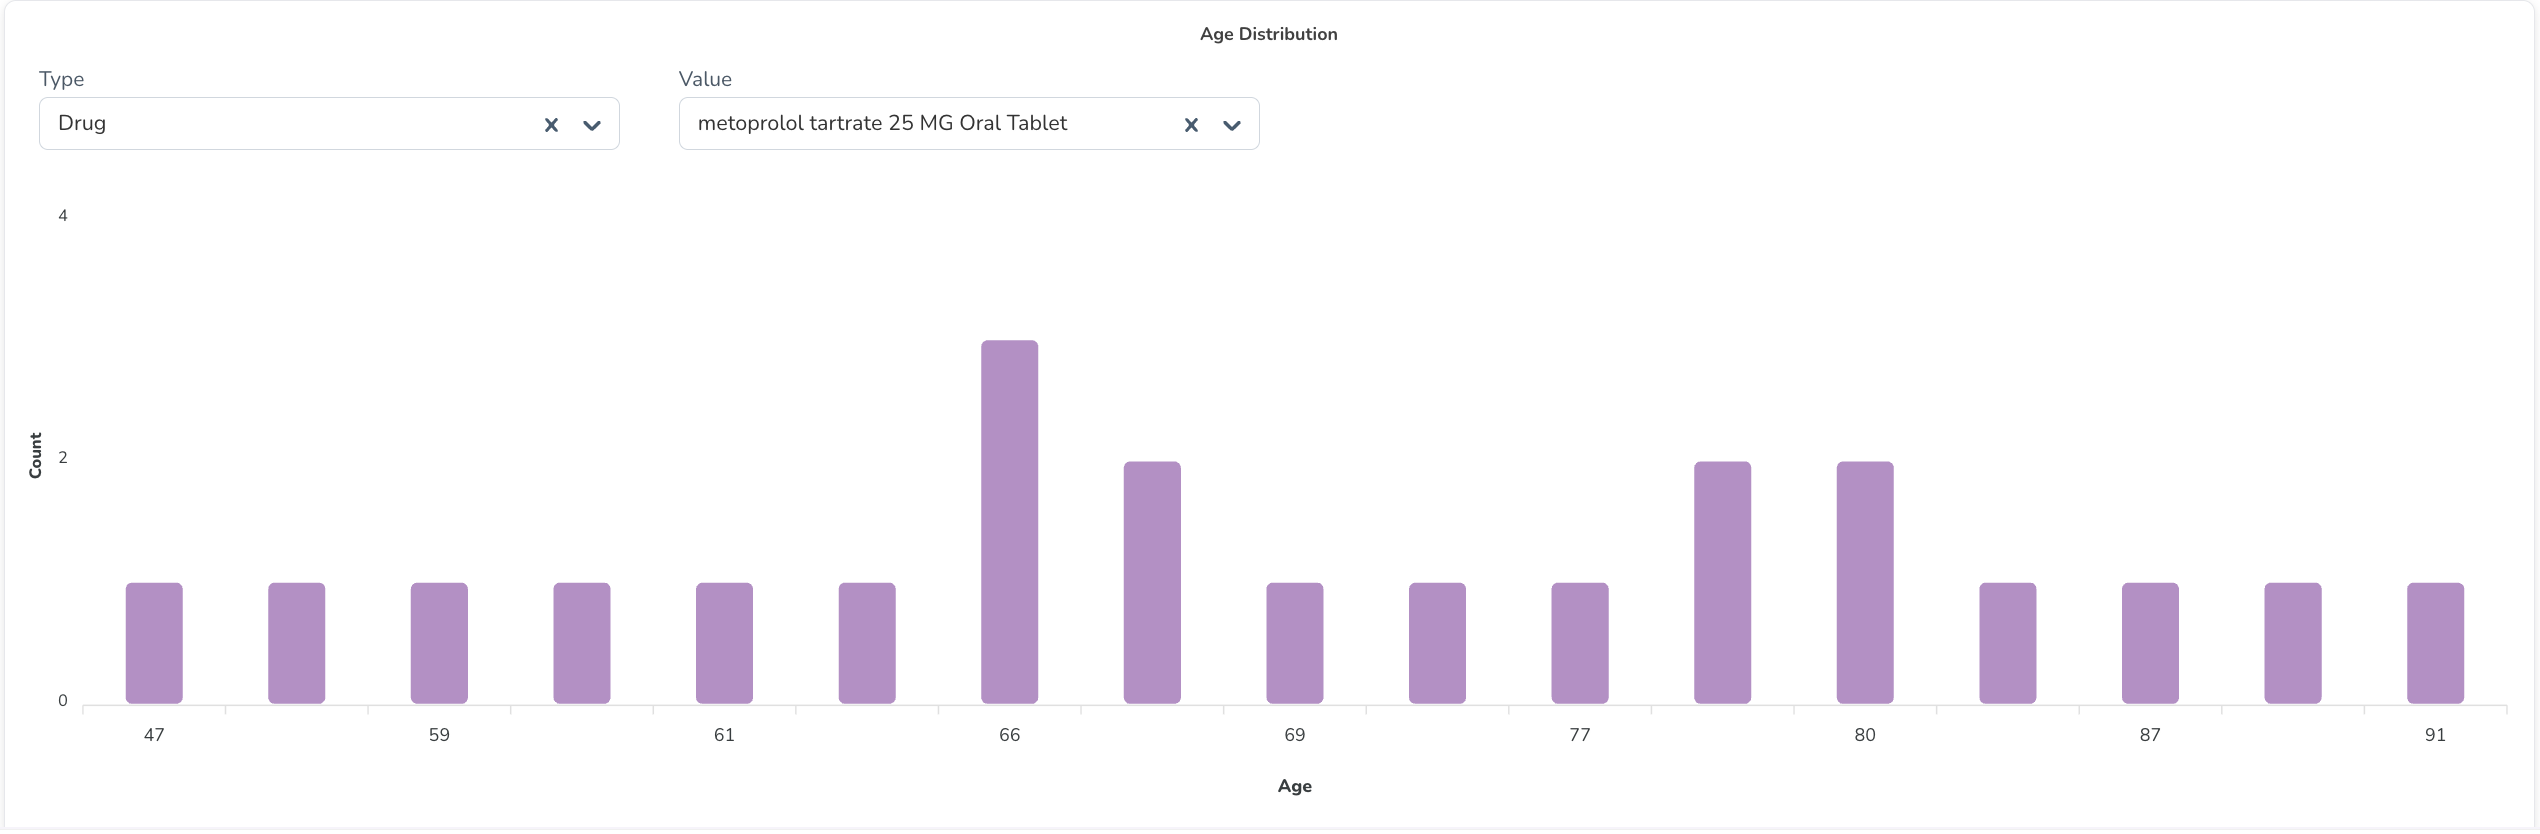
Reviewing Cohort Attributes
The summary dashboard covers:
- Age Distribution — Age distribution of patients in the cohort (recorded at time of first drug administration).
- Gender Distribution — Breakdown by gender.
- Condition Prevalence — Distribution of medical conditions.
- Drug Exposure — Summary of drug prescriptions or exposures.
Refining the Cohort
If the cohort does not yet meet your requirements:
- Click the Modify Query icon next to the search query string at the top of the dashboard.
- Adjust, add, or remove criteria in the Query Builder.
- Click Search to regenerate the summary.
- Review the updated results. Repeat until the cohort size and composition are satisfactory.
Requesting Data Access
All data access on Quark V3 is governed by a formal request and approval workflow. Requests are reviewed and actioned by your DS Administrator.
Types of Access Requests
| Request Type | Description | When to Use |
|---|---|---|
| Dataset Access Request | Grants access to an entire dataset from the Catalog. | When you need to work with all records in a dataset without applying specific filters. |
| Cohort Access Request | Grants access to a defined subset matching your study criteria. | When you have built a cohort using the Query Builder and need access to the resulting de-identified, person-level records. |
Requesting Access to an Entire Dataset
- Select Datasets → navigate to the Catalog tab.
- Click on the dataset you wish to access.
- Click the Request Cohort icon in the top-right corner of the Dataset Summary screen.
- Complete the access request form:
| Field | Description |
|---|---|
| Name | A descriptive name for the request (e.g., Entire_MIMIC). |
| Justification | A clear explanation of why you need access to the entire dataset. |
| Tags | Optional key-value tags for easy retrieval (e.g., Key: Condition, Value: AFib). |
- Click Submit.
The request is now submitted to your DS Administrator for review.
Requesting Access to Additional Datasets
Repeat the process above for each additional dataset: navigate to the Catalog tab, open the target dataset, click Request Cohort (or Save Cohort), enter a name, and submit.
Requesting Access to a Cohort
After building and validating a cohort using the Query Builder:
- From the Cohort Summary dashboard, click the Request Cohort icon in the top-right corner.
![]()
- Complete the access request form:
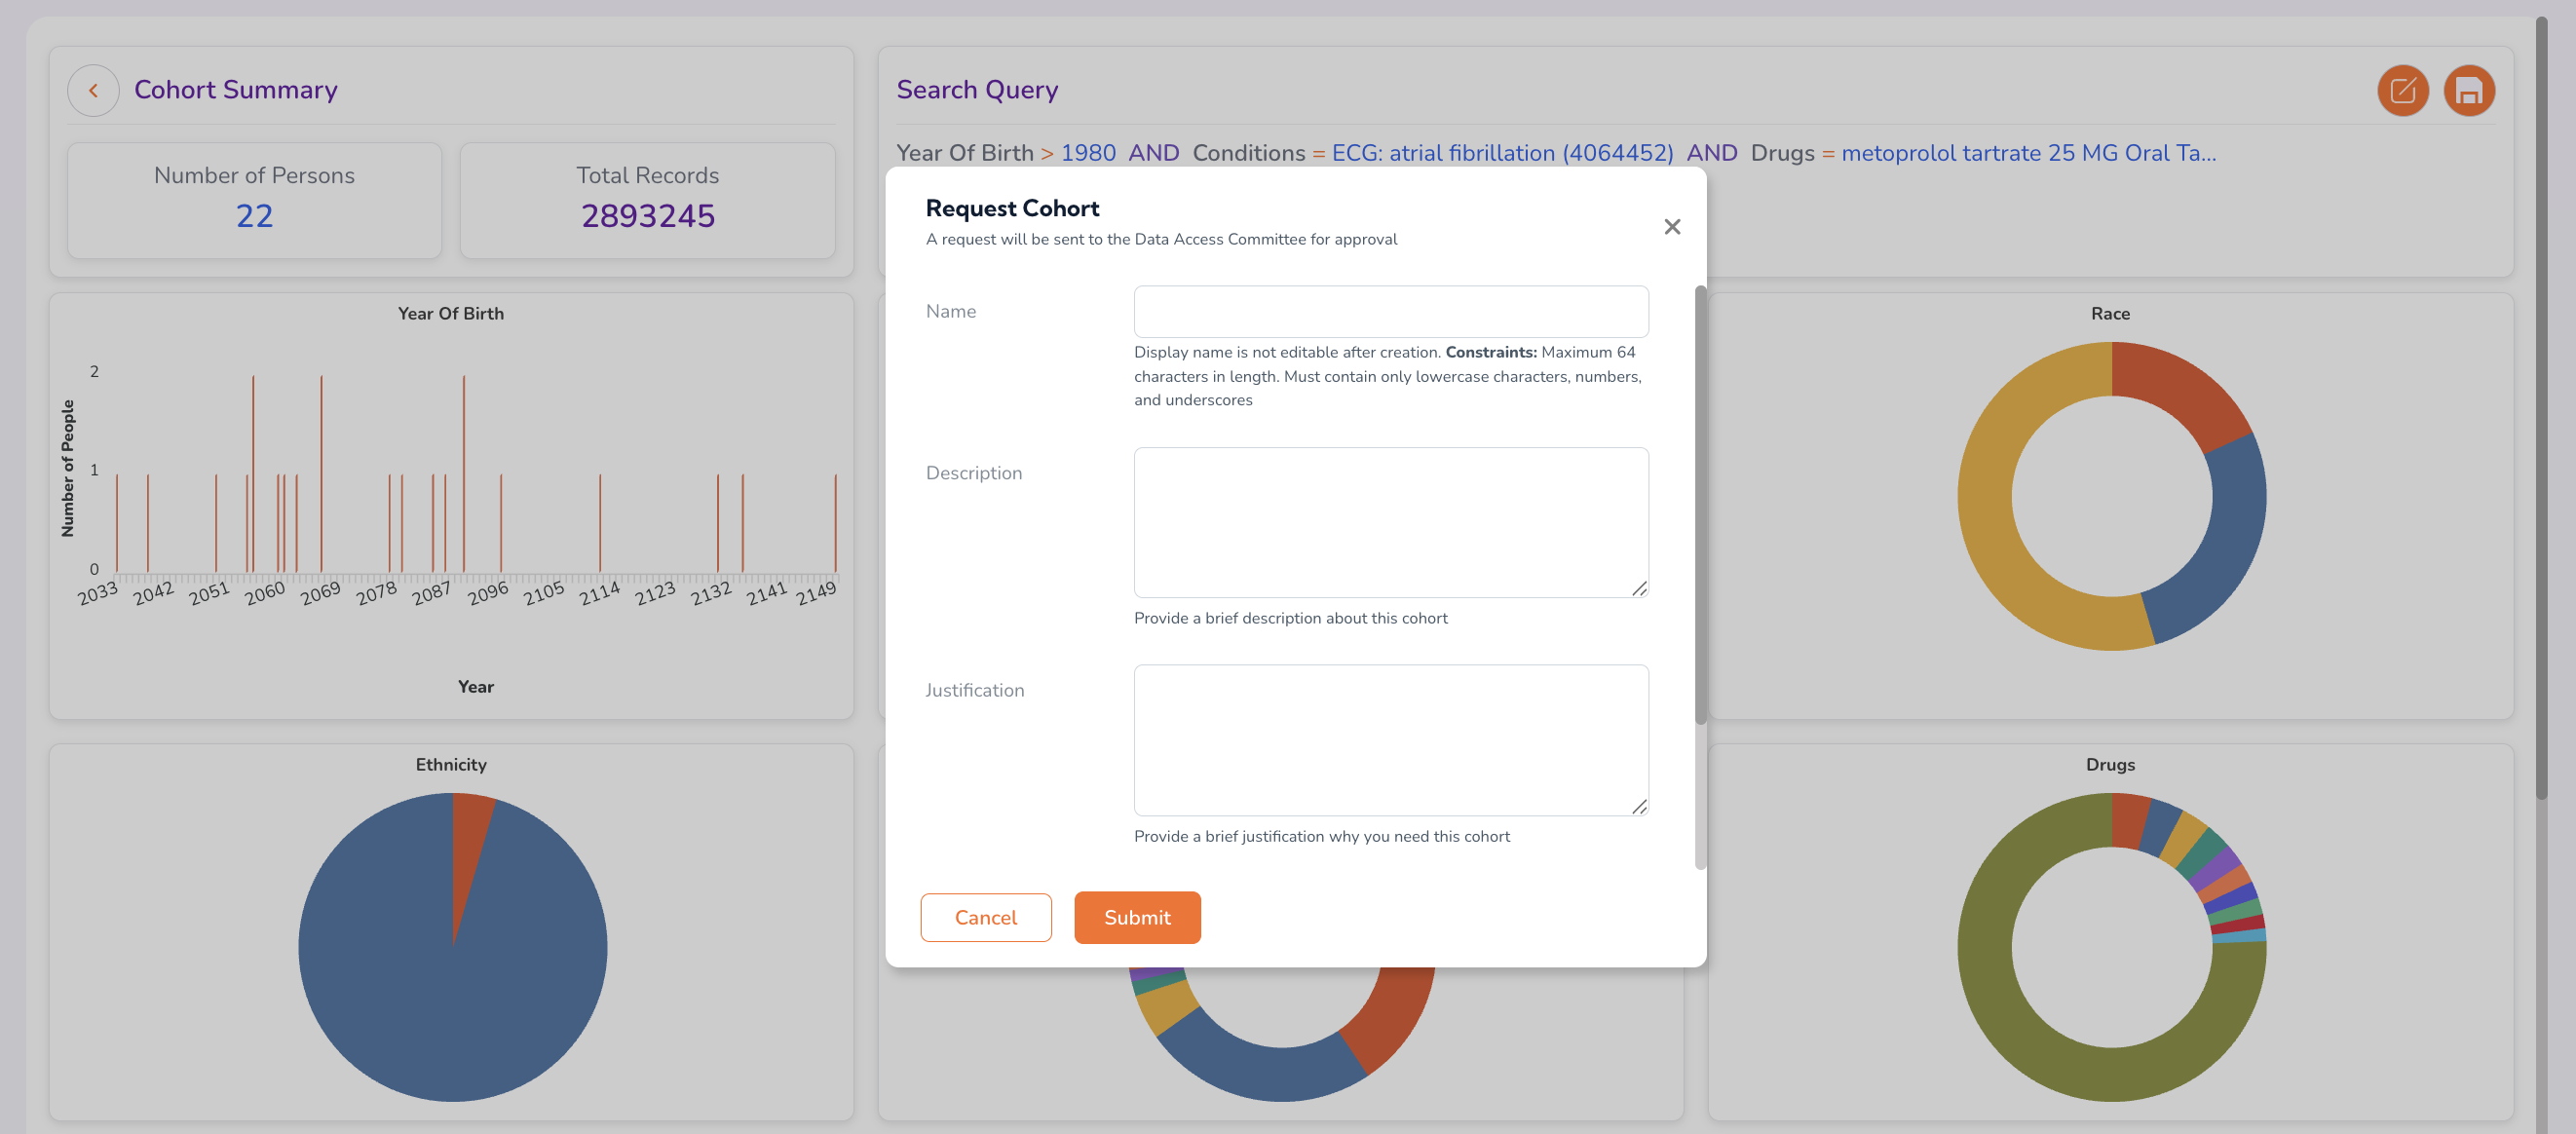
| Field | Description |
|---|---|
| Name | A descriptive name for the cohort (e.g., AFib_metoprolol_cohort). |
| Description | A brief summary of the cohort's composition. |
| Justification | The research justification for requesting access to this cohort. |
| Tags | Key-value tags for searchability. Click Add New and enter a Key and Value for each tag. |
- Review all entries for accuracy, then click Submit.
Tracking the Status of Your Requests
After submitting an access request, monitor its status from the Cohorts tab:
- Select Datasets → navigate to the Cohorts tab.
- Your submitted requests are listed with their current status.
| Status | Description |
|---|---|
| Pending Approval | The request has been submitted and is awaiting review by your DS Administrator. |
| Approved | The request has been approved. You now have access to the dataset or cohort. |
| Rejected | The request has been declined. Contact your DS Administrator for details. |
Click the Refresh icon in the top-right corner of the Cohorts screen to check for status updates.
For a consolidated view of all your pending and resolved requests — including workstation provisioning, file uploads, and file downloads — navigate to My Requests in the left-hand navigation pane.
What Happens After Approval
Approved Dataset and Cohort Dashboards
Once your request is approved, the dataset or cohort will appear under the Cohorts tab with an Approved status.
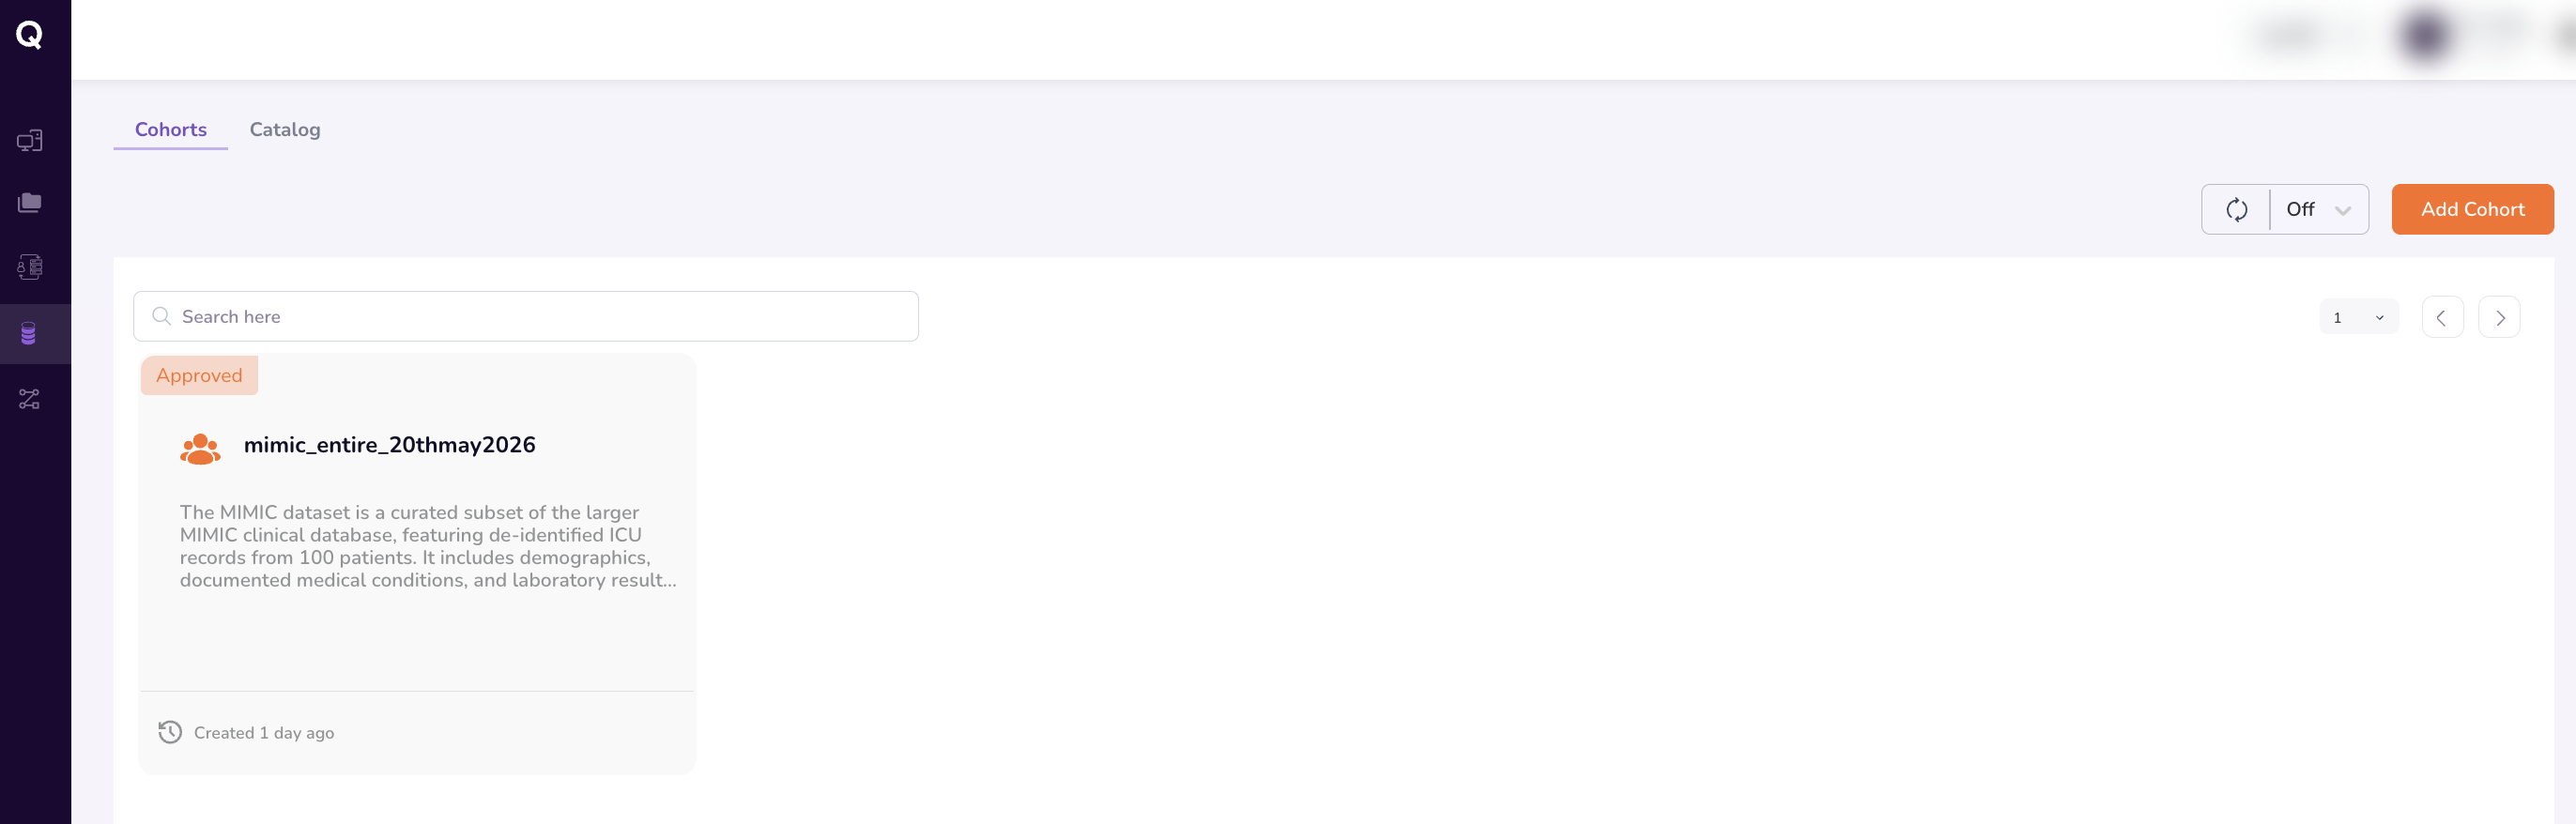
Clicking it opens the full Cohort Dashboard, which includes:
- Aggregate statistics and distribution visualisations.
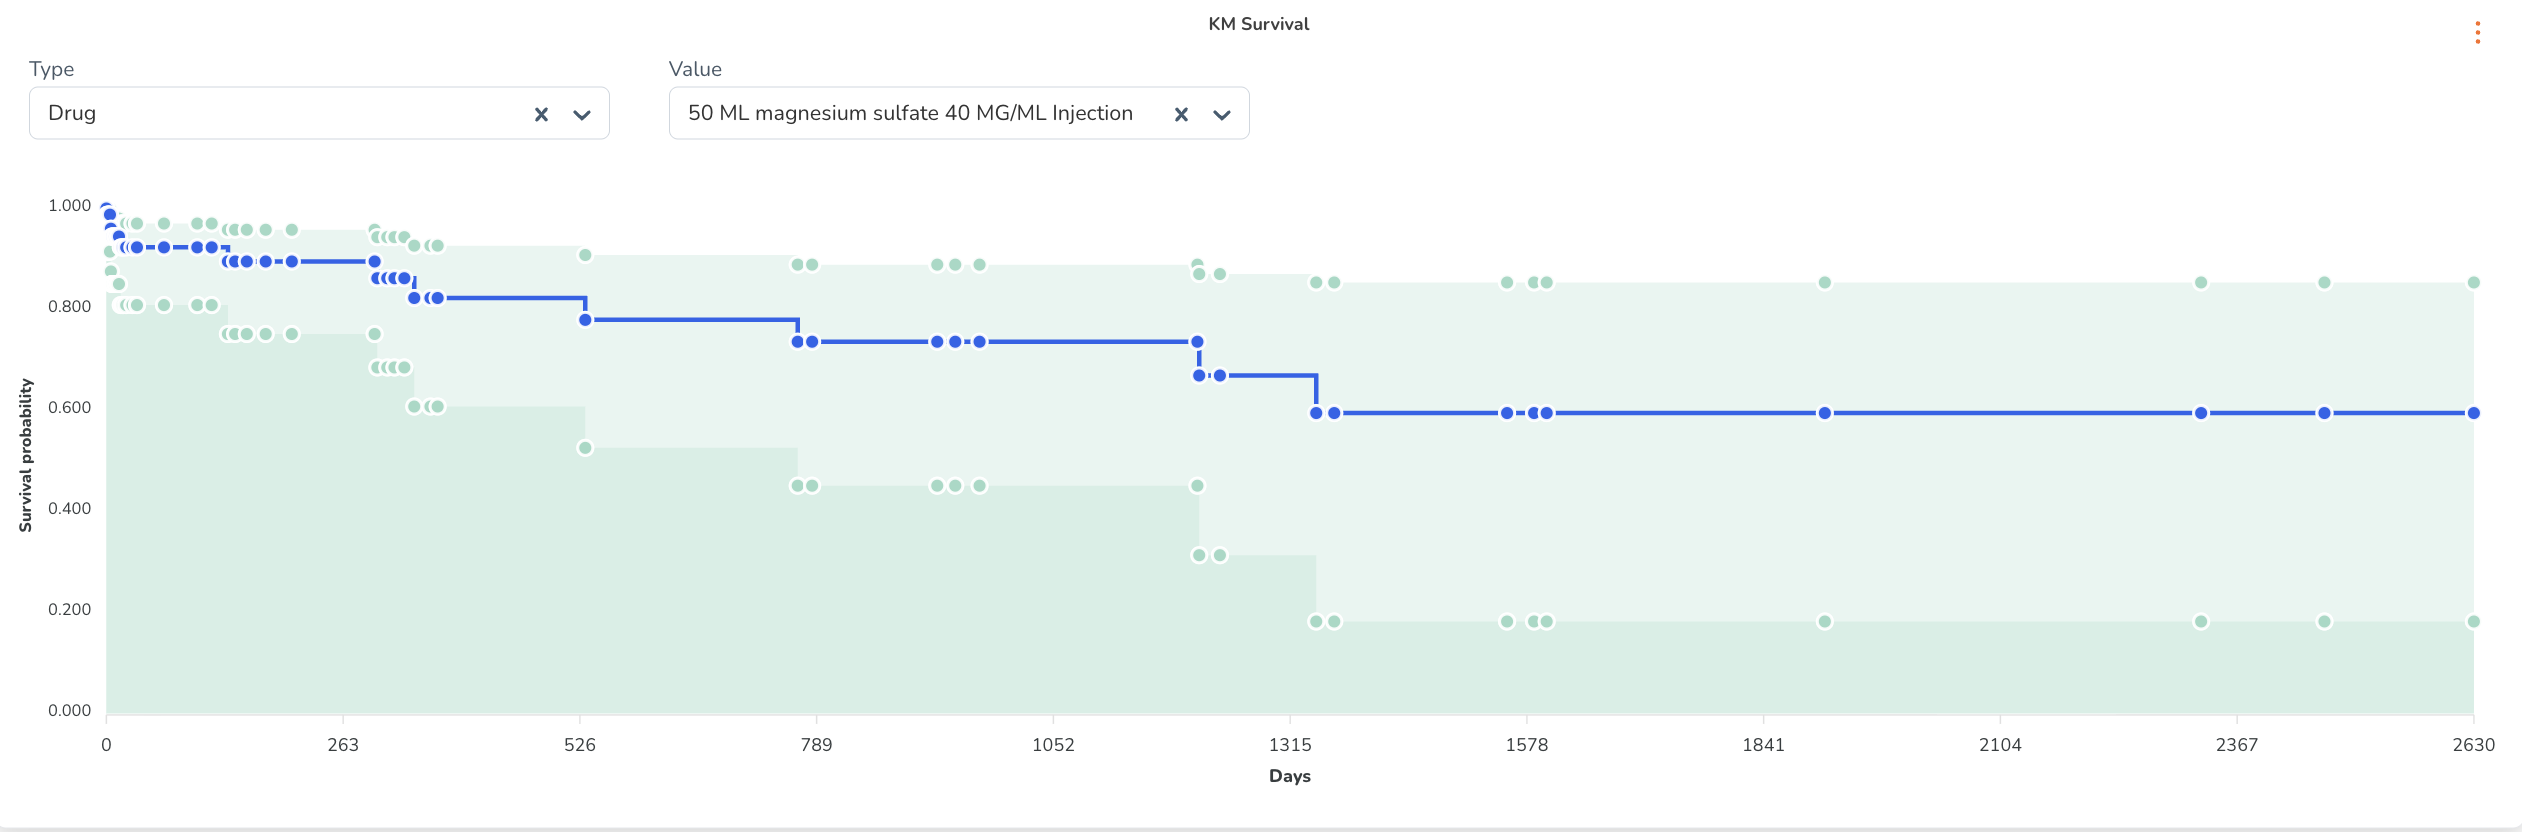
- A Kaplan-Meier Survival Curve — displayed when scrolling down within the dashboard, providing survival analysis insights for the cohort population.
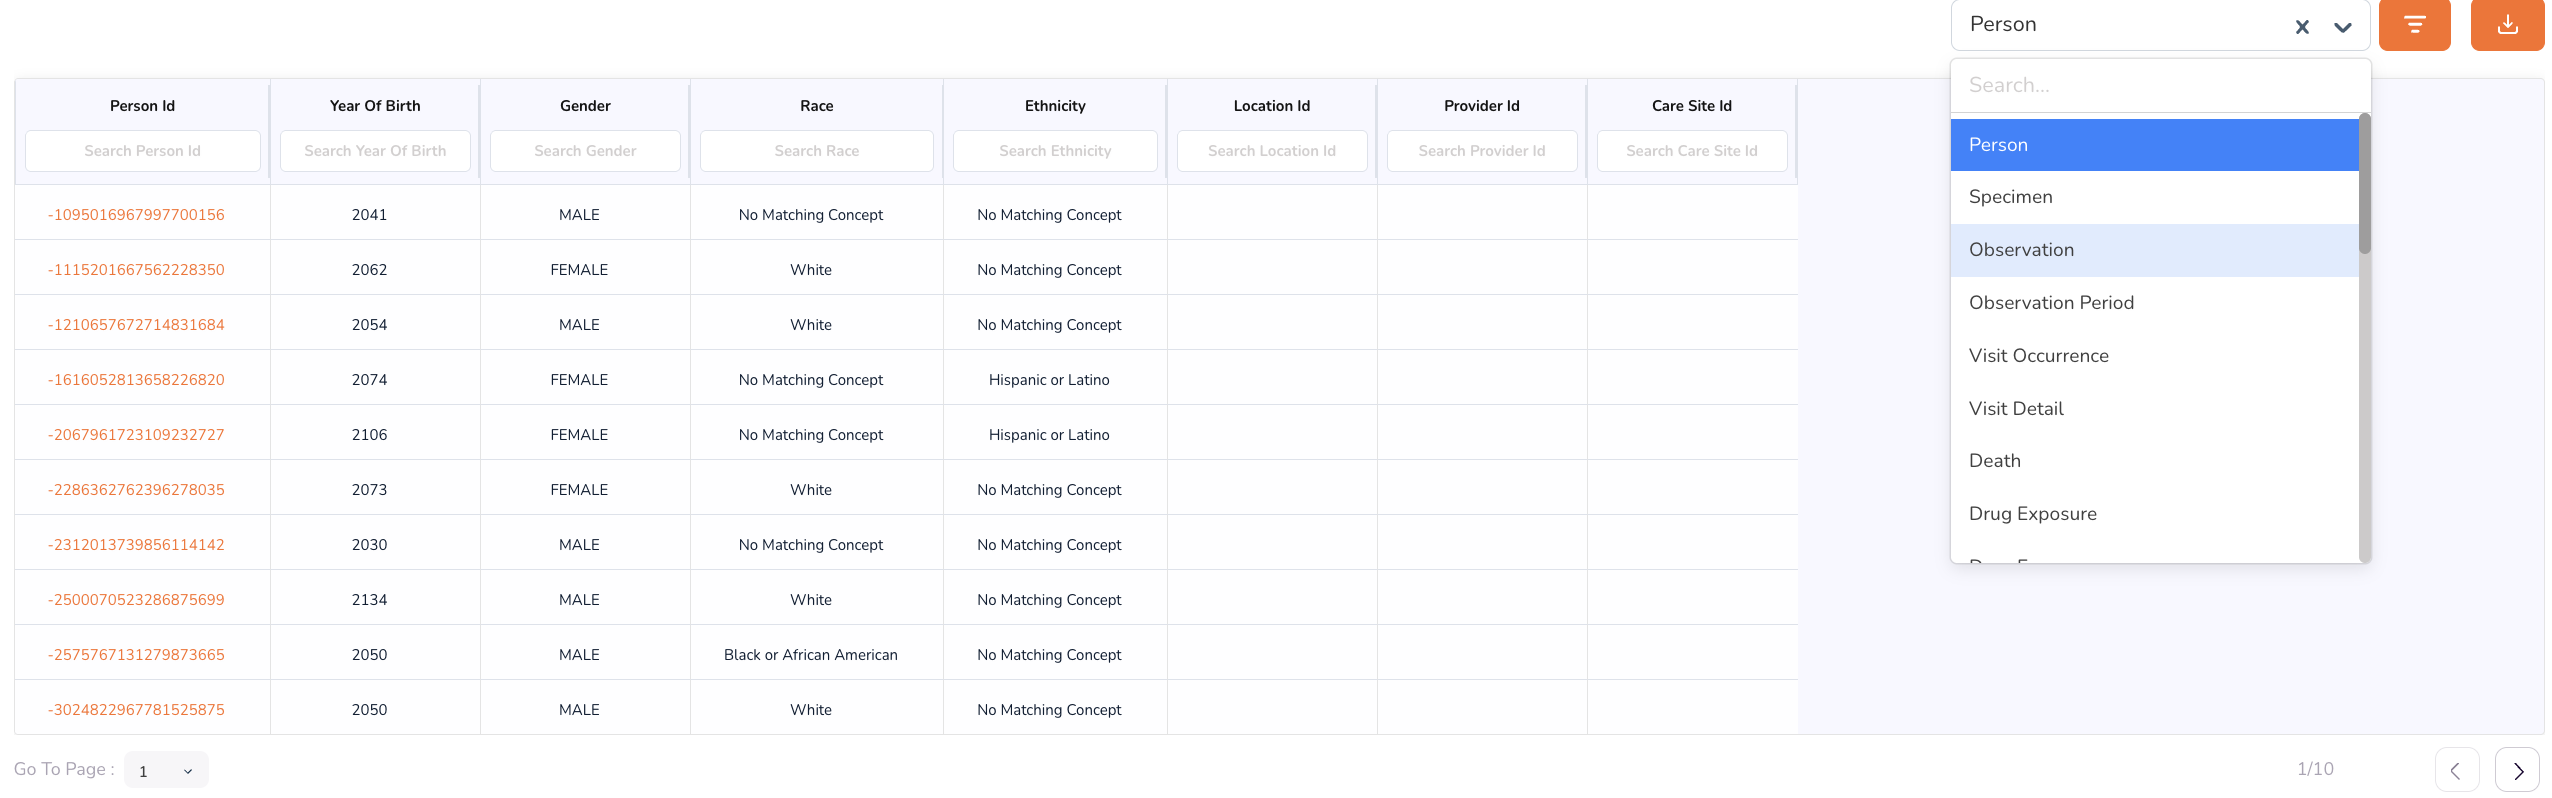
- A Person Table — anonymised person-level records, searchable by Person ID.
- A Specimen Table — specimen-level records. Switch to this view using the drop-down in the top-right corner of the table area.
Approved cohorts are also available as direct inputs to pipeline runs — select a cohort from the Cohorts tab when configuring pipeline parameters.
Person Dashboard
To drill into the record of an individual patient:
- Open the Person Table within the Cohort Dashboard.
- Type a Person ID into the search field.
- Click the Person ID to open the Person Dashboard.
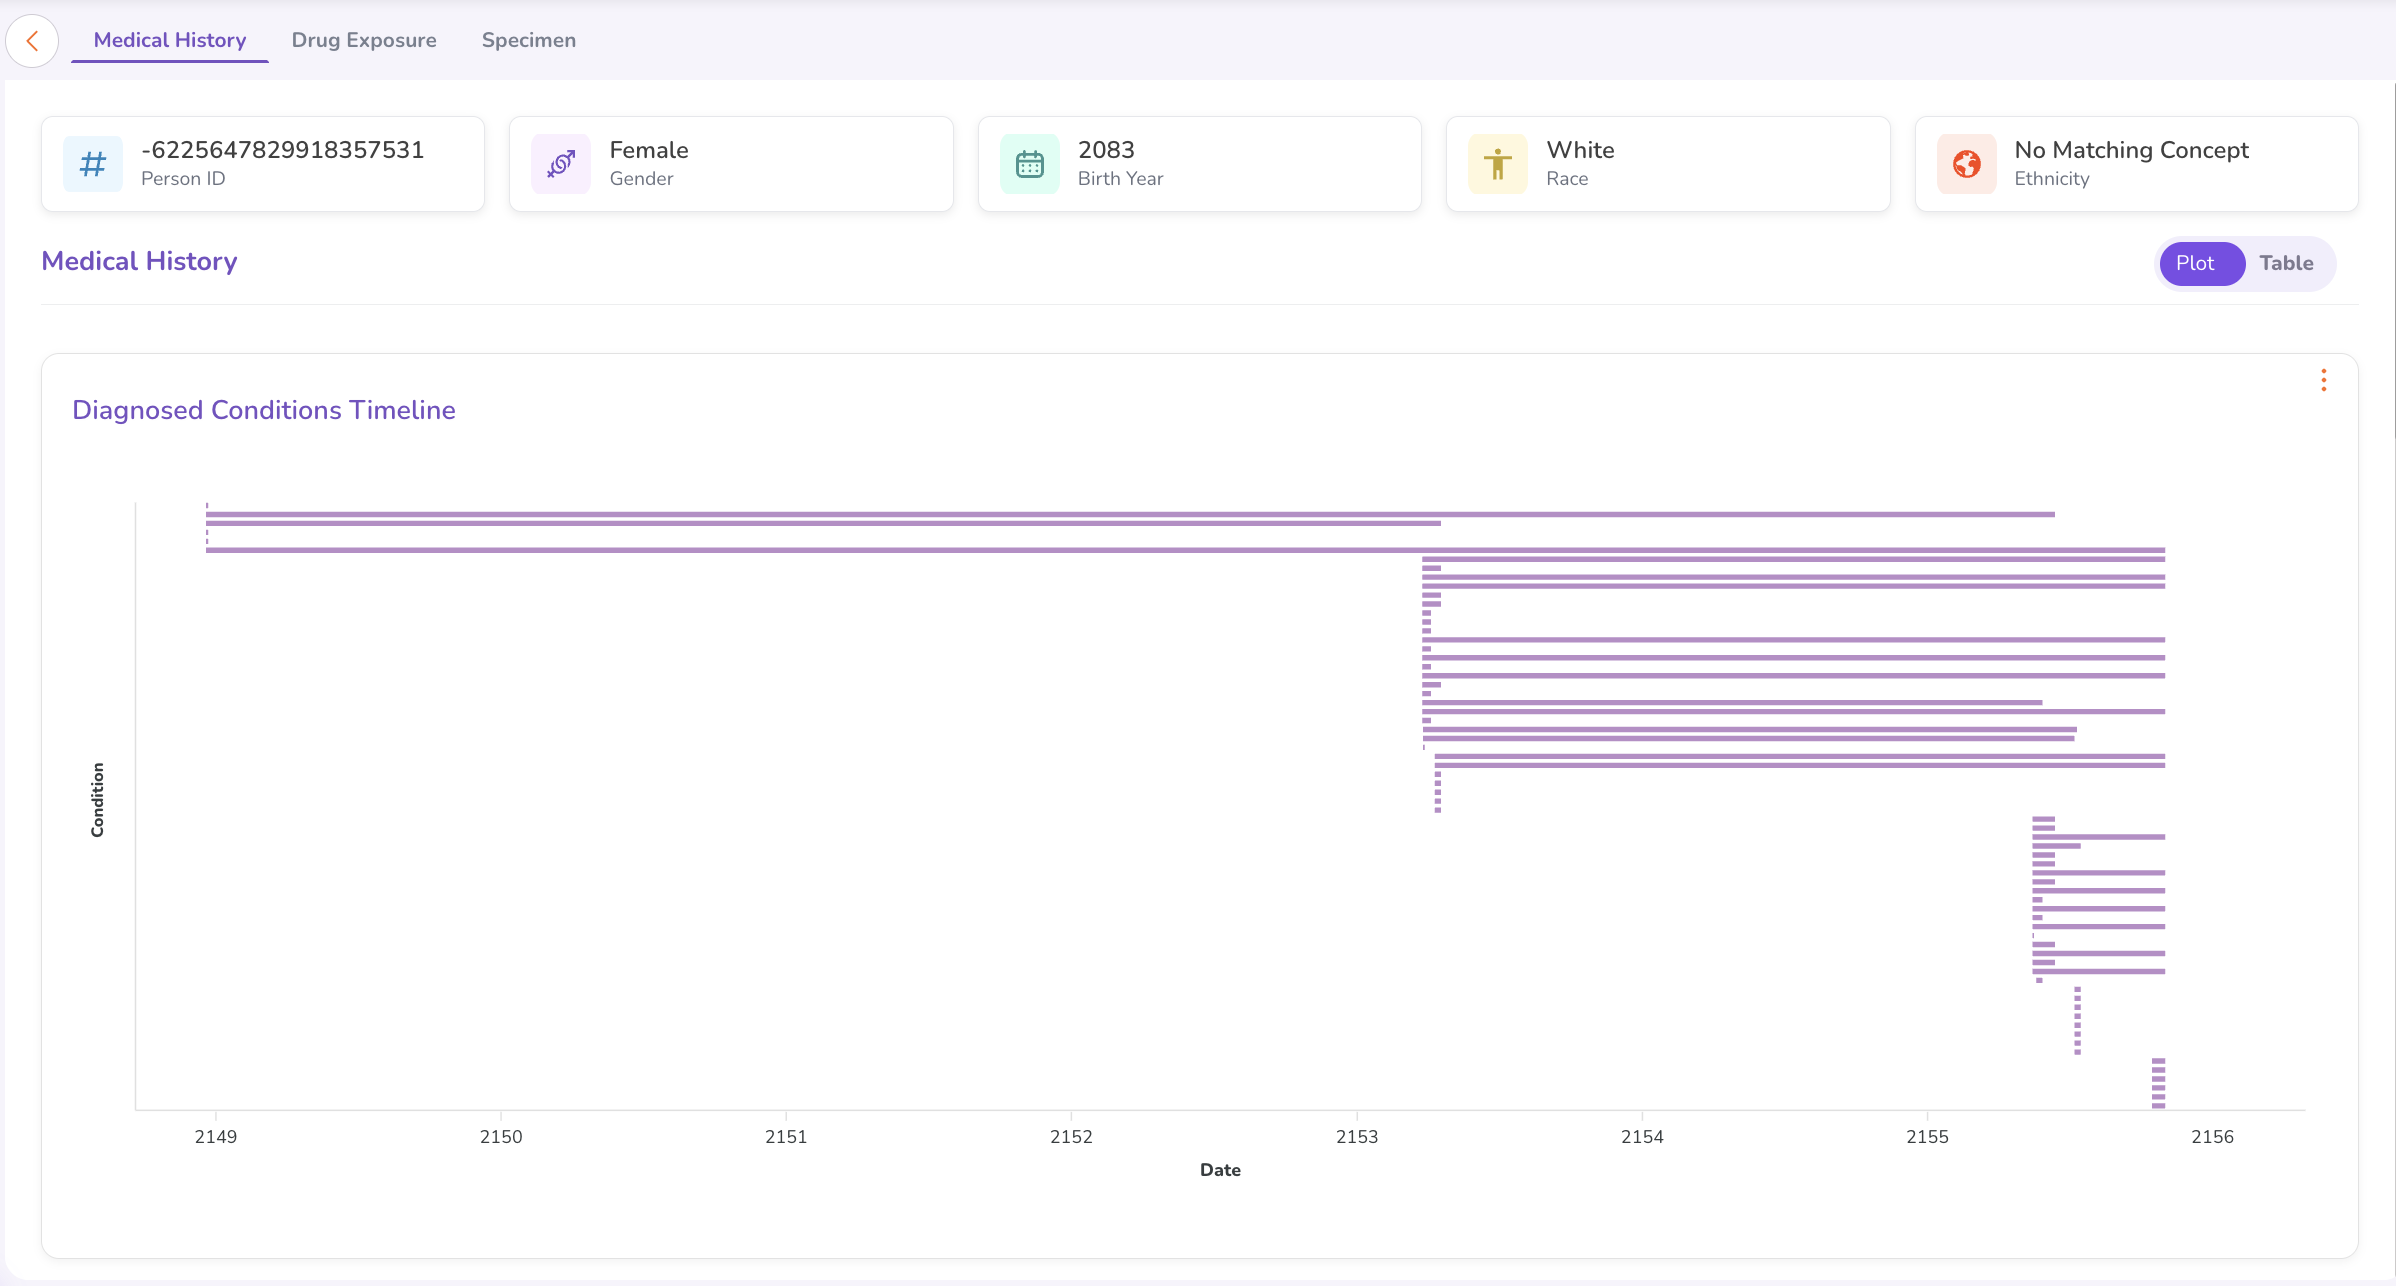
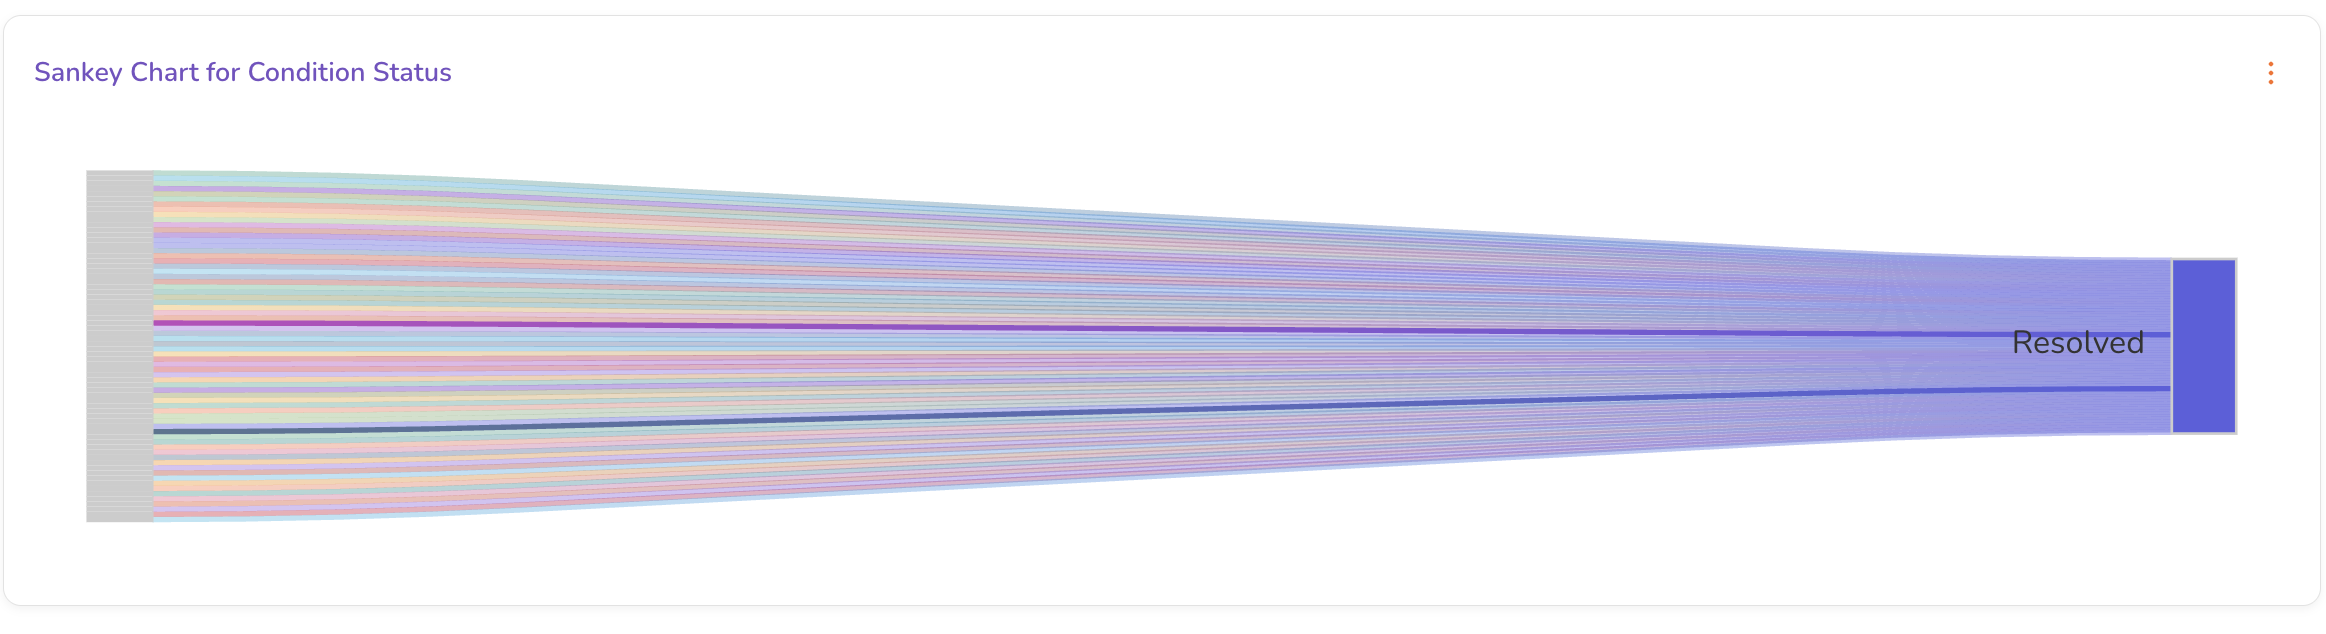
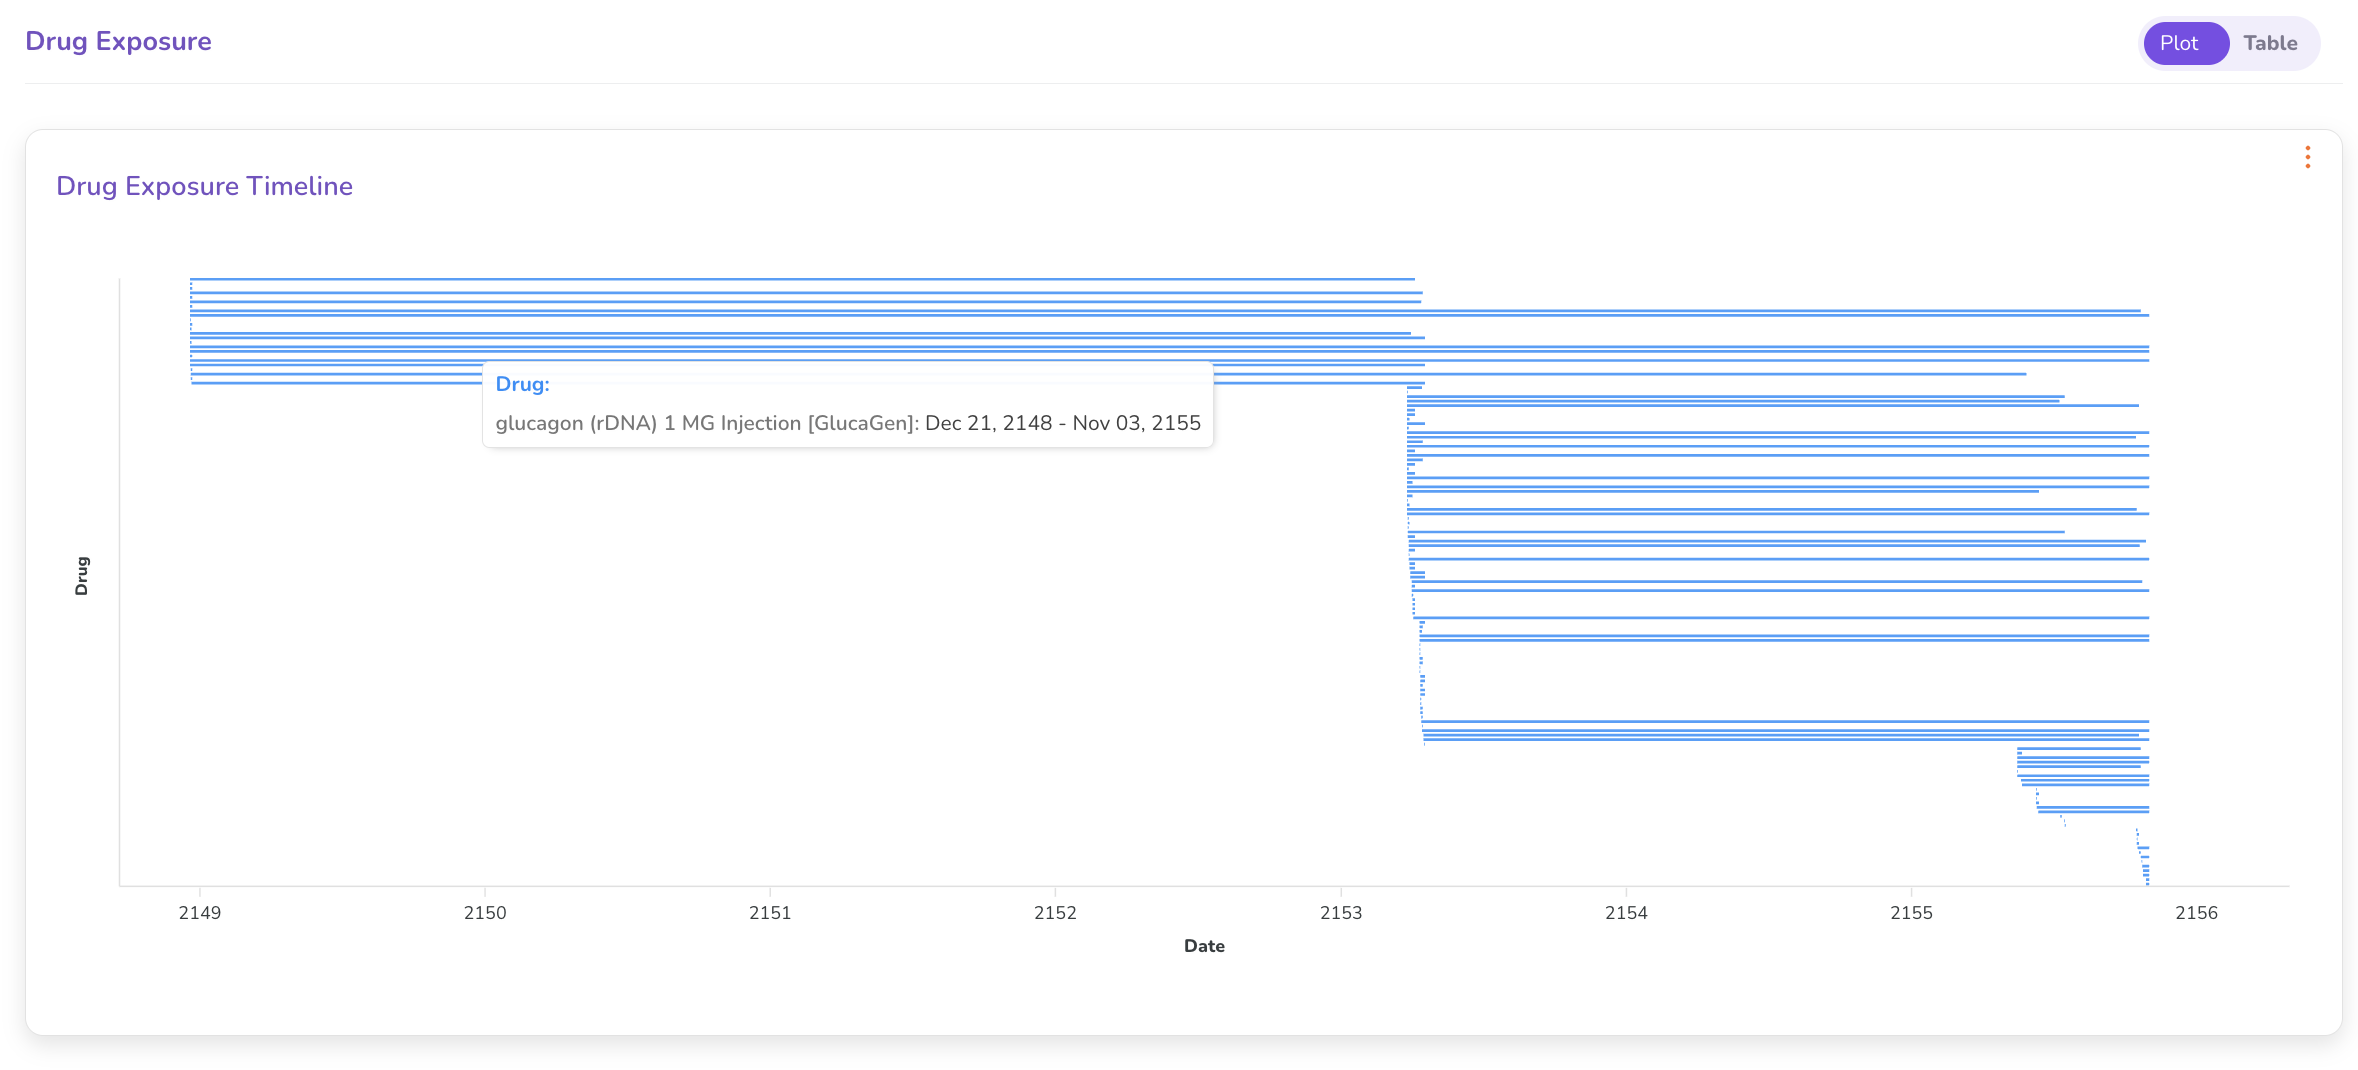
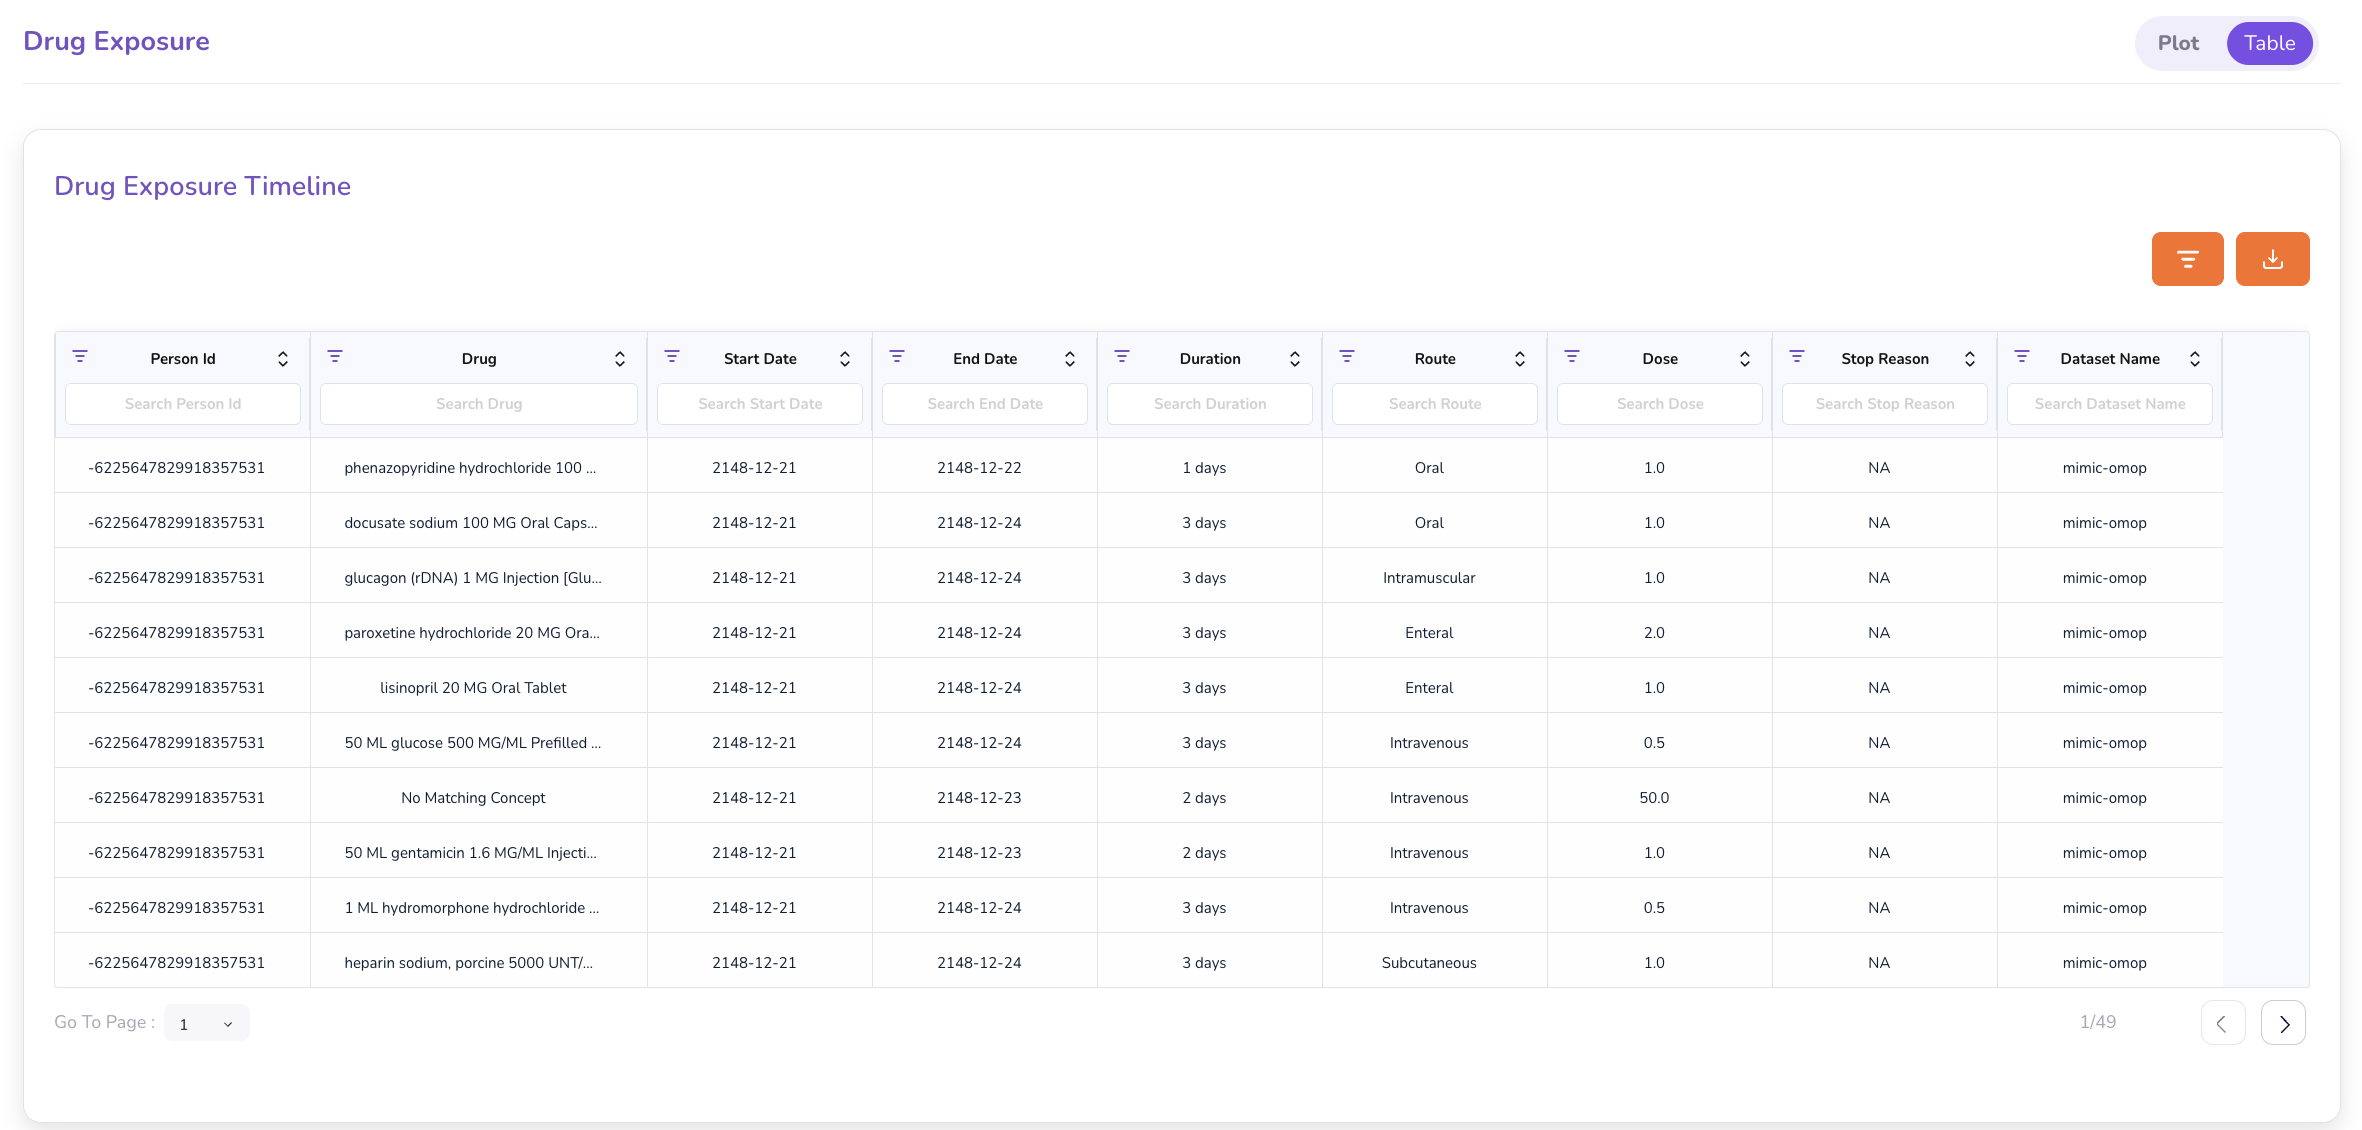
The Person Dashboard includes:
- Medical History — Anonymised medical history with a Sankey Chart visualising the progression of conditions and treatments over time.
- Drug Exposure — Toggle between a Plot View (graphical timeline) and Table View (tabular listing with drug name, start date, and end date).
- Specimen tab — A summary of genomic variants found in the patient's sample.
Specimen Dashboard
To explore genomic variant data for a specific specimen:
- In the Cohort Dashboard, switch the table view to Specimen using the drop-down.
- Type a Specimen ID into the search field.
- Click the Specimen ID to open the Specimen Dashboard.
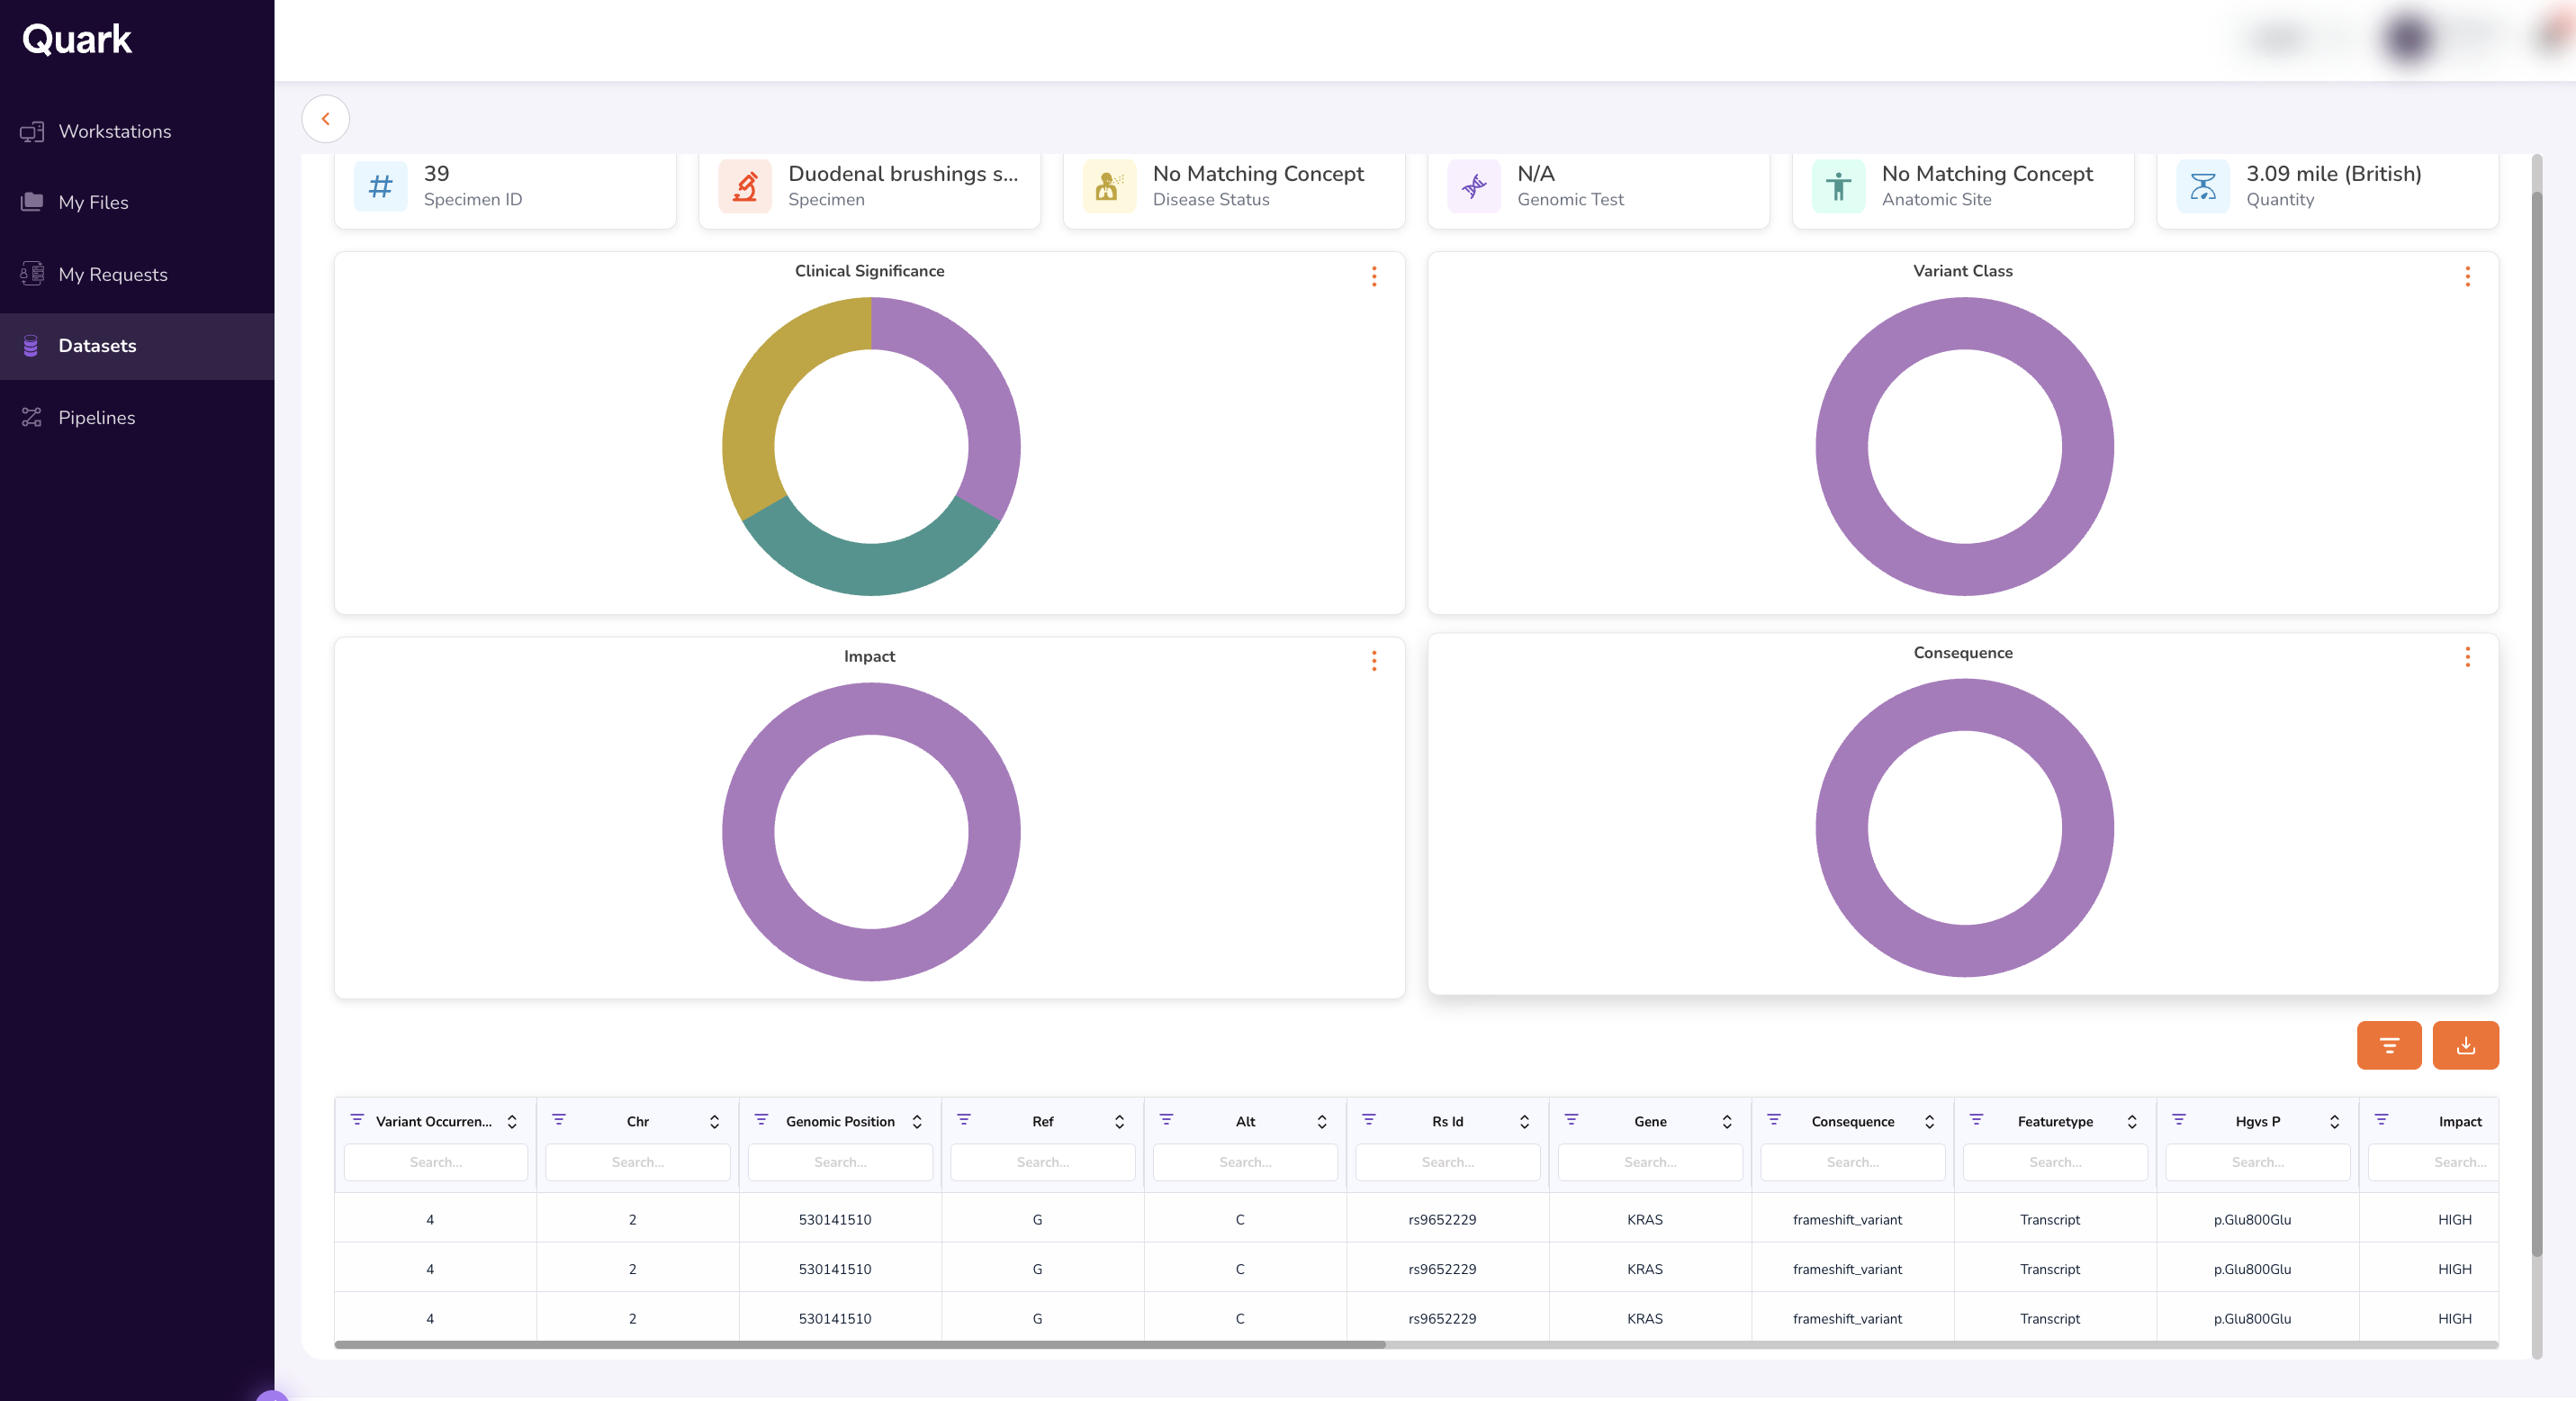
The Specimen Dashboard provides:
- Clinical Significance — Classification of variant clinical significance.
- Variant Class — Types of variants identified (e.g., SNP, insertion, deletion).
- Impact — Predicted functional impact of each variant.
- Consequence — Consequence type for each variant (e.g., missense, synonymous).
- Variant Occurrence Table — A detailed table of all variants, including genomic coordinates, allele frequencies, and annotation details.
What's Next
- Workstations — Set up a workstation to begin analysis against your approved cohort data.
- Pipelines — Use an approved cohort directly as a pipeline input from the Cohorts tab.
- My Requests — Track the status of all your access and resource requests in one place.