TRE Administrator Guide
This section guides TRE Administrators through various responsibilities that were introduced in the TRE Administrator Role Overview section.
Workstations
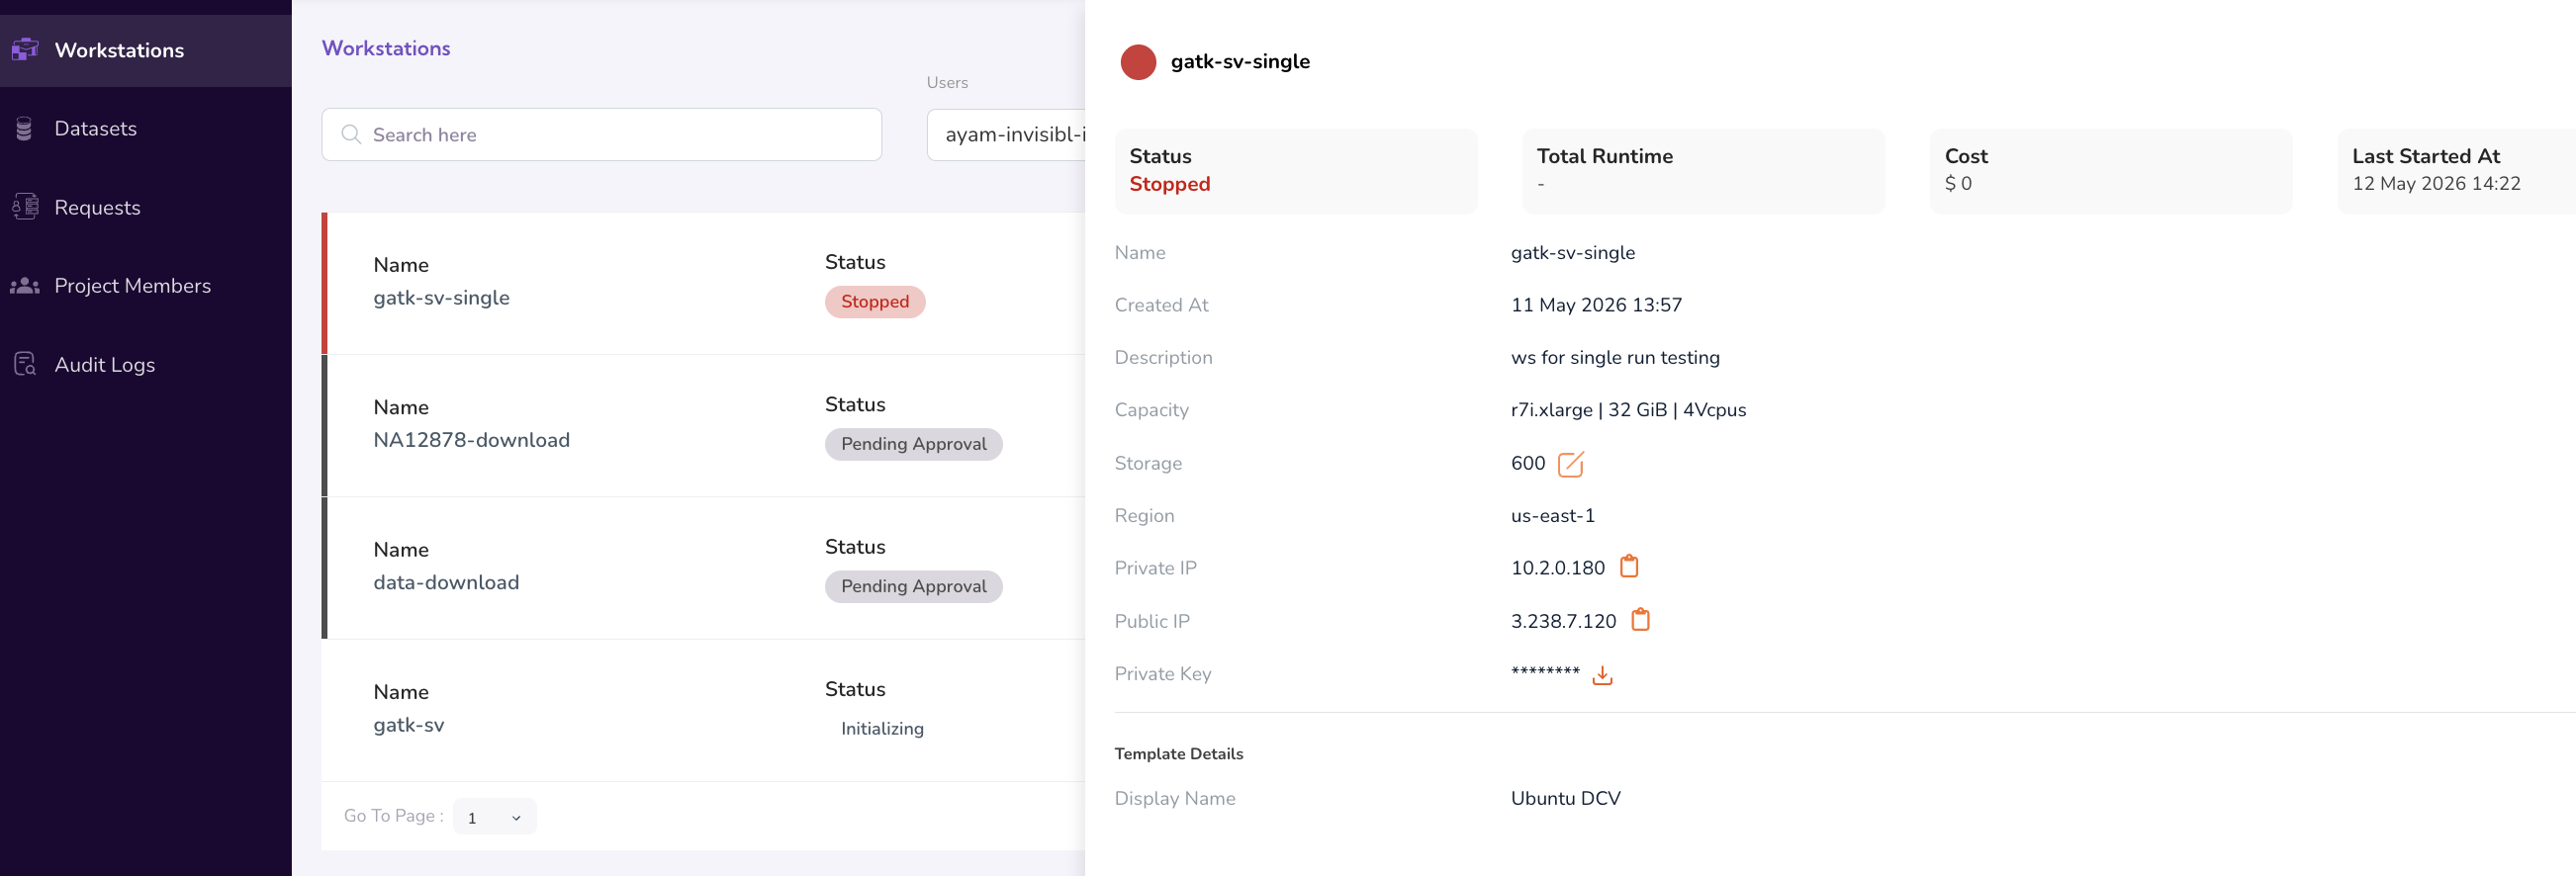
The Workstations dashboard gives you a real-time view of every workstation provisioned in the TRE, regardless of which project or user it belongs to. Use this view to spot idle workstations driving unnecessary cost, identify users hitting capacity limits, and confirm that workstations are running on the expected templates and computes.
Viewing Workstations
- Navigate to Workstations in the left-hand Navigation Menu. The dashboard lists all workstations along with their owner, status (Running, Stopped, Provisioning, etc.), associated project, template, uptime, and accrued cost.
- Use the User filters and search bar at the top of the dashboard to narrow the list by Status, Type, or Created At.
-
Click any workstation row to drill into its detail view, where you can review:
- Status history — A timeline of state transitions (running → stopped → terminated).
- Resource usage — CPU, memory, and storage consumption over time.
- Cost — Compute and storage charges accrued over the workstation's lifetime.
Additional Notes for Workstations
- The TRE Administrator role provides monitoring access — provisioning and template management remain with the TRE Infrastructure Administrator.
- Cost figures may lag real-time depending on the provider.
Datasets
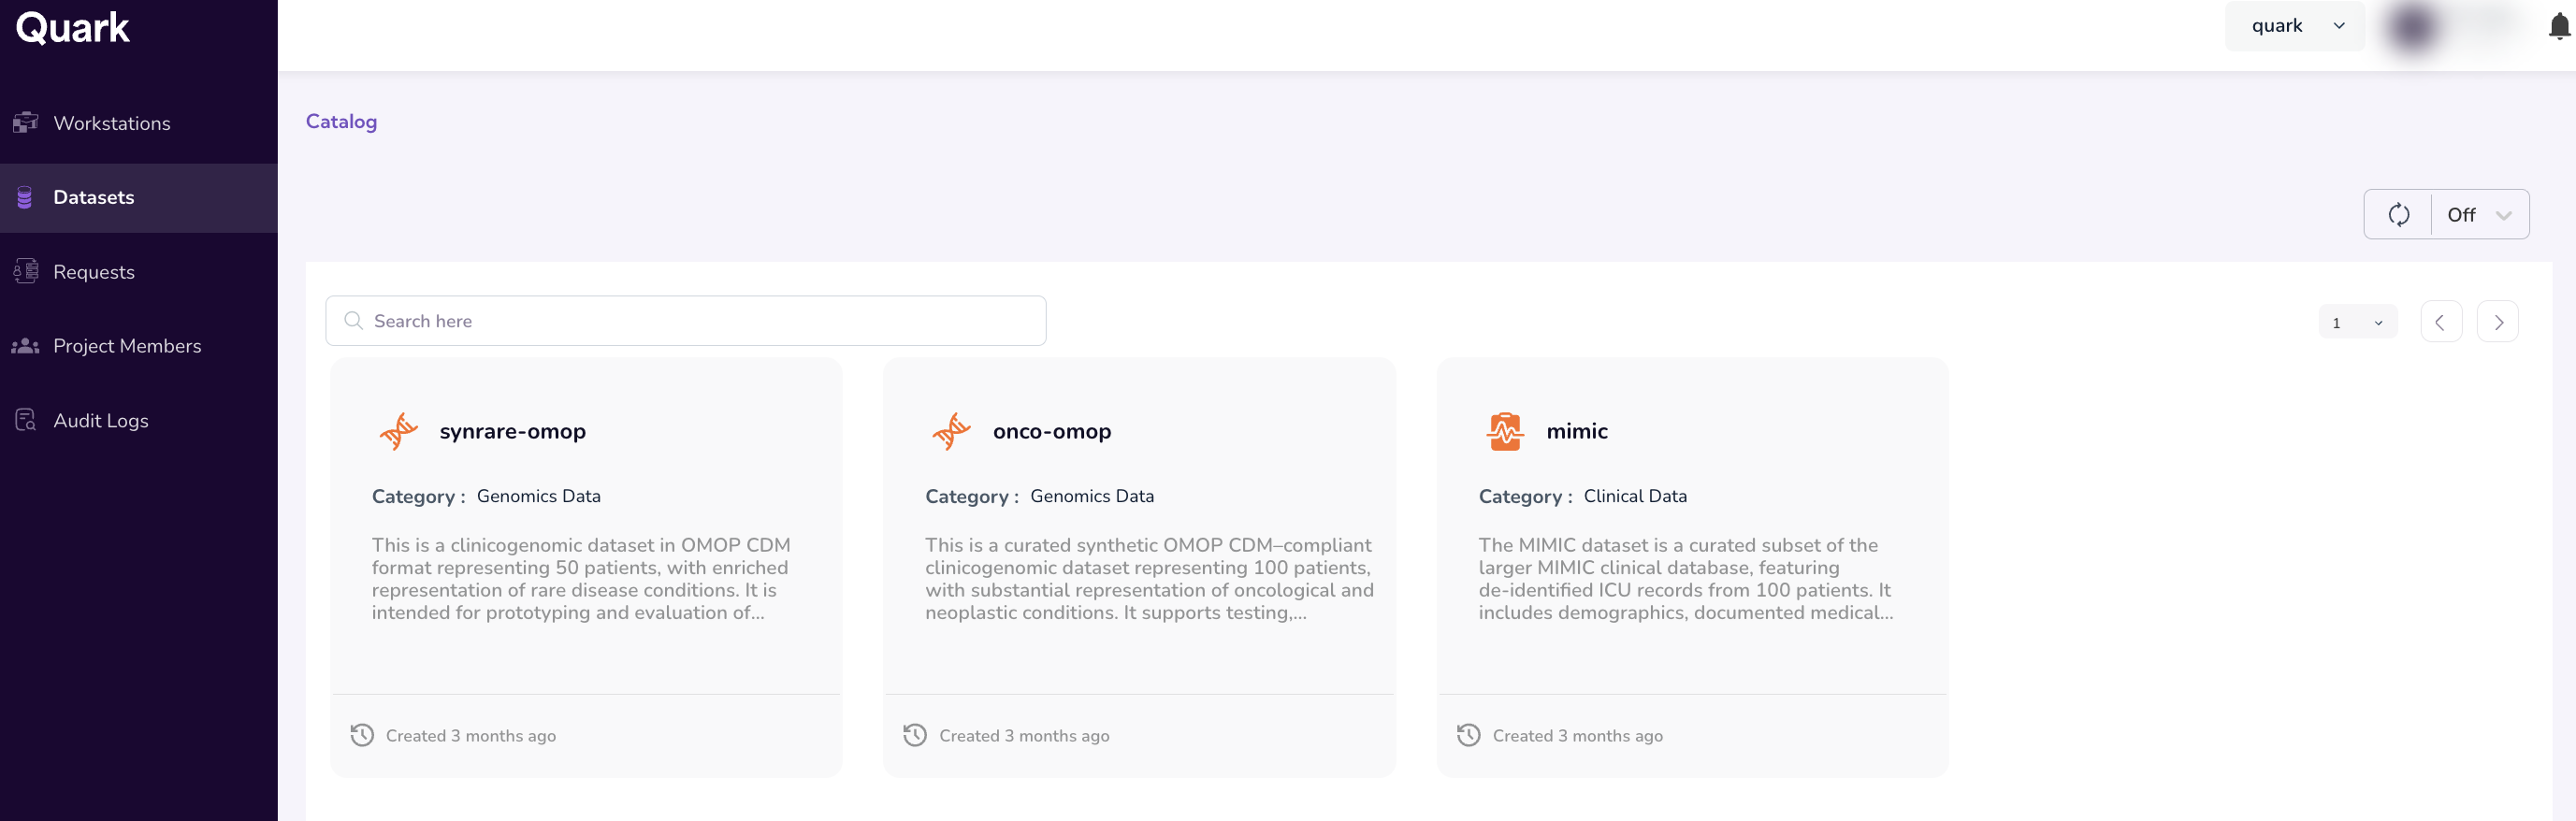
The Datasets view allows you to see the full catalog of datasets published to the TRE by the TRE Infrastructure Administrator. As a TRE Administrator, you use this view to understand what data is available when reviewing access requests — not to publish or modify the datasets themselves.
Viewing Datasets
-
Navigate to Datasets in the left-hand Navigation Menu.
The dashboard lists every published dataset along with its summary, tags, cloud account, and assigned Data Access Committee.
-
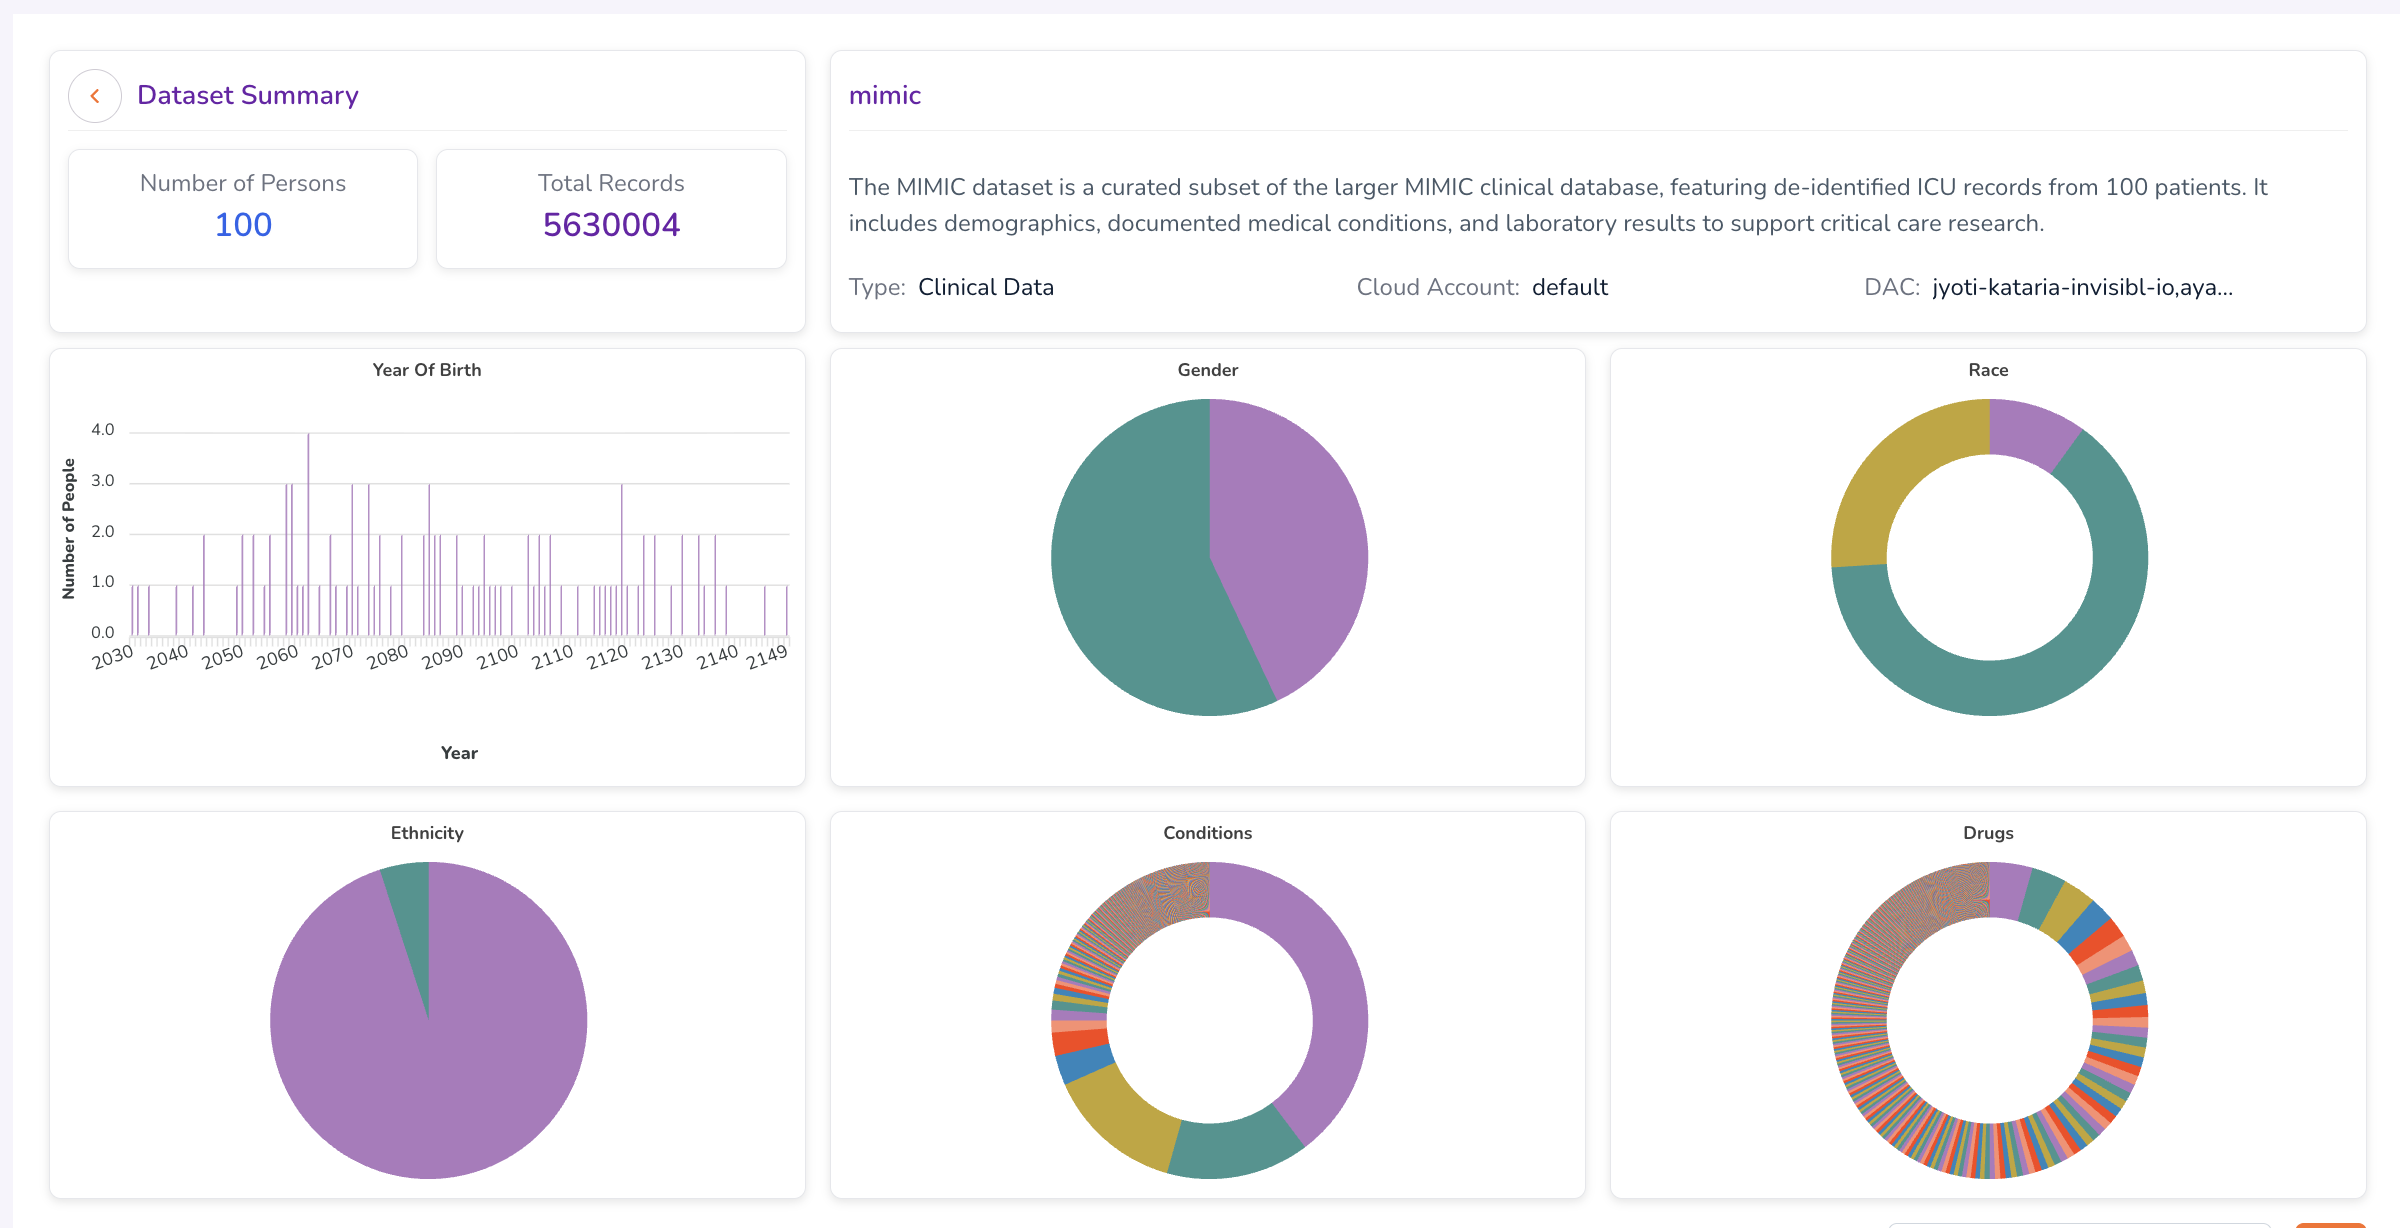
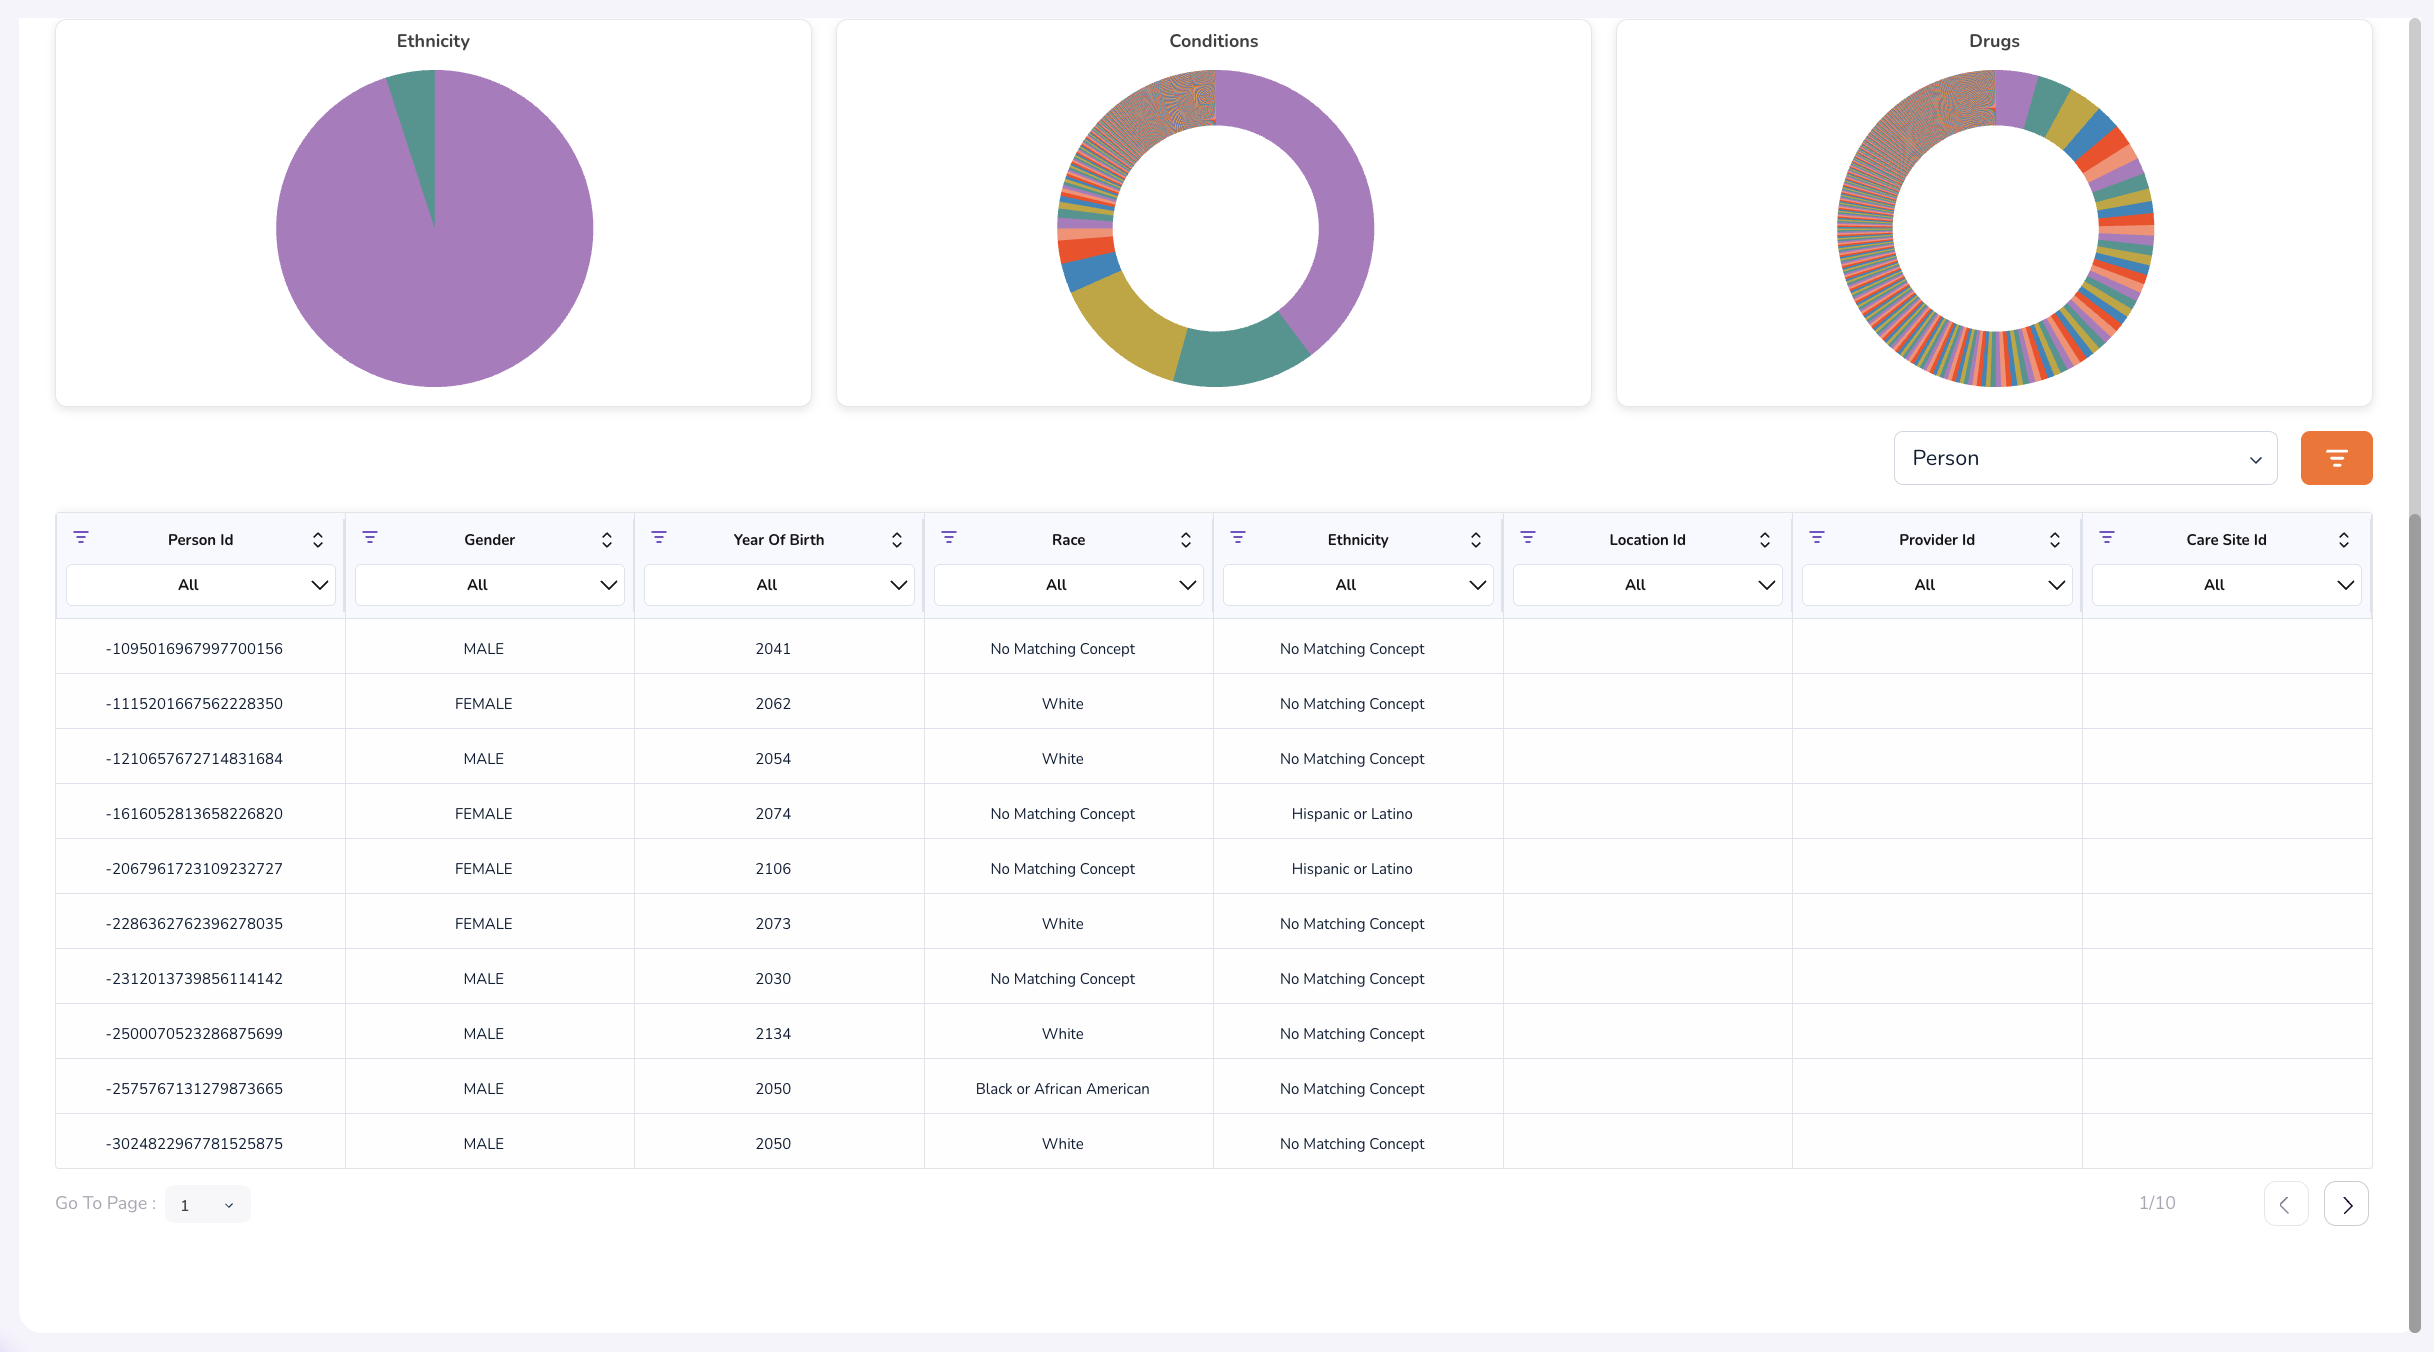
Click a dataset to open its detailed view, which surfaces a Dataset Summary dashboard, with visualisations of the demographics and aggregate statistics that characterize each dataset. A person and specimen-level table will also be visible at the bottom of the dashboard.
Additional Notes for Datasets
- To publish a new dataset or modify an existing one, contact the TRE Infrastructure Administrator.
Requests
The Requests dashboard is where you process the user-generated requests that govern data and resource access in the TRE. Three request types flow through this queue:
- Workstation Requests — Researchers requesting a new cloud-based workstation.
- Data Upload Requests — Researchers requesting to upload external data into the TRE.
- Data Download Requests — Researchers requesting to download analysis results out of the TRE.
Approving or denying these requests is the primary operational responsibility of the TRE Administrator.
Reviewing and Processing Requests
-
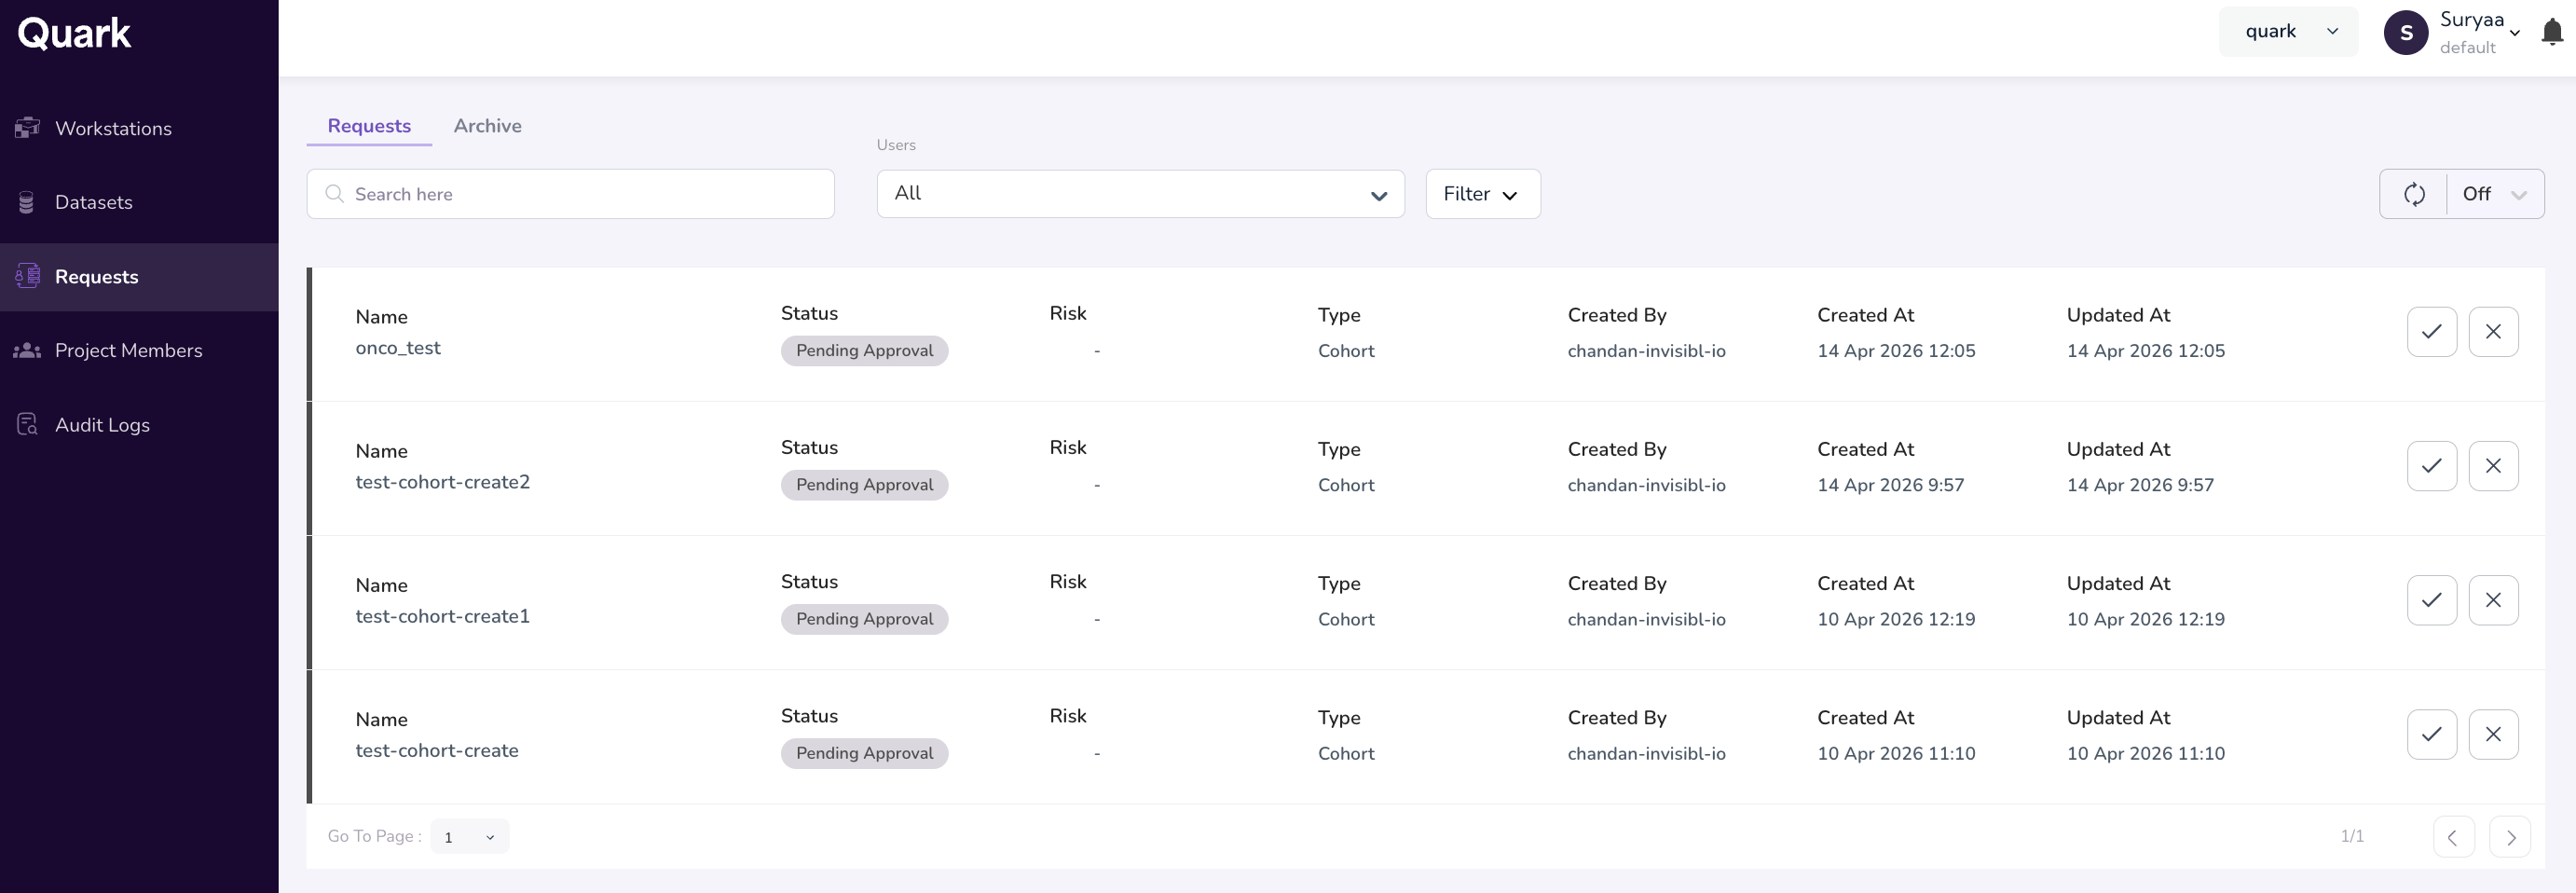
Navigate to Requests in the left-hand Navigation Menu. The dashboard lists all pending requests chronologically, with the requester's name, project, and submission timestamp.
-
Click any request to open its detail view.
- For example, if the request is for a dataset (Cohort Access Request), review the attributes of the requested cohort. Confirm that no Personally Identifiable Information (PII) or Protected Health Information (PHI) are exposed through the dashboard. For example, if there are specific outliers above a certain age bracket present in the requested cohort, confirm that they're grouped into a single bracket (e.g., Above 70).
- Review the Justification provided by the requester.
- For download requests: review the file manifest showing exactly which files will leave the TRE.
- For workstation requests: review and confirm that the usage, cost and justifications align with the project requirements.
-
Choose one of the following actions:
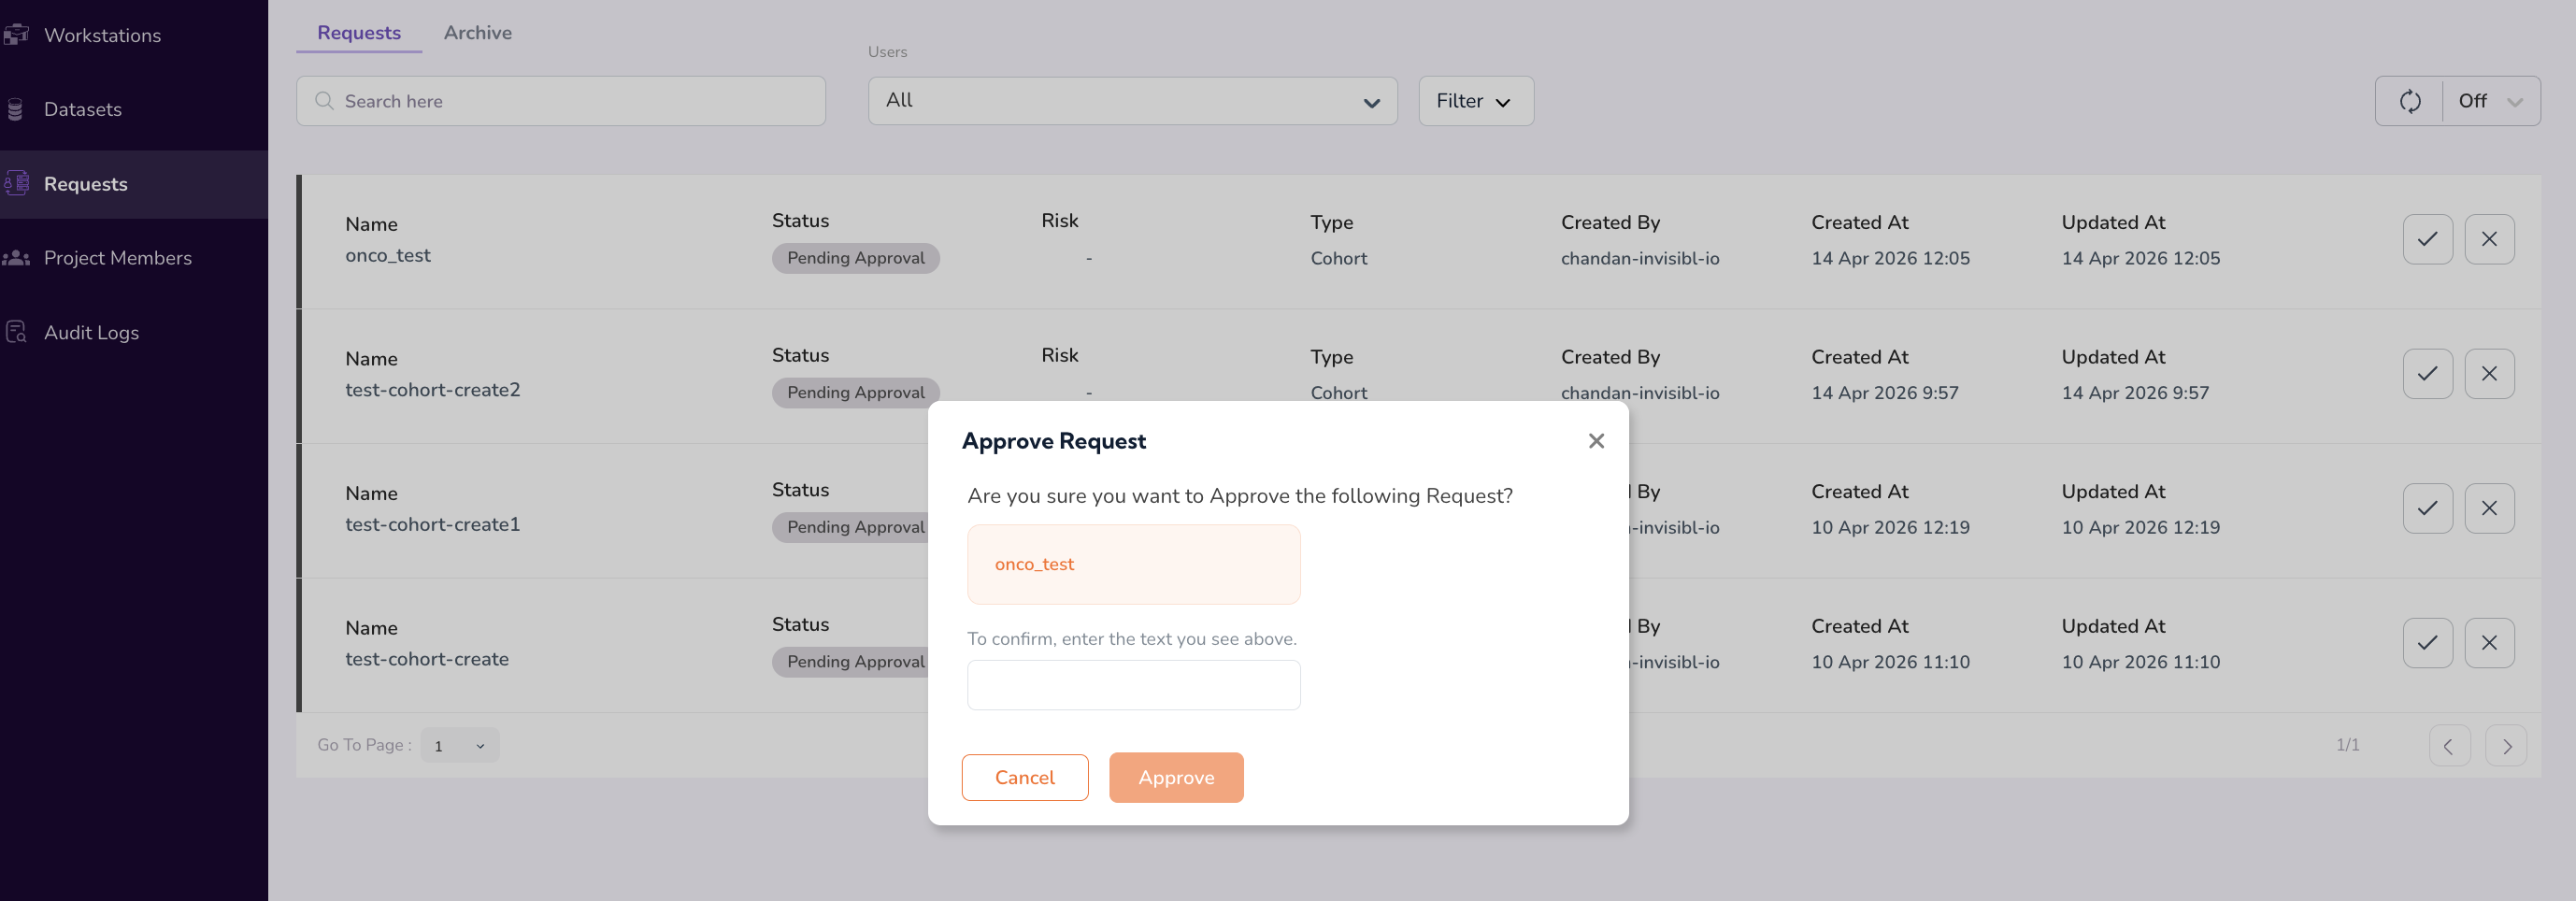
- Approve — Grants the request. Click on the Approve icon on the far right of the row and follow the prompt messages. Once approved, workstations begin provisioning; datasets/uploads/downloads become available to the requester.
- Deny — Rejects the request. You will be prompted to provide a reason that is shared with the requester.
The Archive Tab
Processed requests (both approved and denied) move to the Archive tab on the Requests dashboard. Use the Archive to audit historical decisions, look up the reasoning behind a past denial, or confirm when an approval was issued.
Additional Notes for Requests
- Data download requests should be reviewed with particular care — once data leaves the TRE, it leaves the governed environment entirely. Always inspect the file manifest before approving.
- Denying a request is final from the requester's perspective; if they want to retry, they must submit a new request.
Project Members
The Project Members dashboard is where you manage who has access to each project in the TRE. Projects themselves are created by the TRE Platform Administrator — the TRE Administrator role is to populate each project with the right researchers and collaborators.
Adding Members to a Project
- Navigate to Project Members in the left-hand Navigation Menu.
-
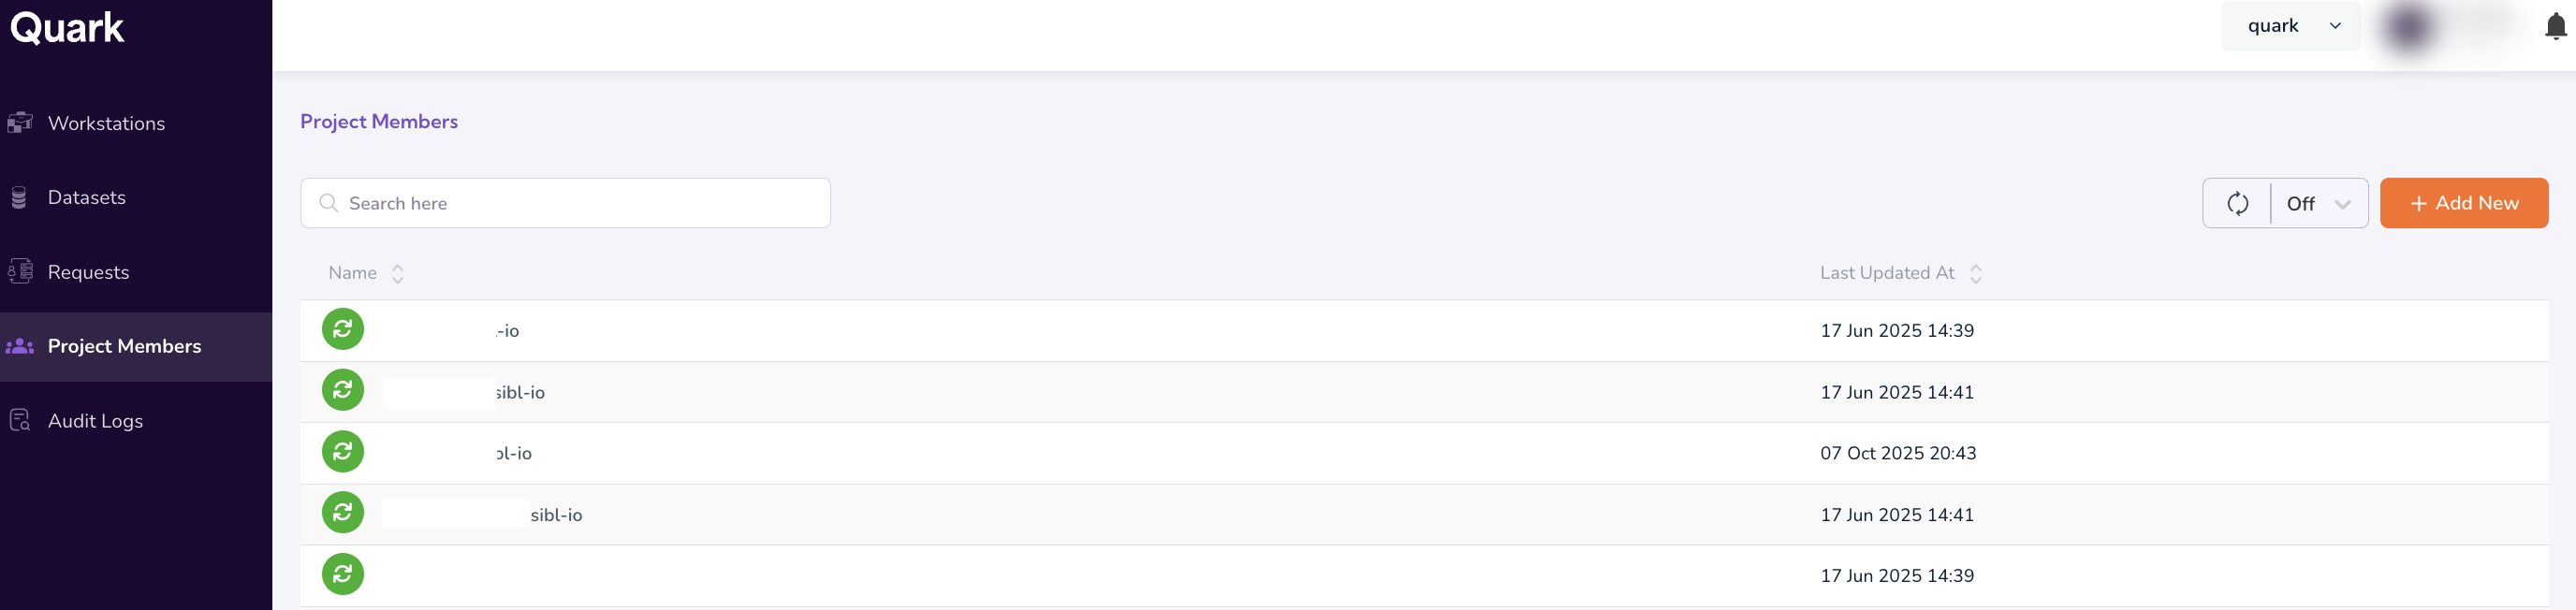
From the project dropdown at the top of the dashboard, select the project you want to manage. The dashboard refreshes to show the current member list for that project, including each member's role and date added.
-
Click Add New in the top-right corner.
-
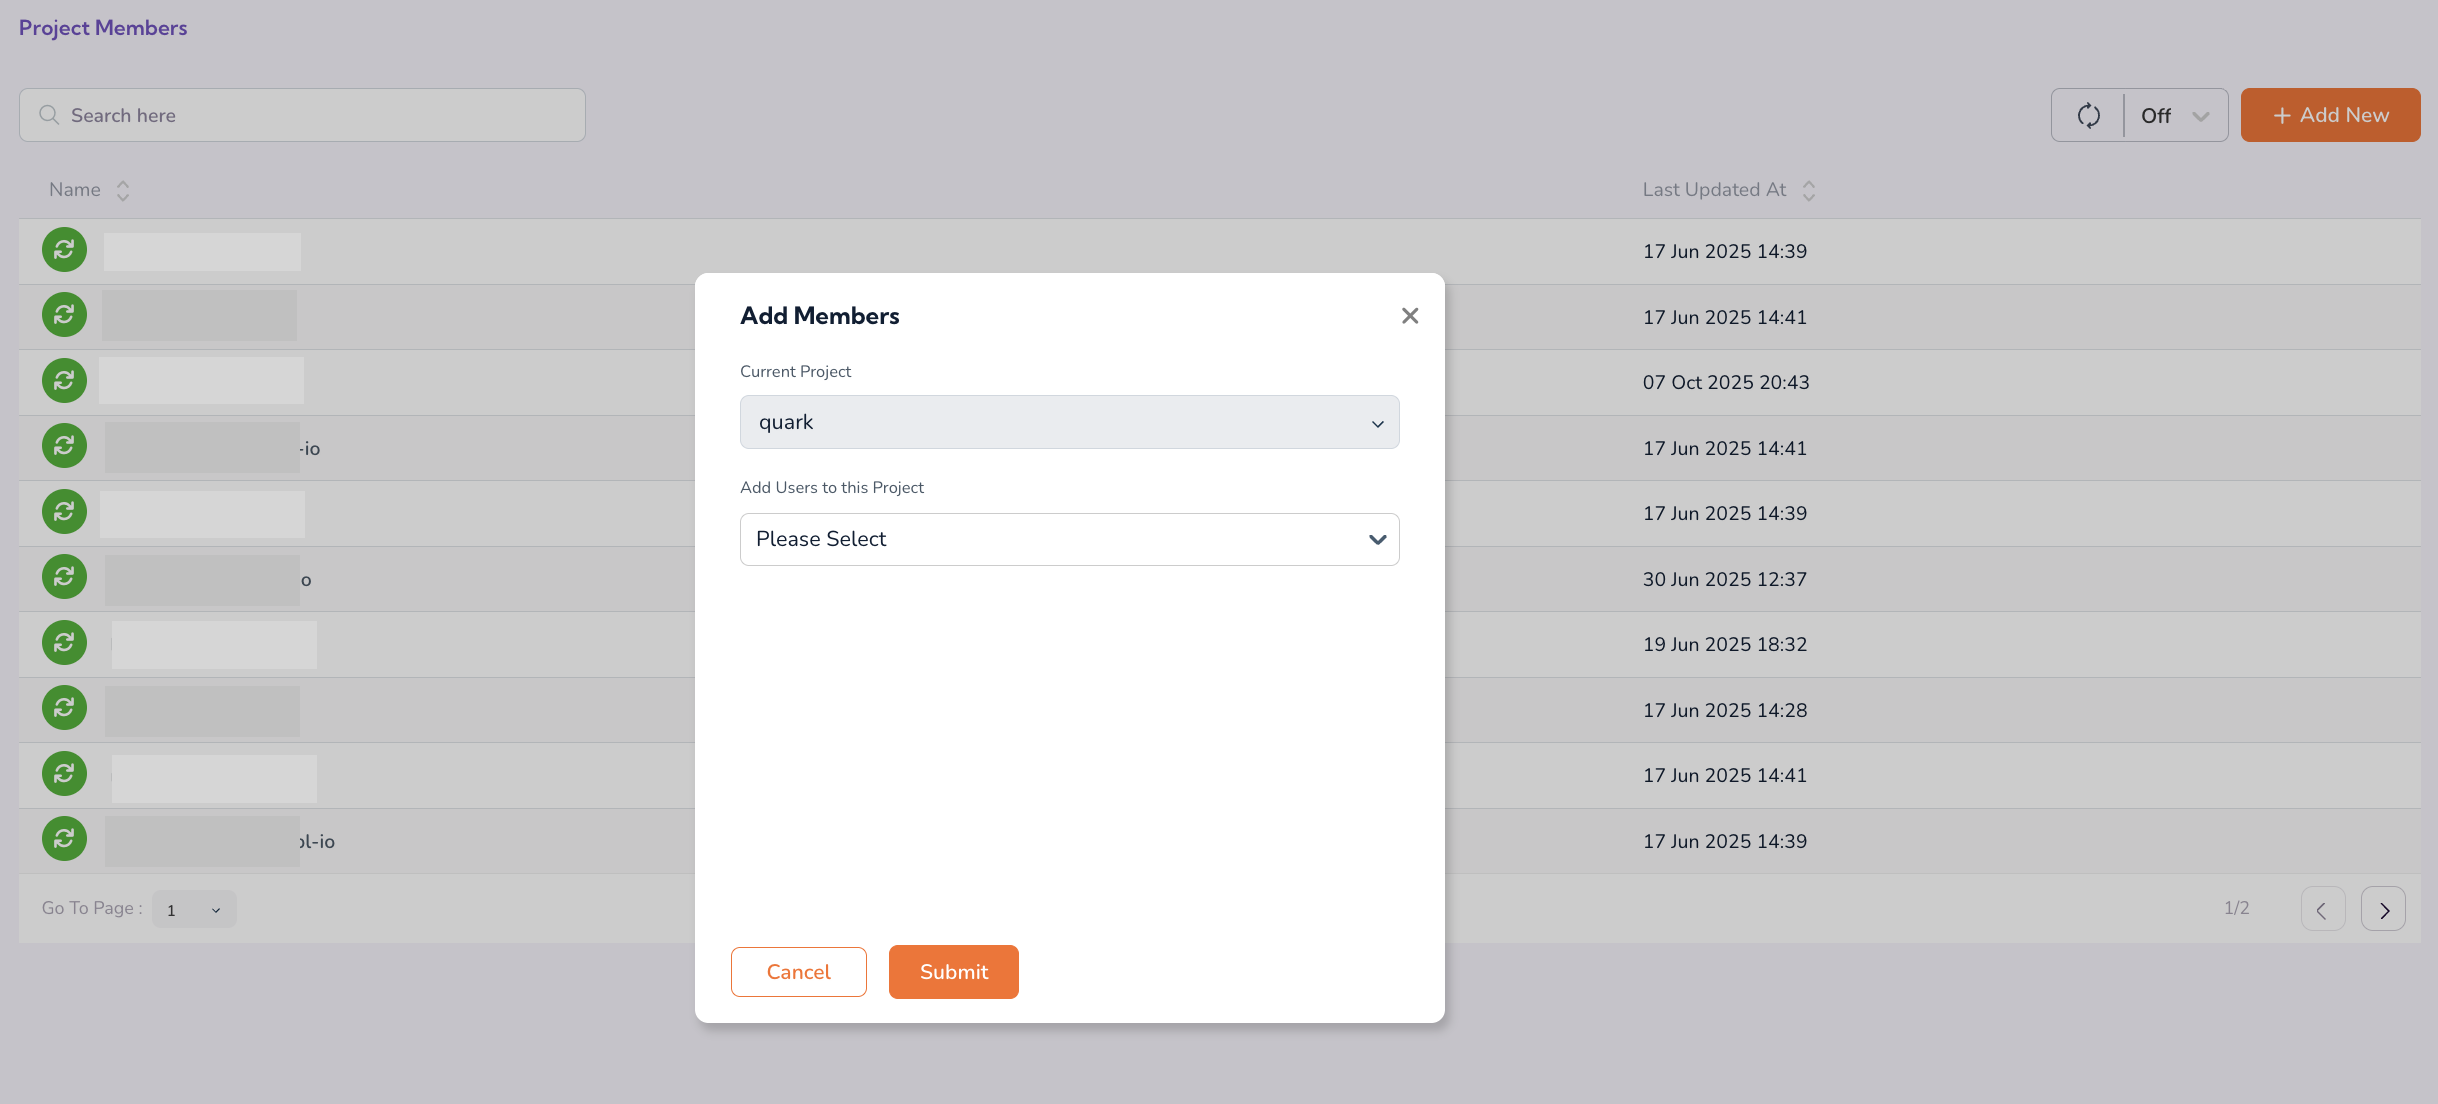
In the Add Members pop-up, fill in the following fields:
- Current Project — Pre-set to the project currently open on the dashboard. Confirm this is correct before proceeding.
-
Add Users to this Project — Select one or more users from the dropdown menu. The dropdown lists all TRE users who are not already members of the selected project.
-
Click Submit to save your selection. The newly added users appear immediately on the Project Members dashboard and gain access to the project's datasets, workstations, and pipelines according to the project's configured permissions.
Additional Notes for Project Members
- If the project you need does not appear in the dropdown, contact the TRE Platform Administrator — projects must be created at the platform level before members can be added.
- A user can be a member of multiple projects simultaneously. Their access to specific datasets is governed by each project's own access approvals.
Audit Logs
The Audit Logs dashboard provides a chronological record of activity across the TRE — every dataset access, workstation launch, file upload, file download, and permission change is captured here. Audit Logs are your primary tool for compliance reporting and incident investigation.
Accessing Audit Logs
- Navigate to Audit Logs in the left-hand Navigation Menu. The dashboard lists log entries in reverse chronological order, with each entry showing the Resource, Resource Name, User, Performed At, and Action.
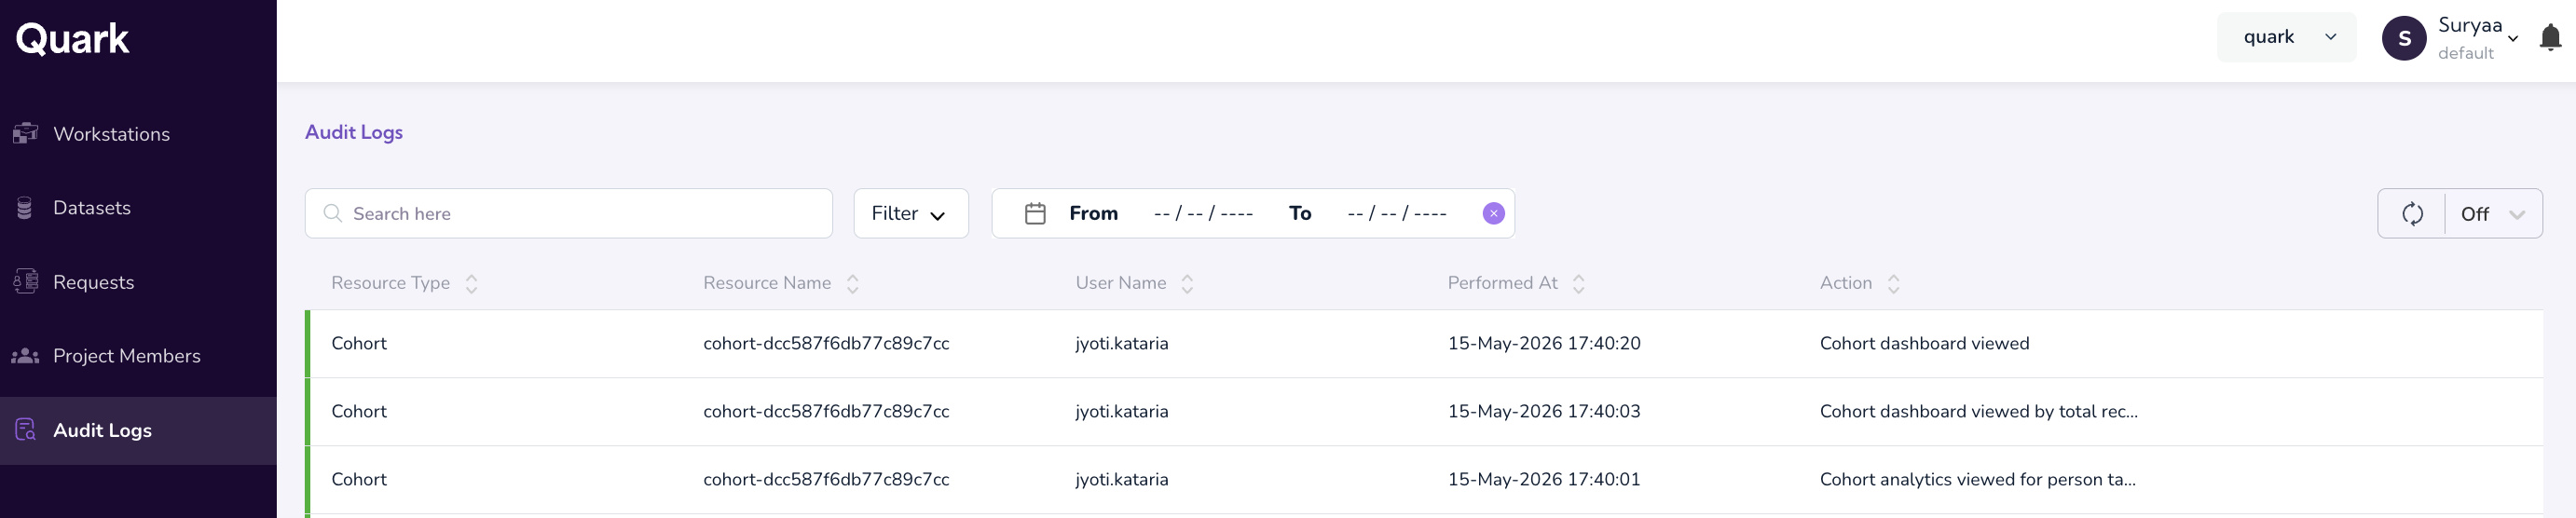
- Use the filter controls to narrow the log view by:
- Date range — Focus on a specific incident window or reporting period.
- User — Audit the activity of a specific researcher or administrator.
- Resource name — Scope logs to a single project.
-
Resource type — Filter to workstation events, dataset access, file operations, or permission changes.
-
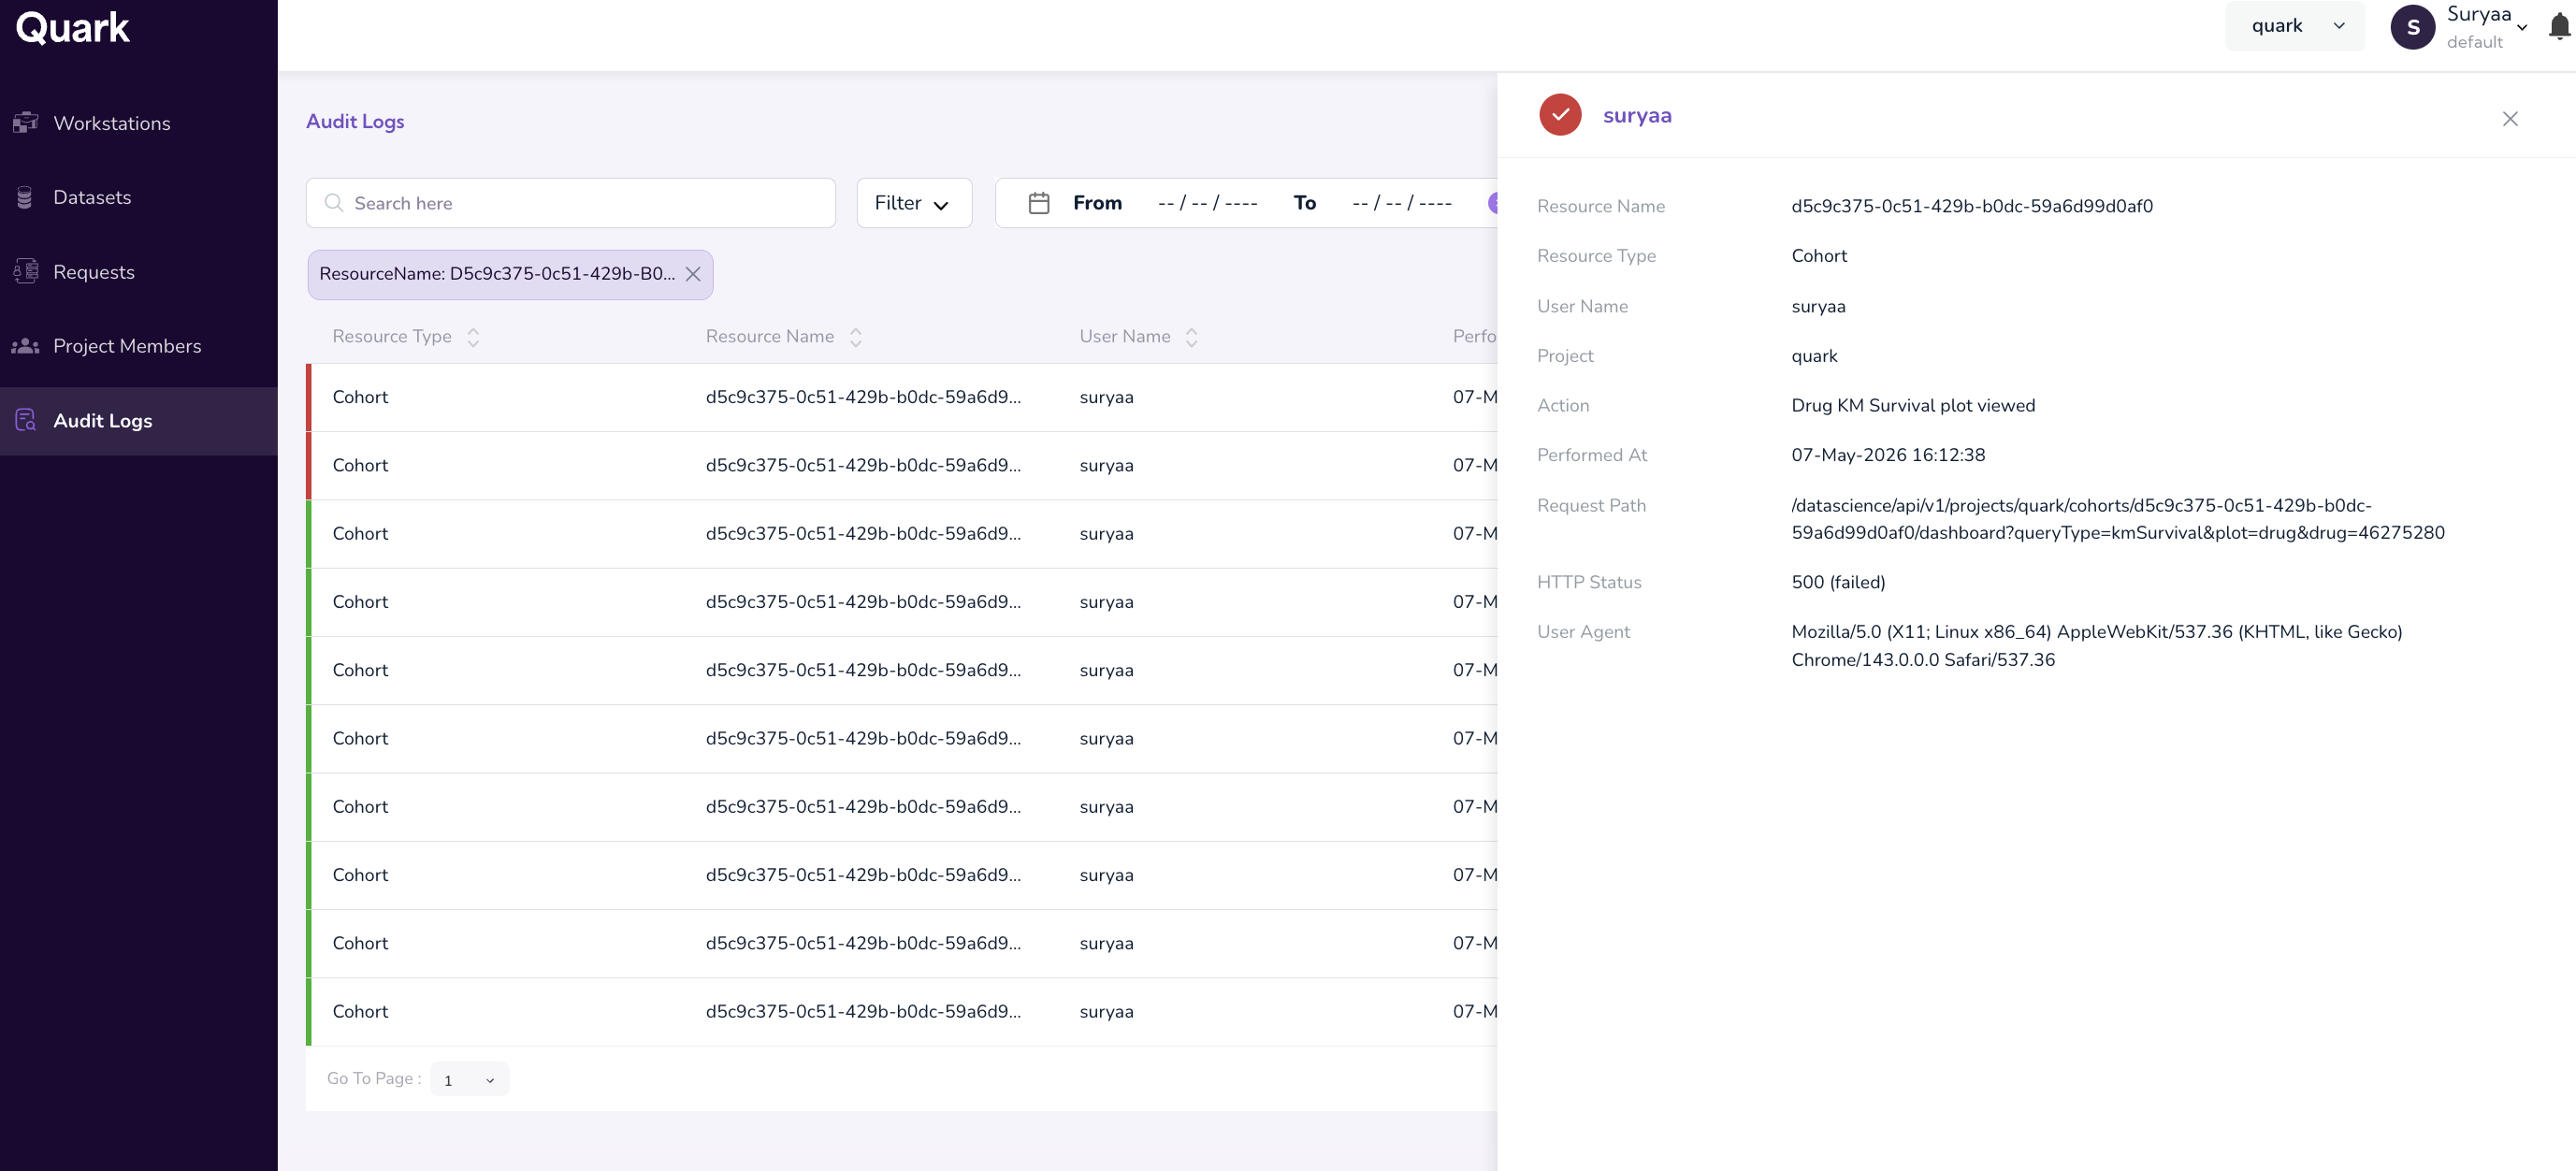
Click on the individual row to view the log file in detail.
Additional Notes for Audit Logs
- Audit log entries are immutable — they cannot be edited or deleted by any role, including the TRE Administrator.
- Retention periods for audit logs are configured at the platform level by the TRE Platform Admin. Verify the retention policy with your platform team before relying on logs for long-range historical analysis.
What's Next
- Getting Started with Quark TRE — Understand the researcher-facing experience whose requests you process.