Monitoring Platform Cost
Overview
The Cost section provides a consolidated view of platform expenditures, filtered by team, project, and user.
Steps to Monitor Cost
1. Open the Cost dashboard
Navigate to Cost in the left-hand Navigation Menu.
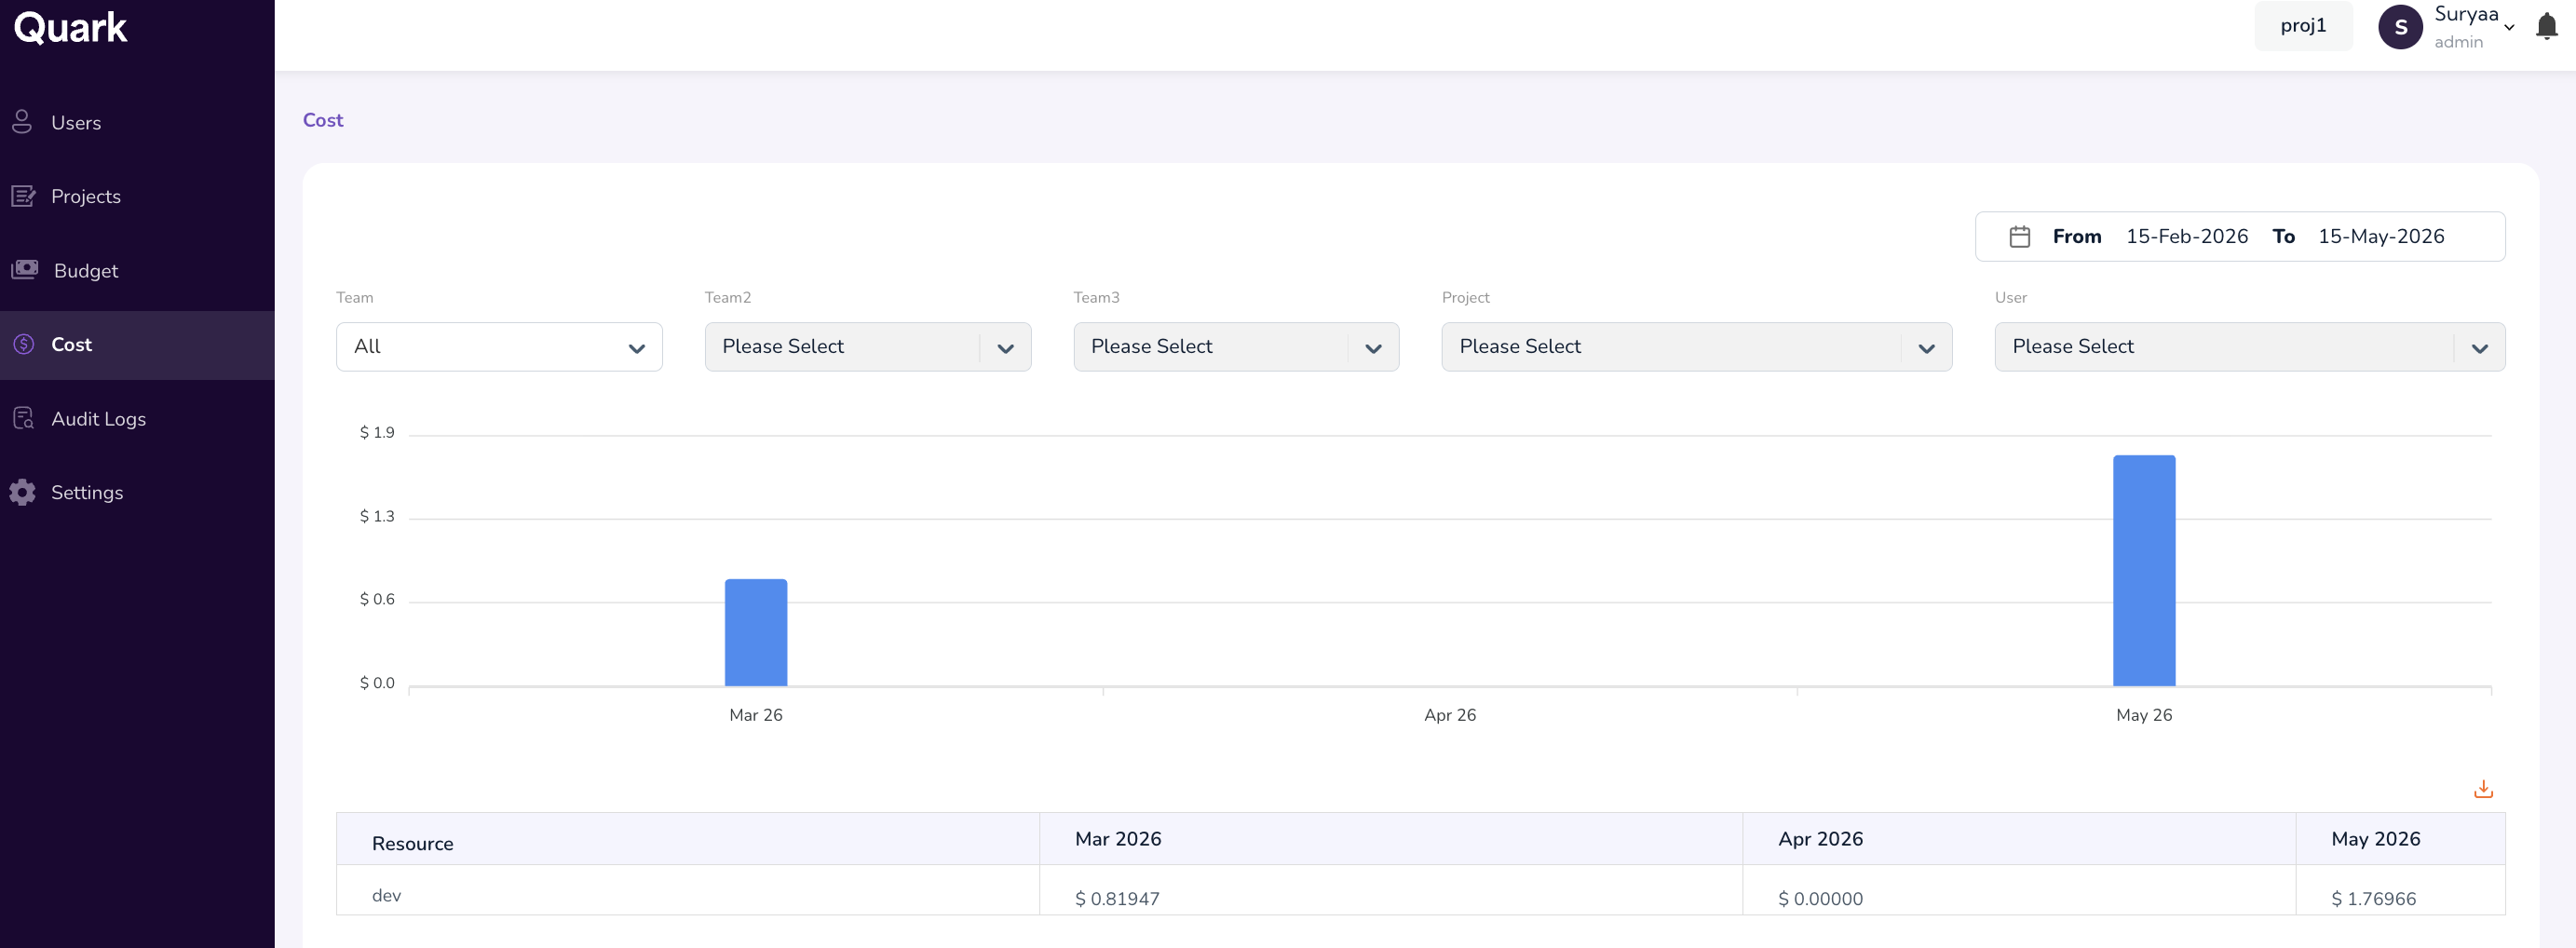
The dashboard displays total spend across the organization, with visual breakdowns by team, project, and user.
2. Filter the view
Use the filter controls at the top of the dashboard to narrow the view:
- Team — Select a specific Group or Business Unit/Department to see only its spending.
- Project — Drill into one or more projects within the selected team.
- User — Optionally further filter by a specific user within the selected team or project.
- Time range — Compare spending across days, months, quarters, or fiscal years.
3. Drill into the costs incurred
-
The dashboard displays a bar chart of spending over time. Click any bar in the chart to see:
-
The project to which the cost is attributed.
- The cost amount for that period.
-
The month in which the cost was incurred.
-
Below the chart, a table view provides per-column detail for each cost entry:
-
Resource — The project (or other resource) the cost is attributed to.
- Time — The time window over which the cost was accumulated.
Reading Cost Against Budget
The Cost dashboard does not natively overlay budget allocations. To compare actual spend against the allocations you set in Allocating Budgets:
- Filter the Cost view to the same entity (e.g. Business Unit/Department, or user) you allocated a budget for.
- Match the time range to the allocation's period (annual, quarterly, monthly).
- Compare the totals.
Additional Notes
- Cost data is read-only. To change limits, adjust budgets in Allocating Budgets
What's Next
- Allocating Budgets — Adjust budget allocations based on what you observe in the Cost dashboard.
- Configuring Platform Controls — Enable multiple controls on the platform to configure settings.
- Reviewing Audit Logs — If spending patterns look anomalous, review their audit logs.