Reviewing Audit Logs
Overview
The Audit Logs section maintains a chronological record of activity across the platform. Every event — user actions, resource changes, project updates, login attempts, settings modifications — is captured as an immutable log entry.
As Platform Administrator, you have visibility into the full log set.
Steps to Review Audit Logs
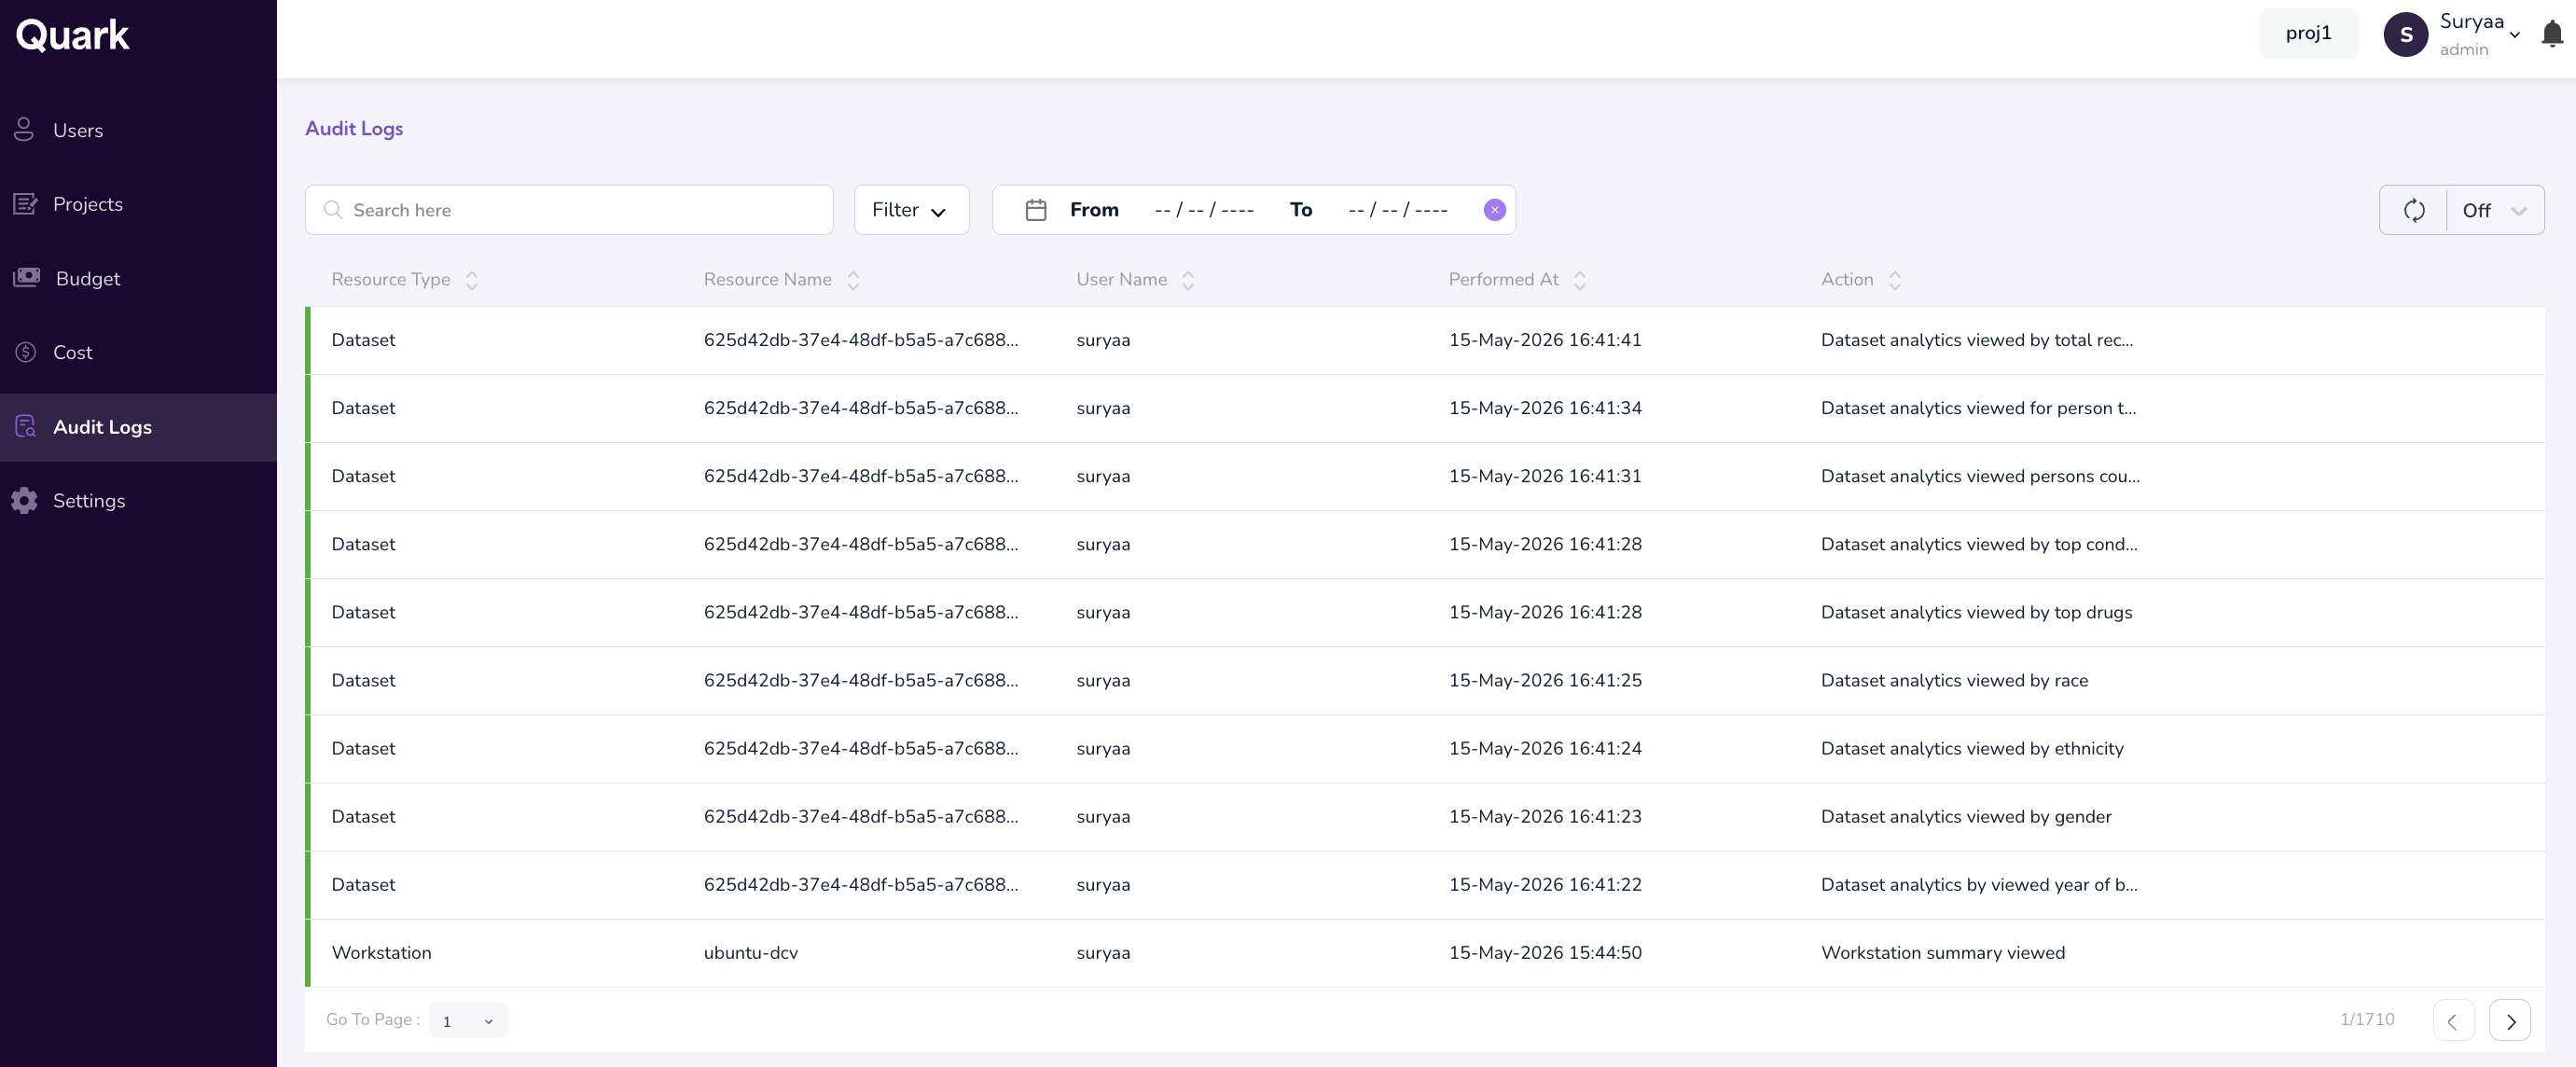
1. Open the Audit Logs dashboard
Navigate to Audit Logs in the left-hand Navigation Menu.
The dashboard lists log entries in reverse chronological order, with each entry showing a summary of the action taken.
2. Filter the log
Use the filter controls at the top of the dashboard to narrow the view:
- User — Audit the activity of a specific user (researcher, administrator, or system account).
- Resource Name — Look up all events affecting a specific resource (a particular project, dataset, workstation, etc.).
- Resource Type — Filter to a category of resource (workstations, datasets, projects, users, settings).
- Date Range — Focus on a specific incident window or reporting period.
3. Review individual entries
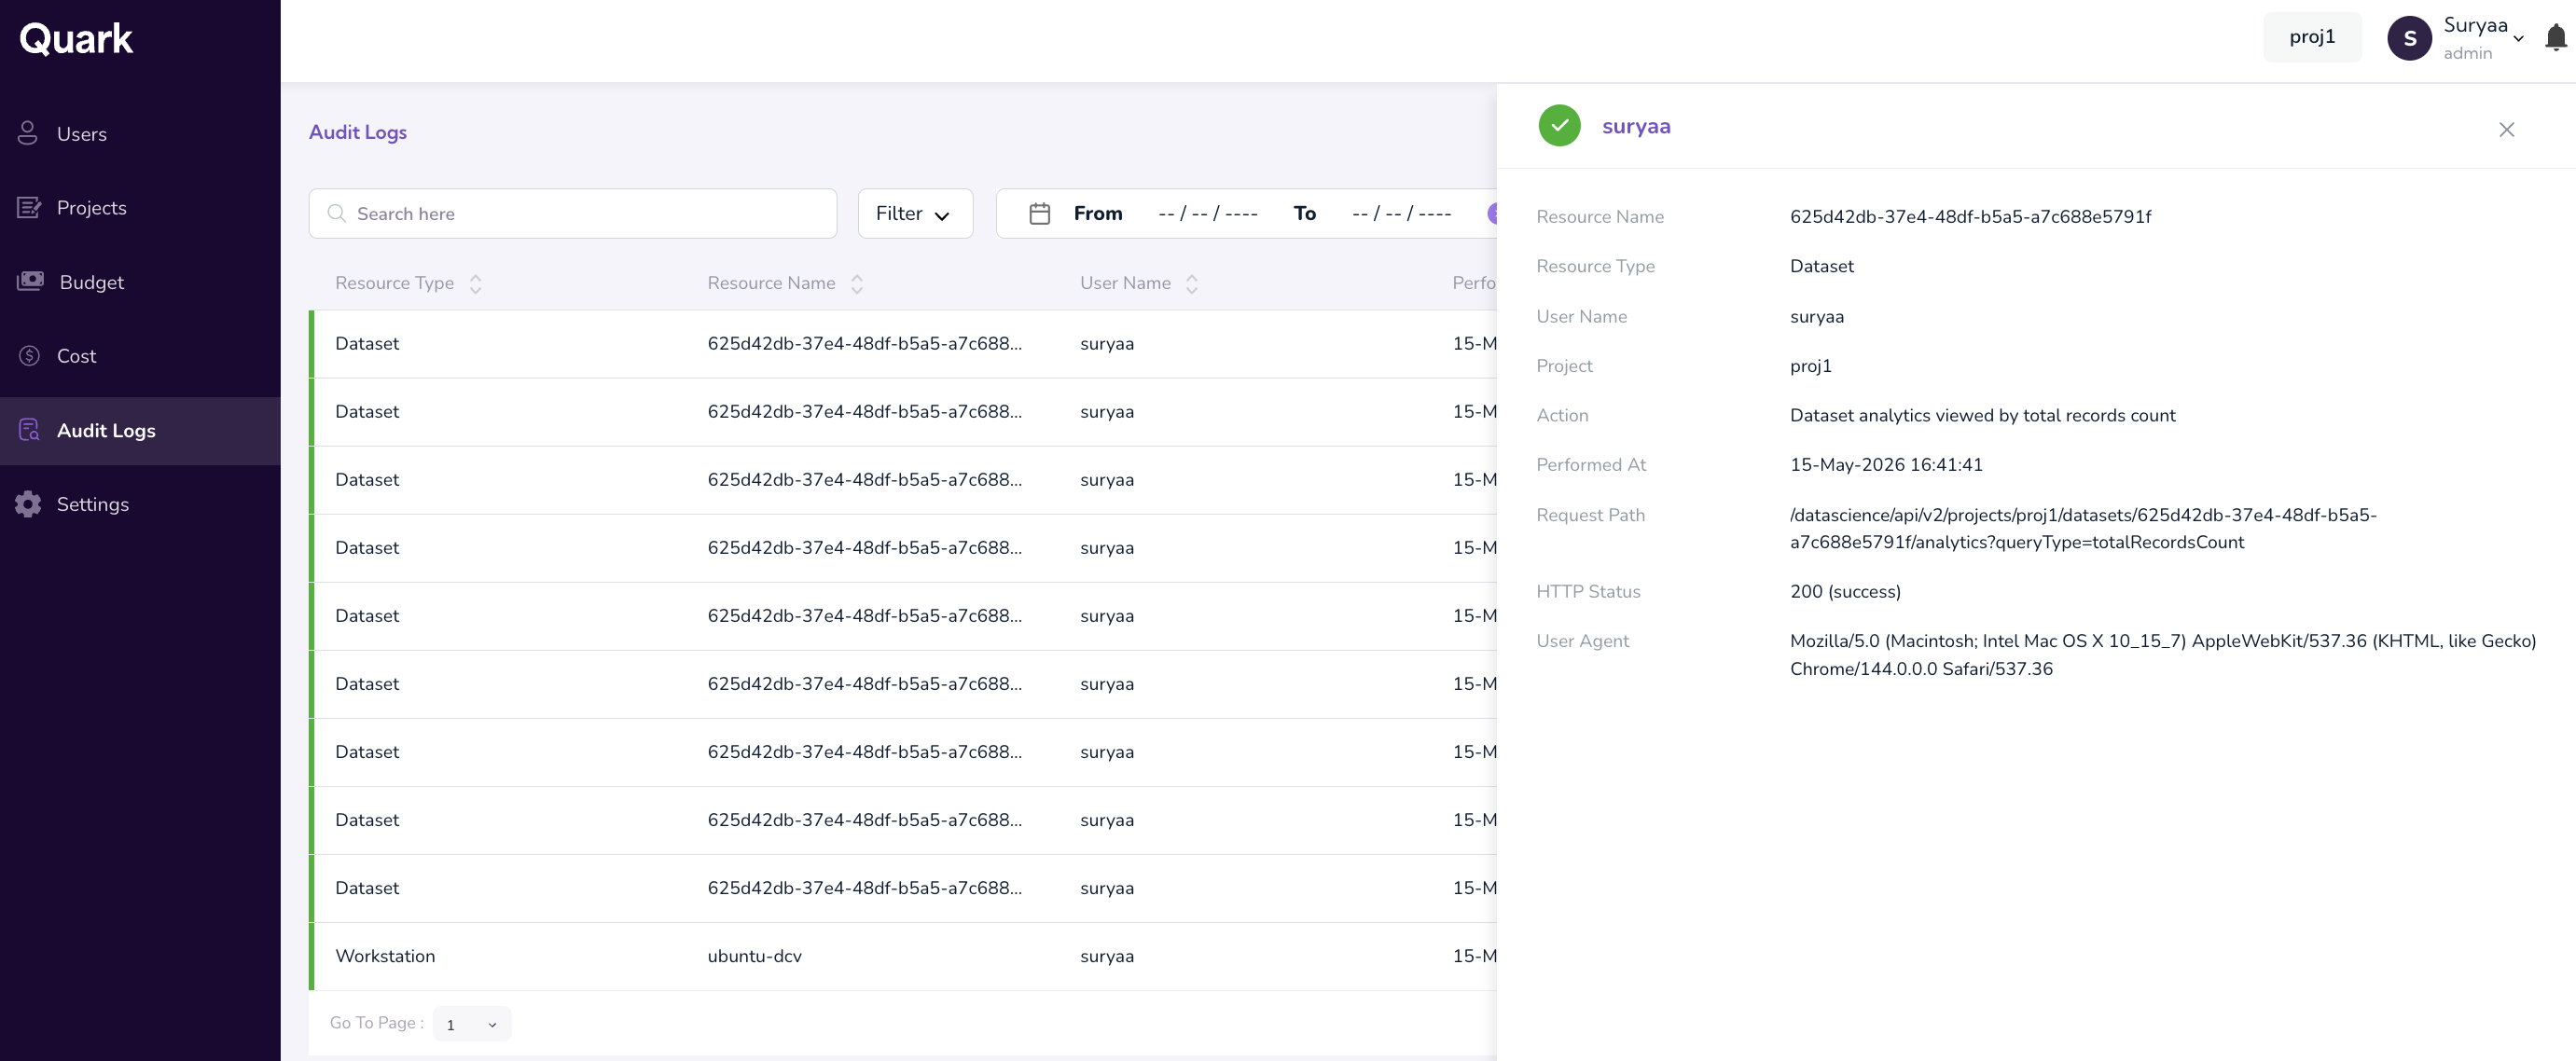
Click any row in the log to open its full detail view. Each entry surfaces the following fields:
- Resource Name — The specific resource the action was performed on.
- Resource Type — The category of resource (workstation, dataset, project, etc.).
- Username — The user who performed the action.
- Associated Project — The project context, if applicable.
- Performed Action — The action taken (create, update, delete, access, login, etc.).
- Timestamp — When the action occurred.
- Request Path — The API endpoint that handled the action.
- HTTP Status — The response status, useful for distinguishing successful actions from failed attempts.
- User Agent — The client (browser, CLI, SDK) from which the action originated.
4. Review workstation-specific details
If the audited resource is a workstation, the detail view additionally surfaces:
- The specific workstation template used to launch it.
- The full request path for the launch.
- Related resource-type and resource-name information for any datasets or computes the workstation accessed.
Example of a Common Audit Task
Auditing workstation access to sensitive data
- Filter by Resource Type = Workstation.
- Optionally scope to a specific project or user.
- Open each workstation entry to see which templates were used and which datasets were touched.
Additional Notes
- Audit log entries are immutable — they cannot be edited or deleted by any role, including the Platform Administrator.
- Logs include both successful and failed actions. The HTTP Status field is the fastest way to distinguish between them when looking for failed attempts.
What's Next
- Configuring Platform Controls — If audit findings suggest policy gaps, adjust approval workflows or notifications here.
- Monitoring Platform Cost — Correlate anomalous user actions in the audit log with cost spikes in the Cost dashboard.
- TRE Administrator Guide — Coordinate with the TRE Administrator on incidents that span operational and administrative event types.