Reviewing Pipeline Run Results and Alignments
This guide explains how to locate a completed pipeline run, review its key outputs (runtime, logs, and result files), and visualise alignment results using the integrated IGV app — without leaving the Quark V3 environment.
Audience: Bench scientists and bioinformaticians
Before you begin: The pipeline run you want to review must have completed successfully.
Overview
Reviewing a pipeline run in Quark V3 involves the following steps:
- Open the Runs page
- Locate your Run
- Review run details, logs, and result files
- Launch the pre-configured visualisation app (e.g. IGV) from the Summary tab
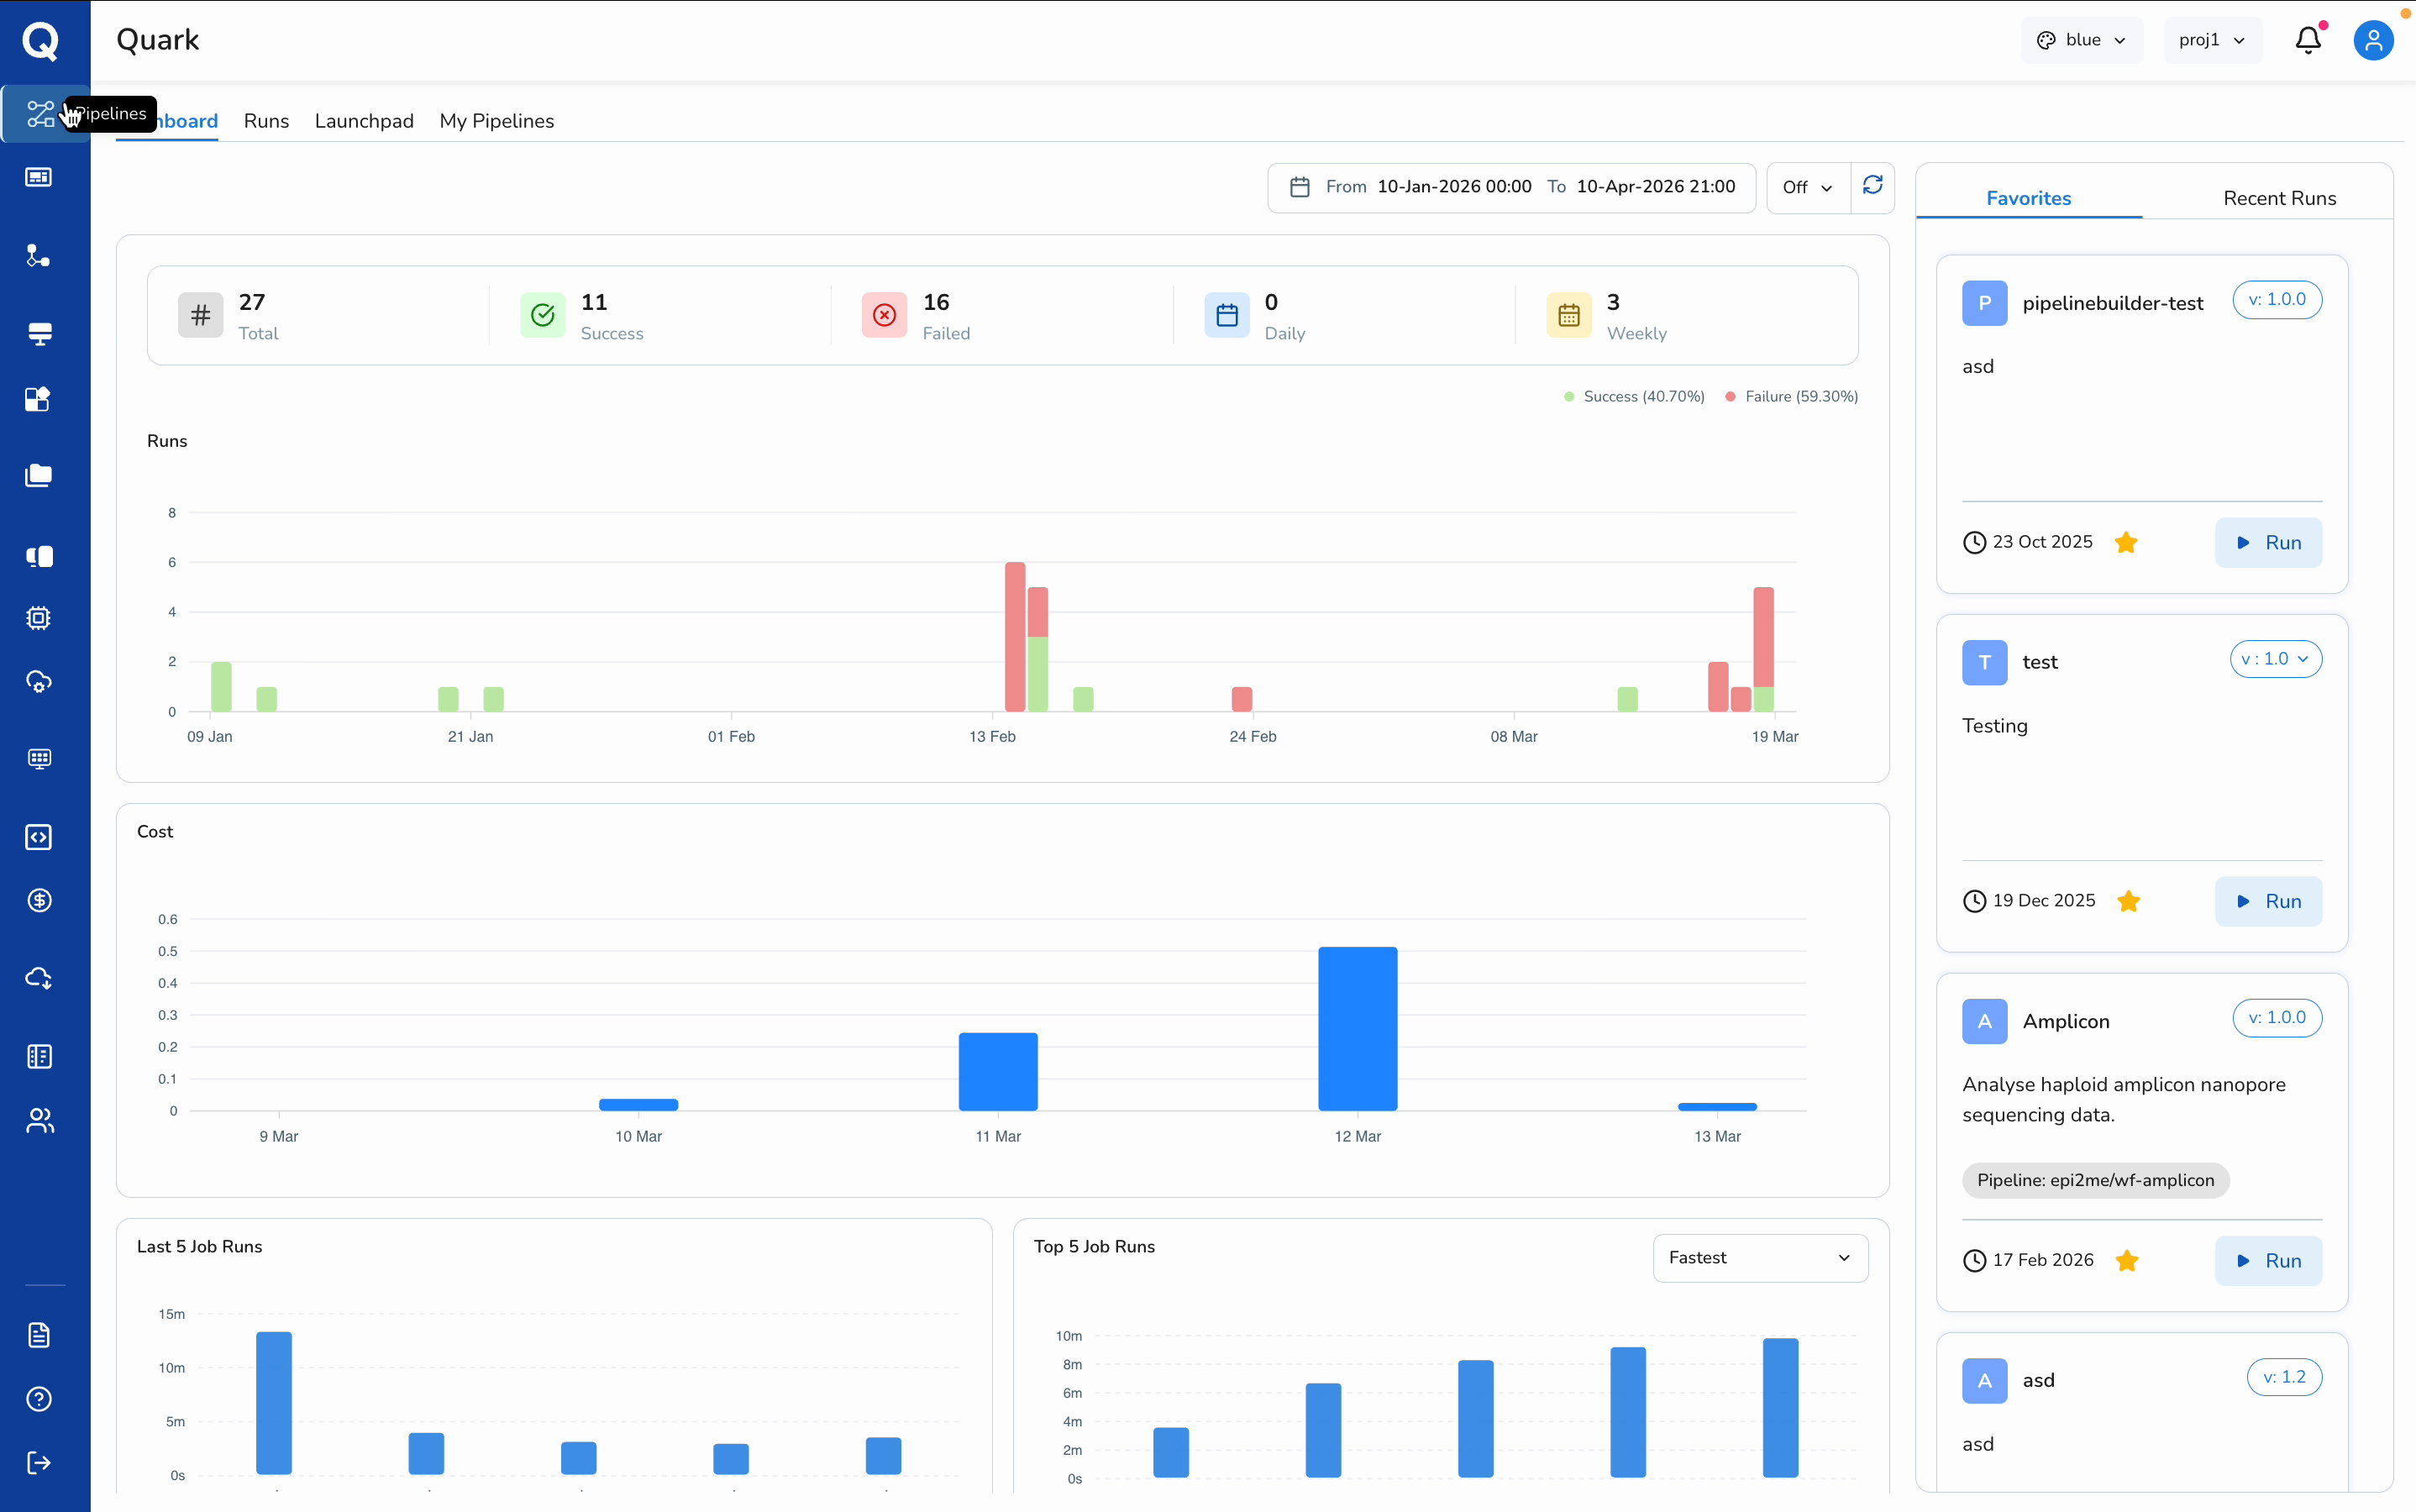
Step 1: Open the Runs Page
- Select Pipelines from the left navigation pane
- Click the Runs tab
The Runs page lists all pipeline executions available to you, with details including run name, status, pipeline name, start time, finish time, and total runtime.
Step 2: Locate Your Run
Use the Search bar and Filter options to locate a specific pipeline run. You can search by pipeline name or filter by status — for example, Success, Failed, or Running.
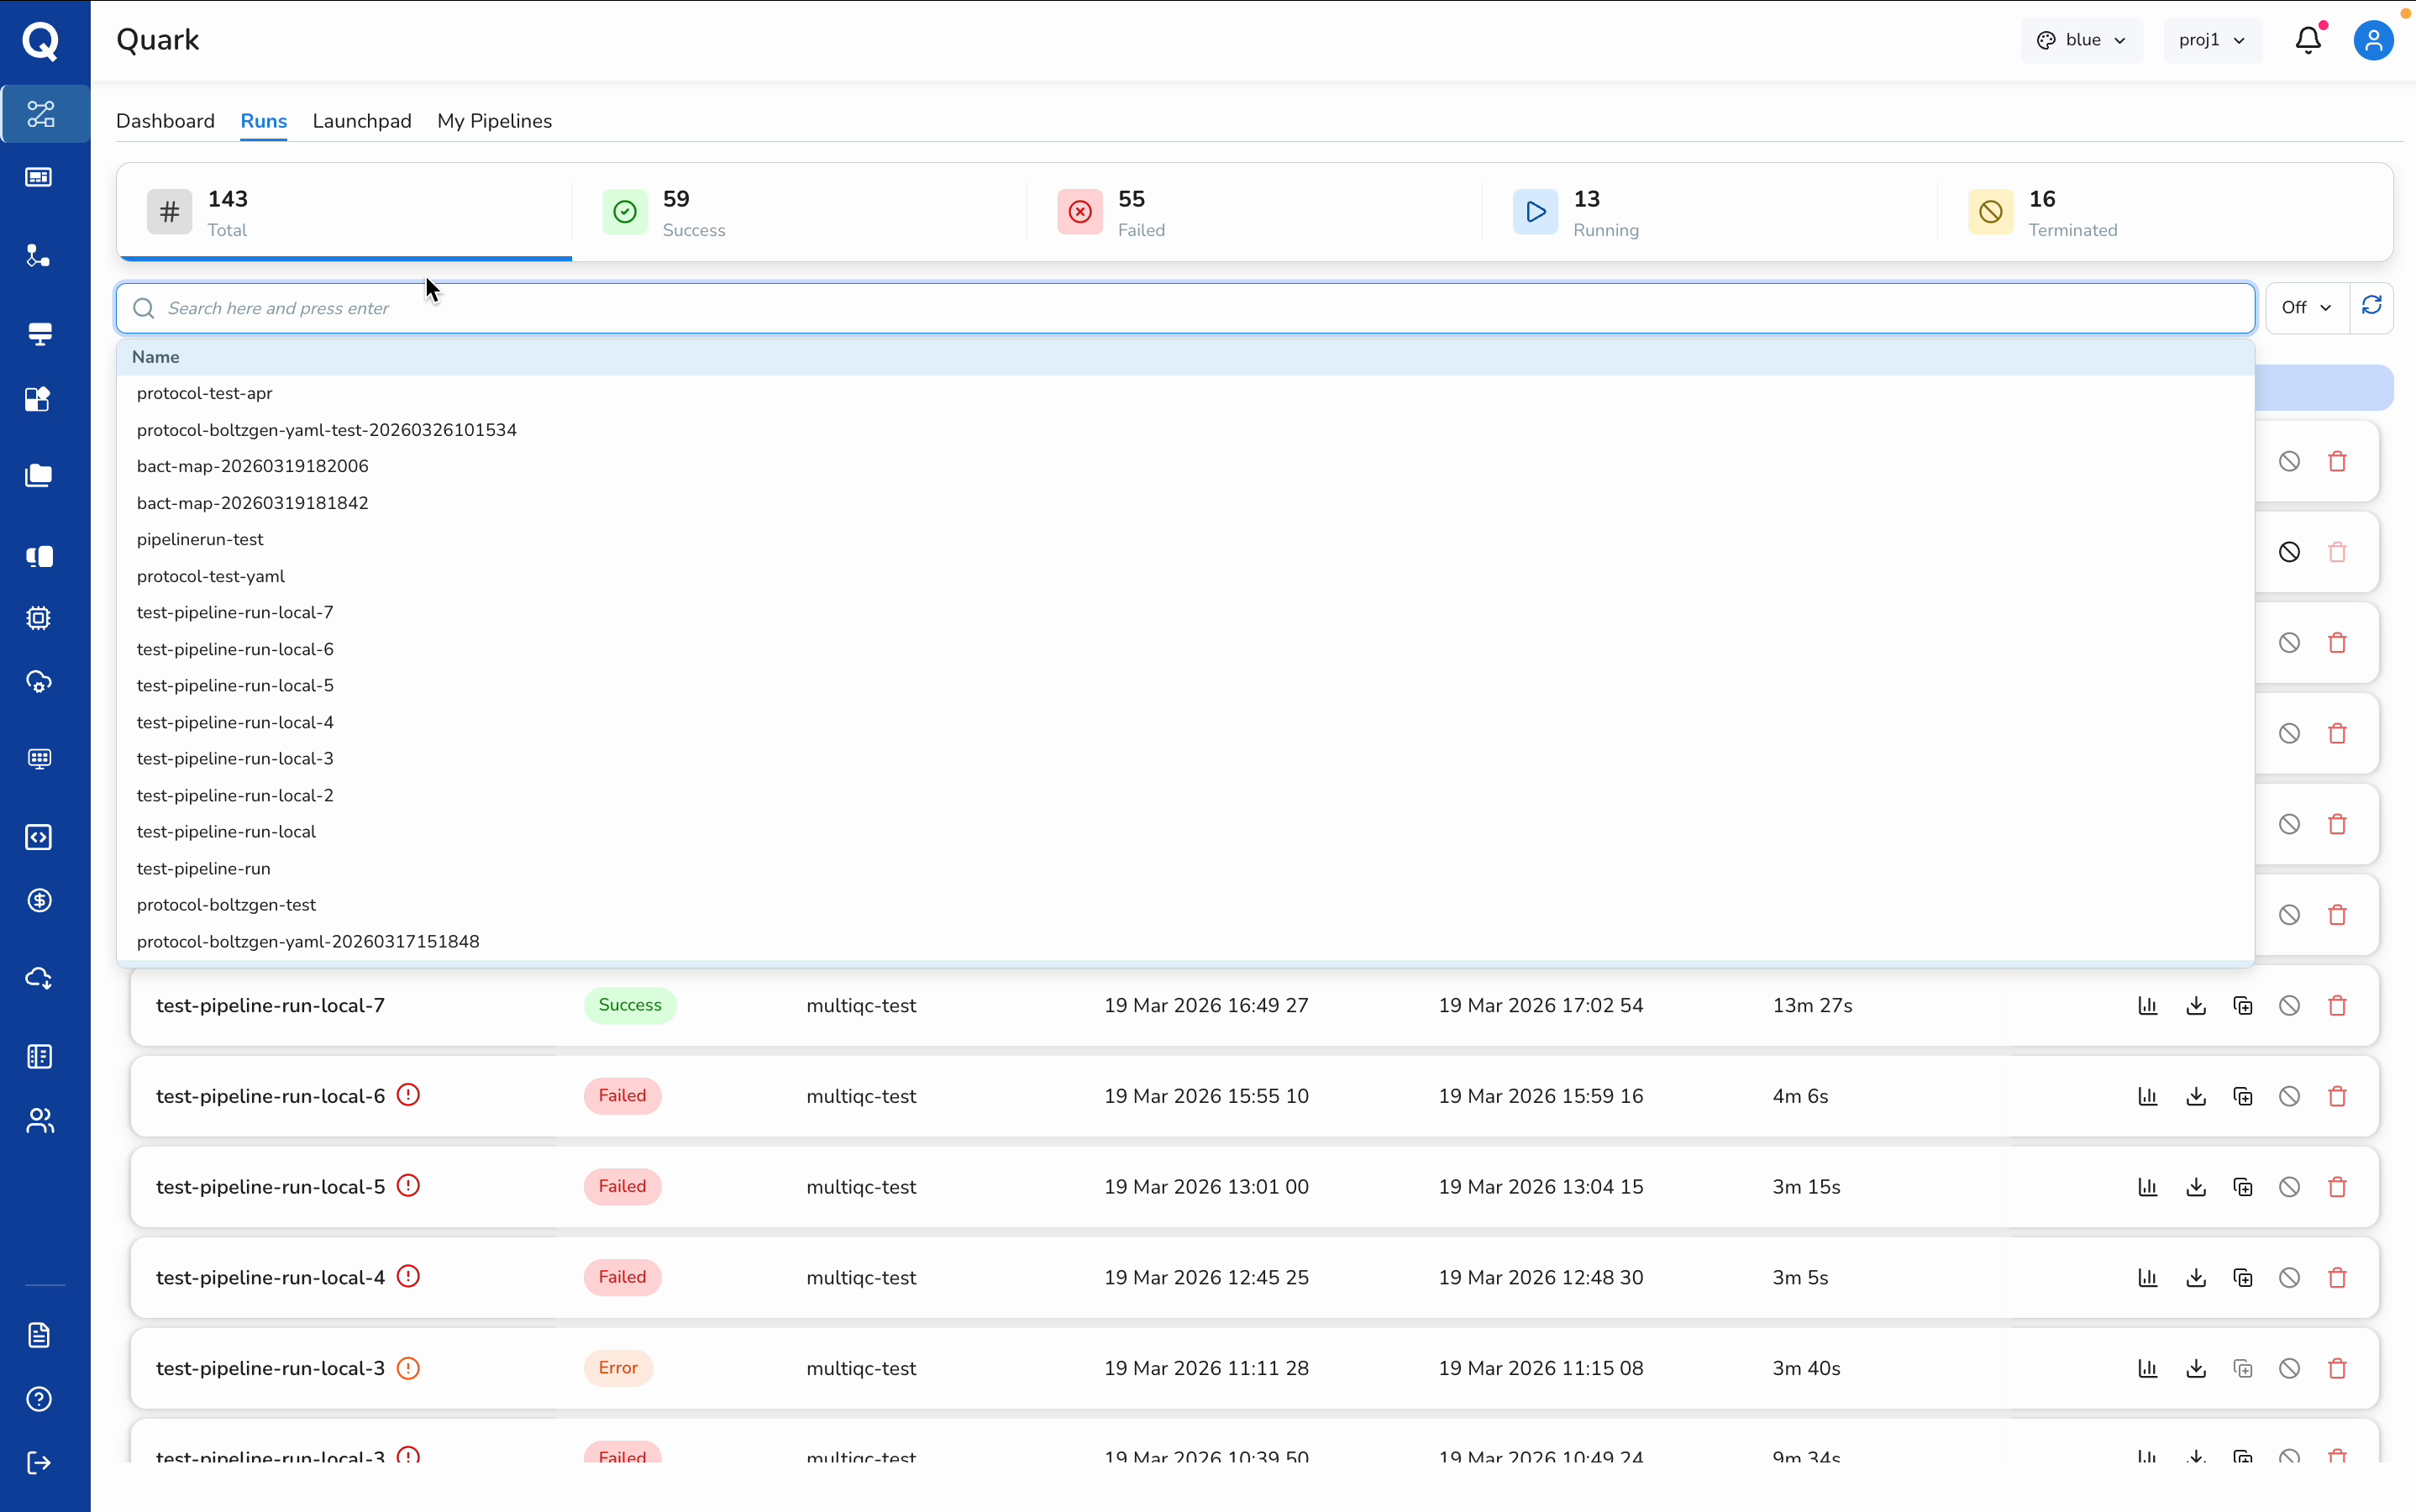
Tip: If you know your run completed successfully, apply the Success filter to narrow the list quickly.
Once you have identified the correct run, click its name to open the Run Details view.
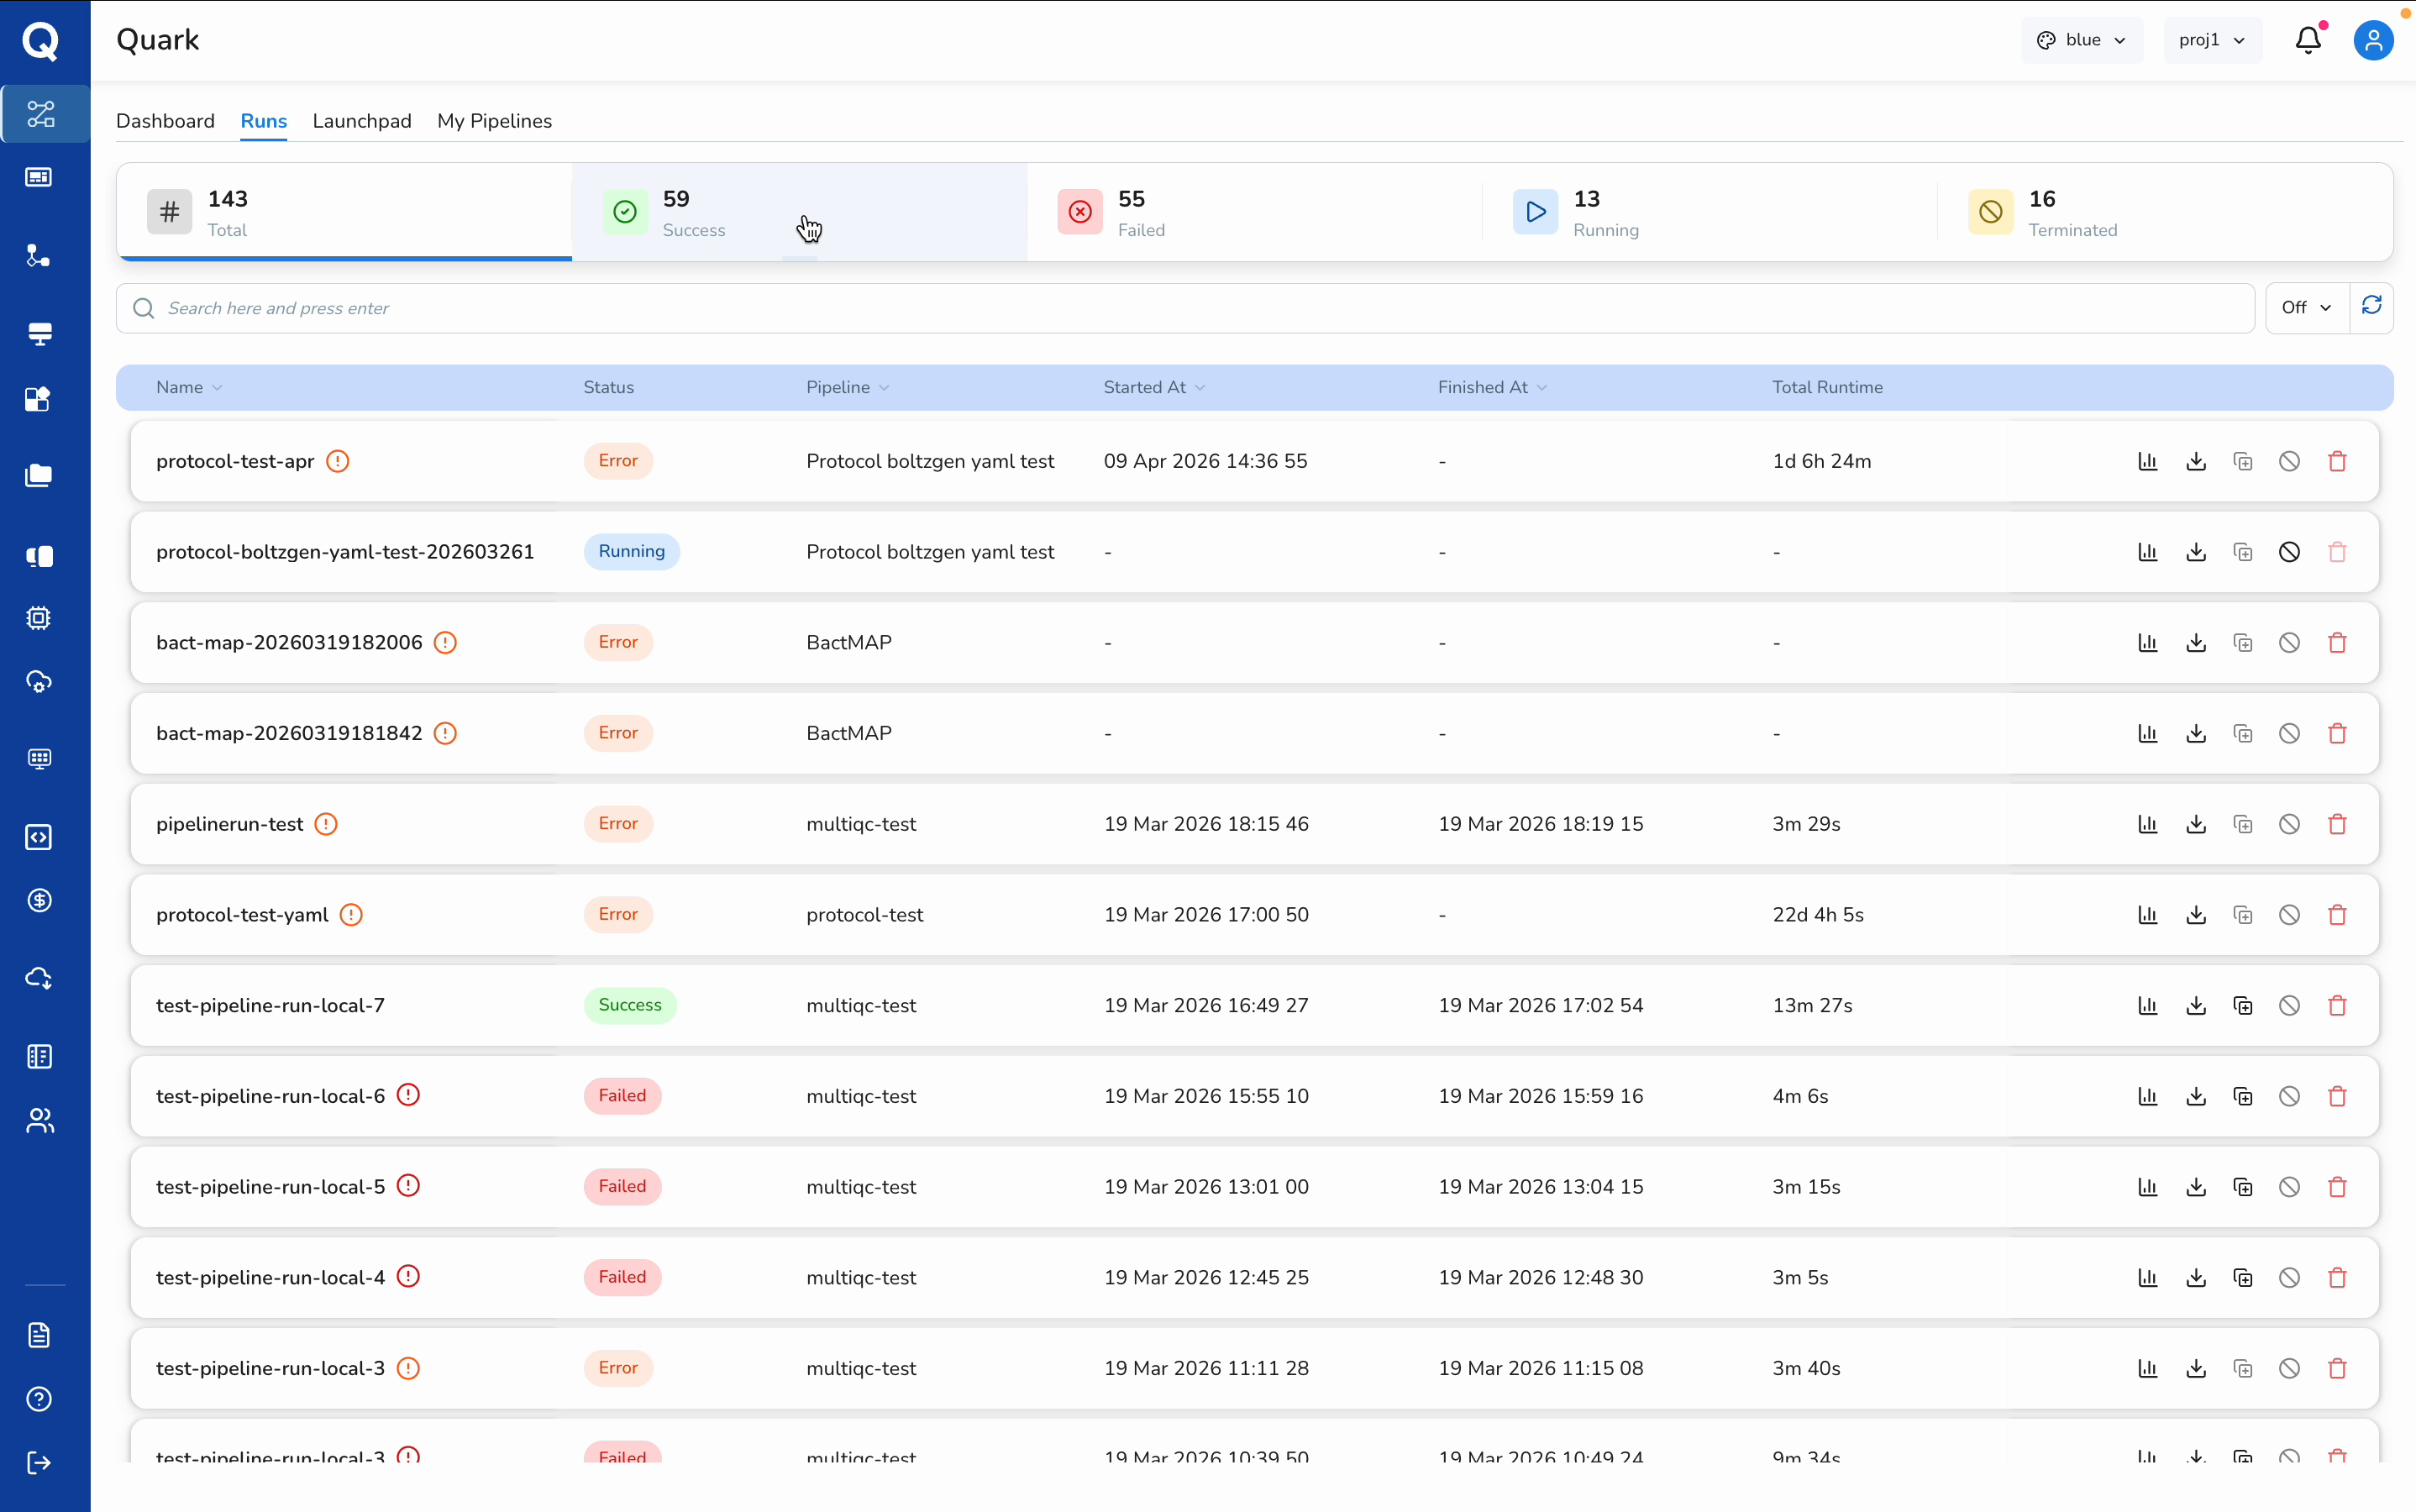
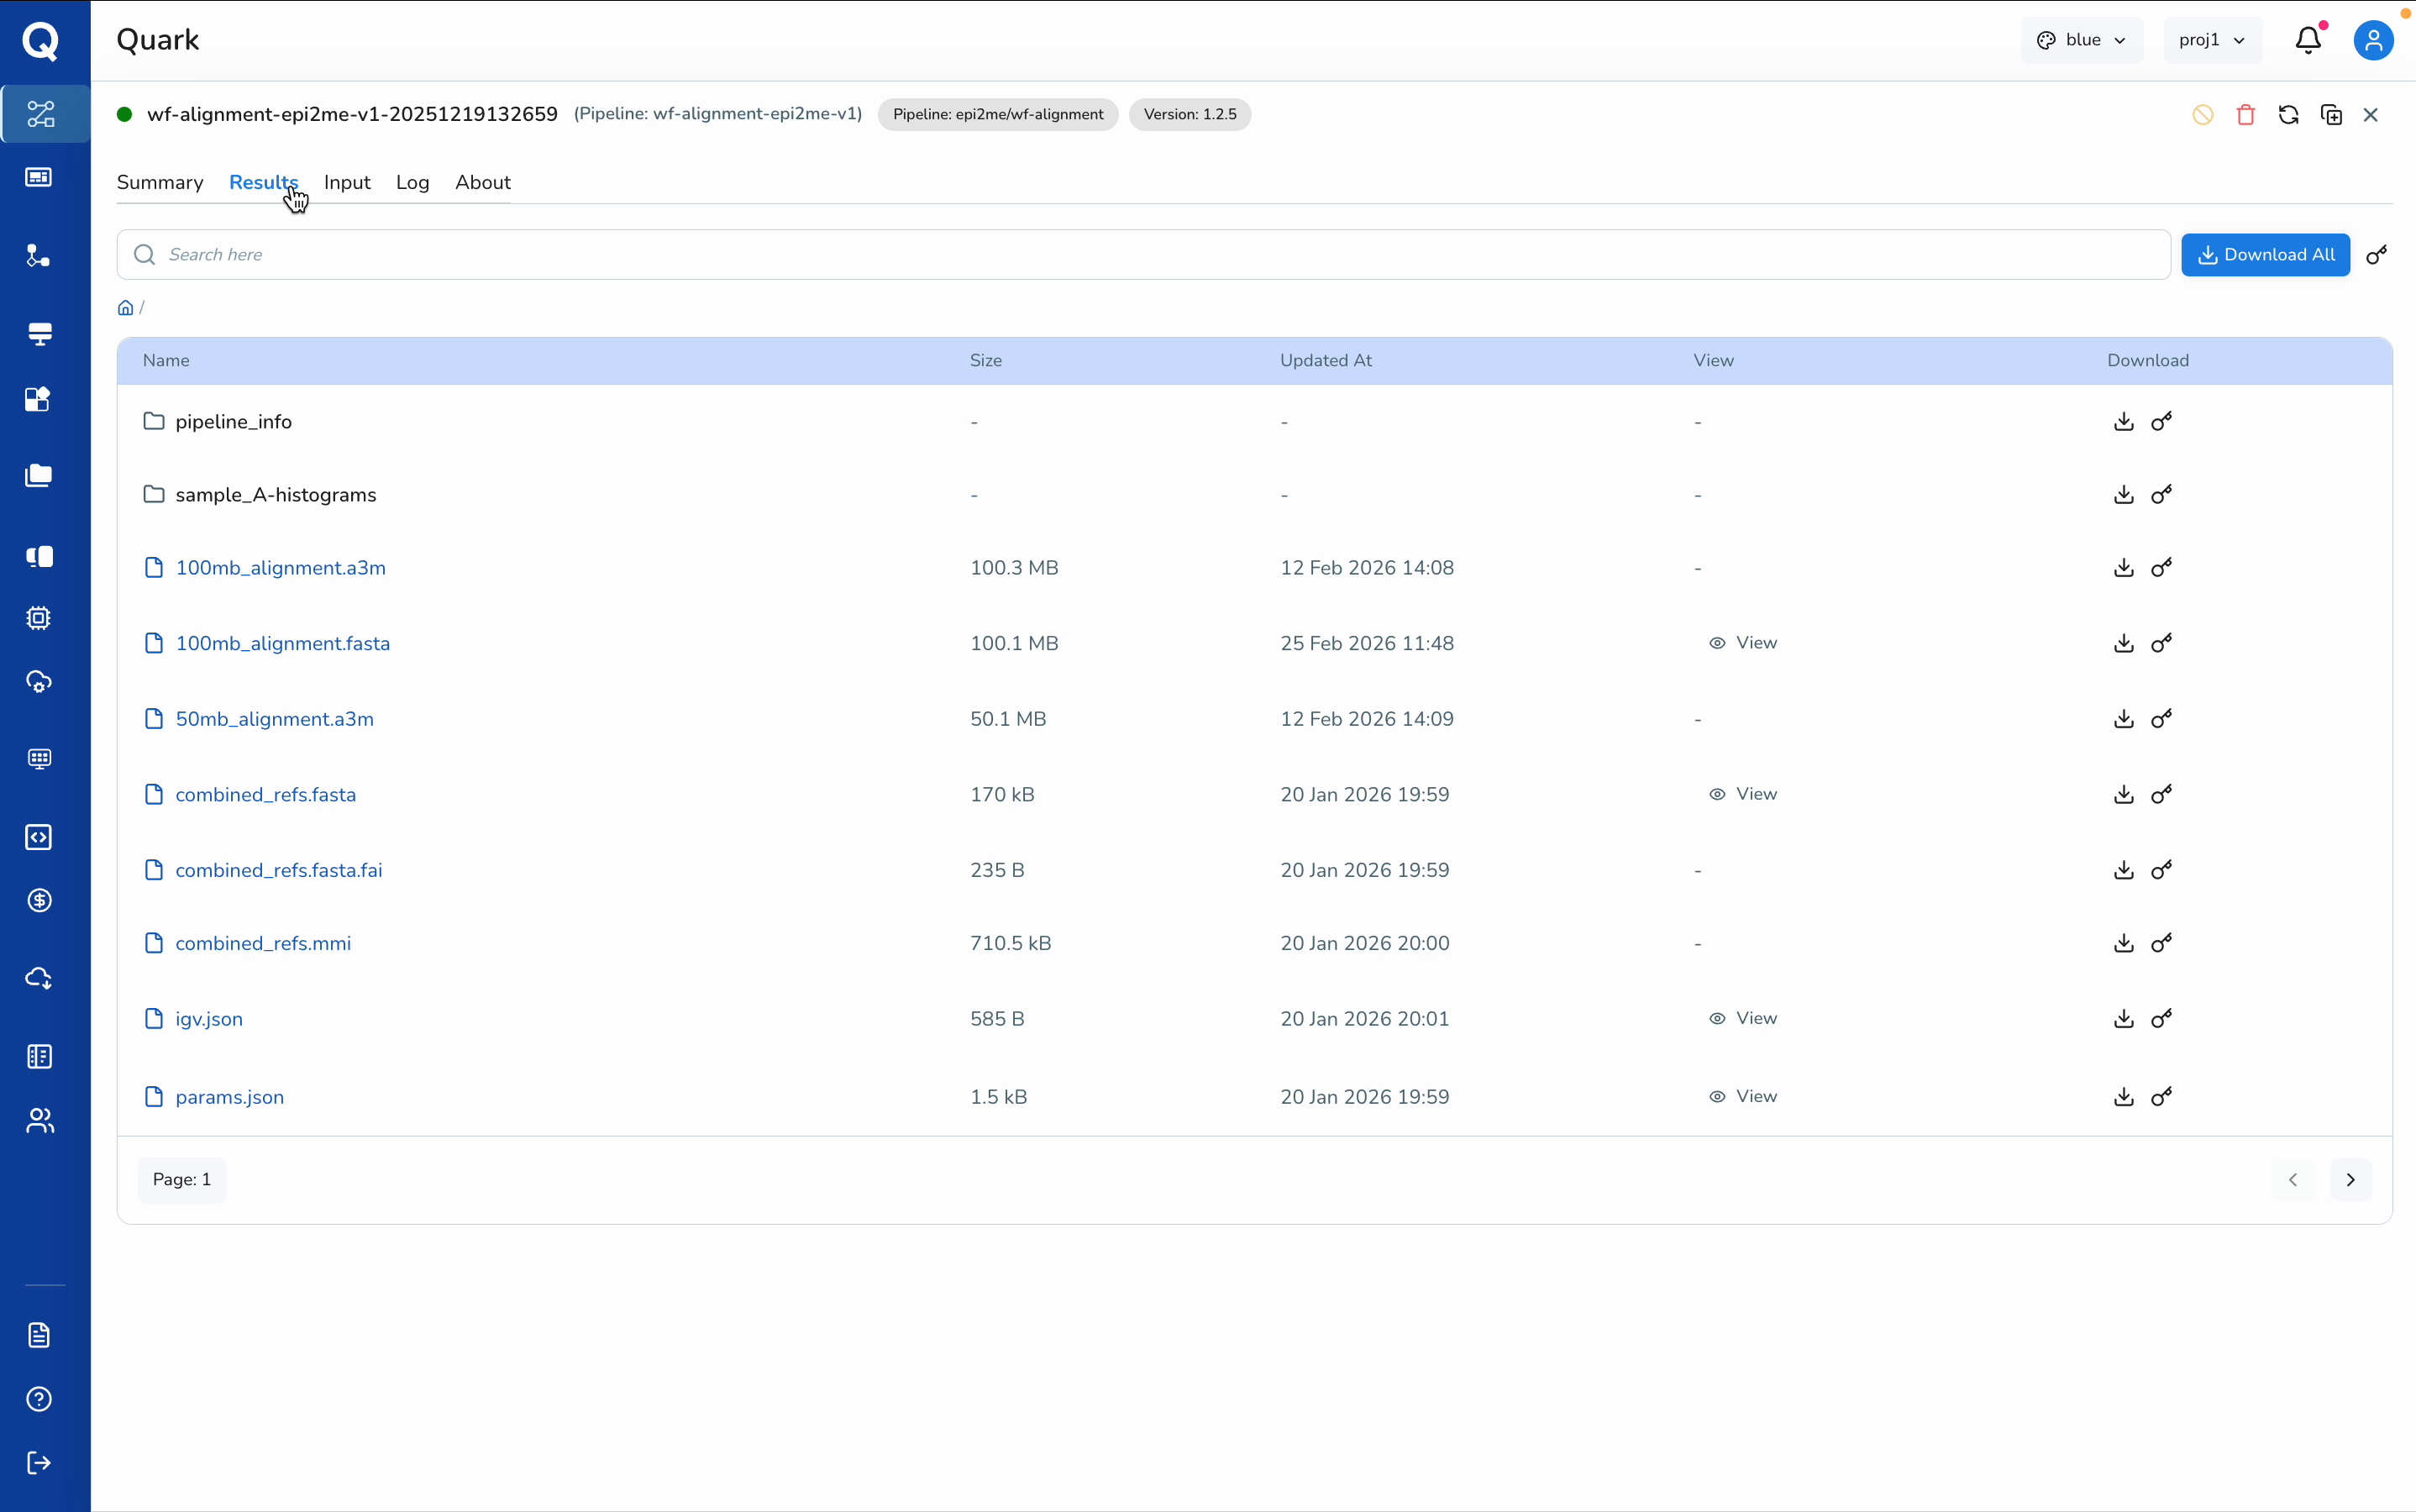
Step 3: Review Run Details, Logs, and Result Files
The Run Details view provides key information about the selected pipeline execution:
- Total runtime and execution timeline
- A brief log summary for the run
- Access to result folders and files
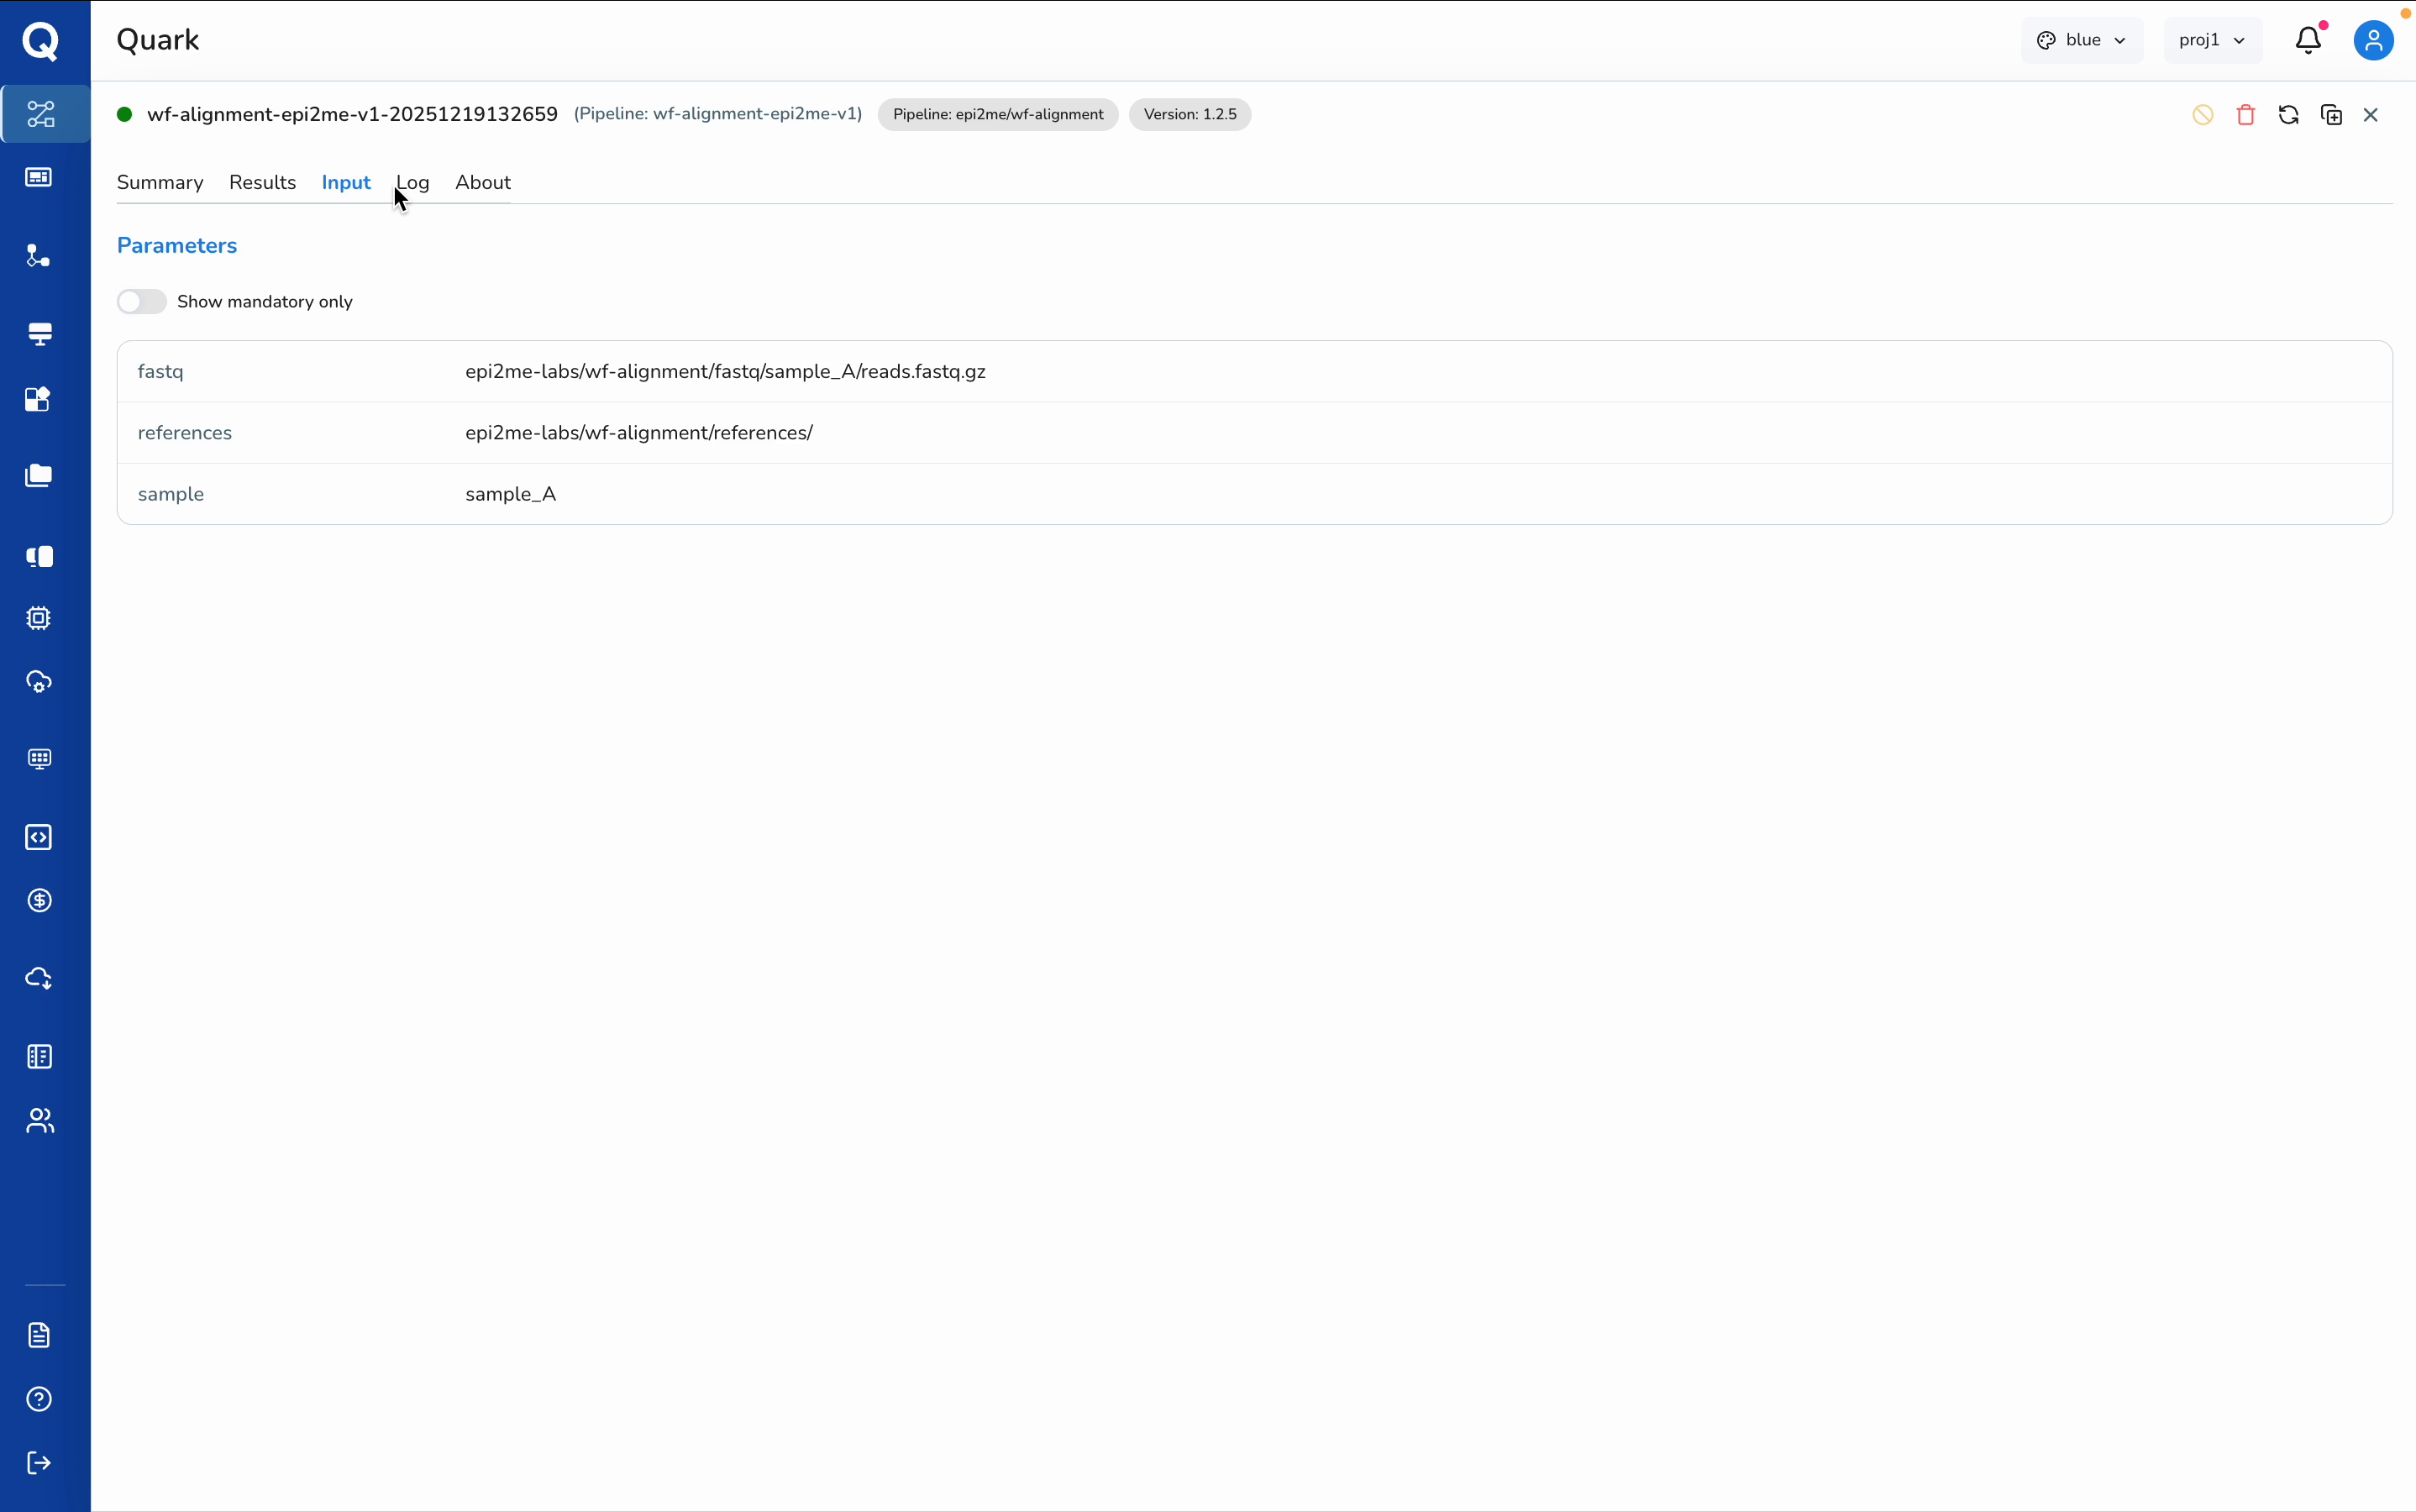
- A record of the inputs used for the run
From this view, open the relevant result folders and verify the inputs used. You can also open log outputs.
Select the appropriate log entry for the analysis you want to review.
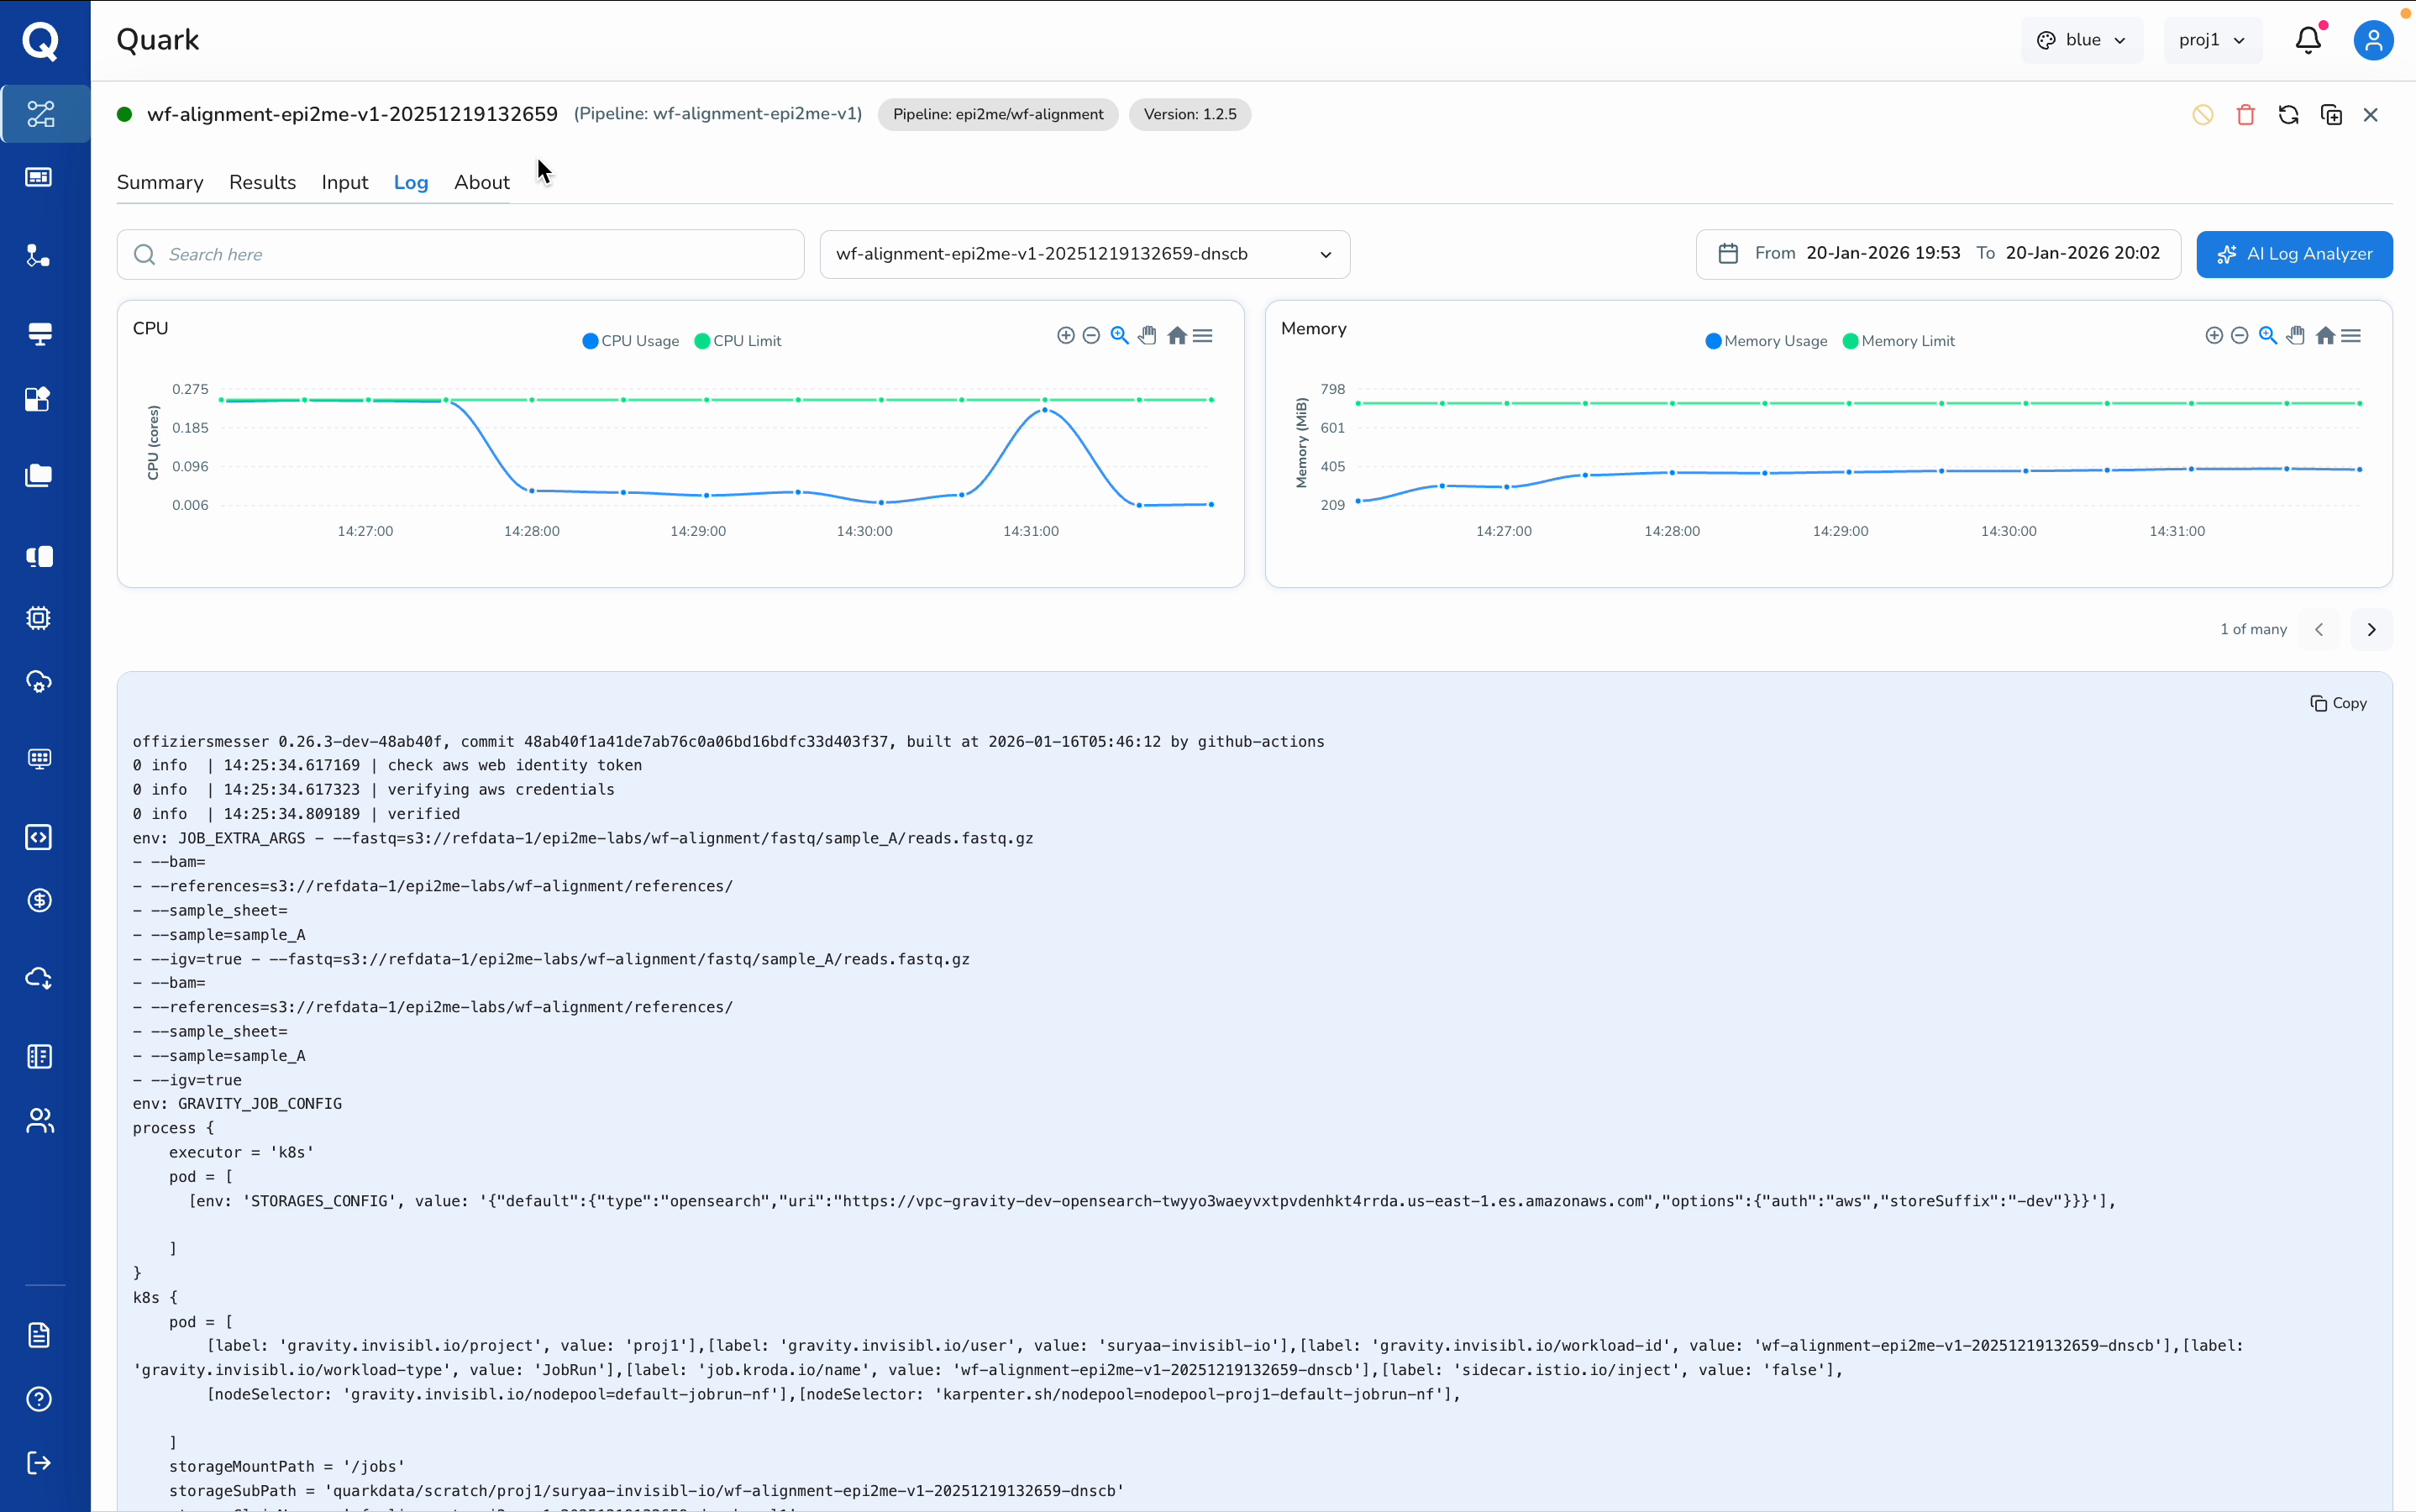
AI Log Analyser: If you need help interpreting the pipeline execution, you can launch the AI Log Analyser directly from this view. It will automatically interpret and summarise the pipeline logs for you.
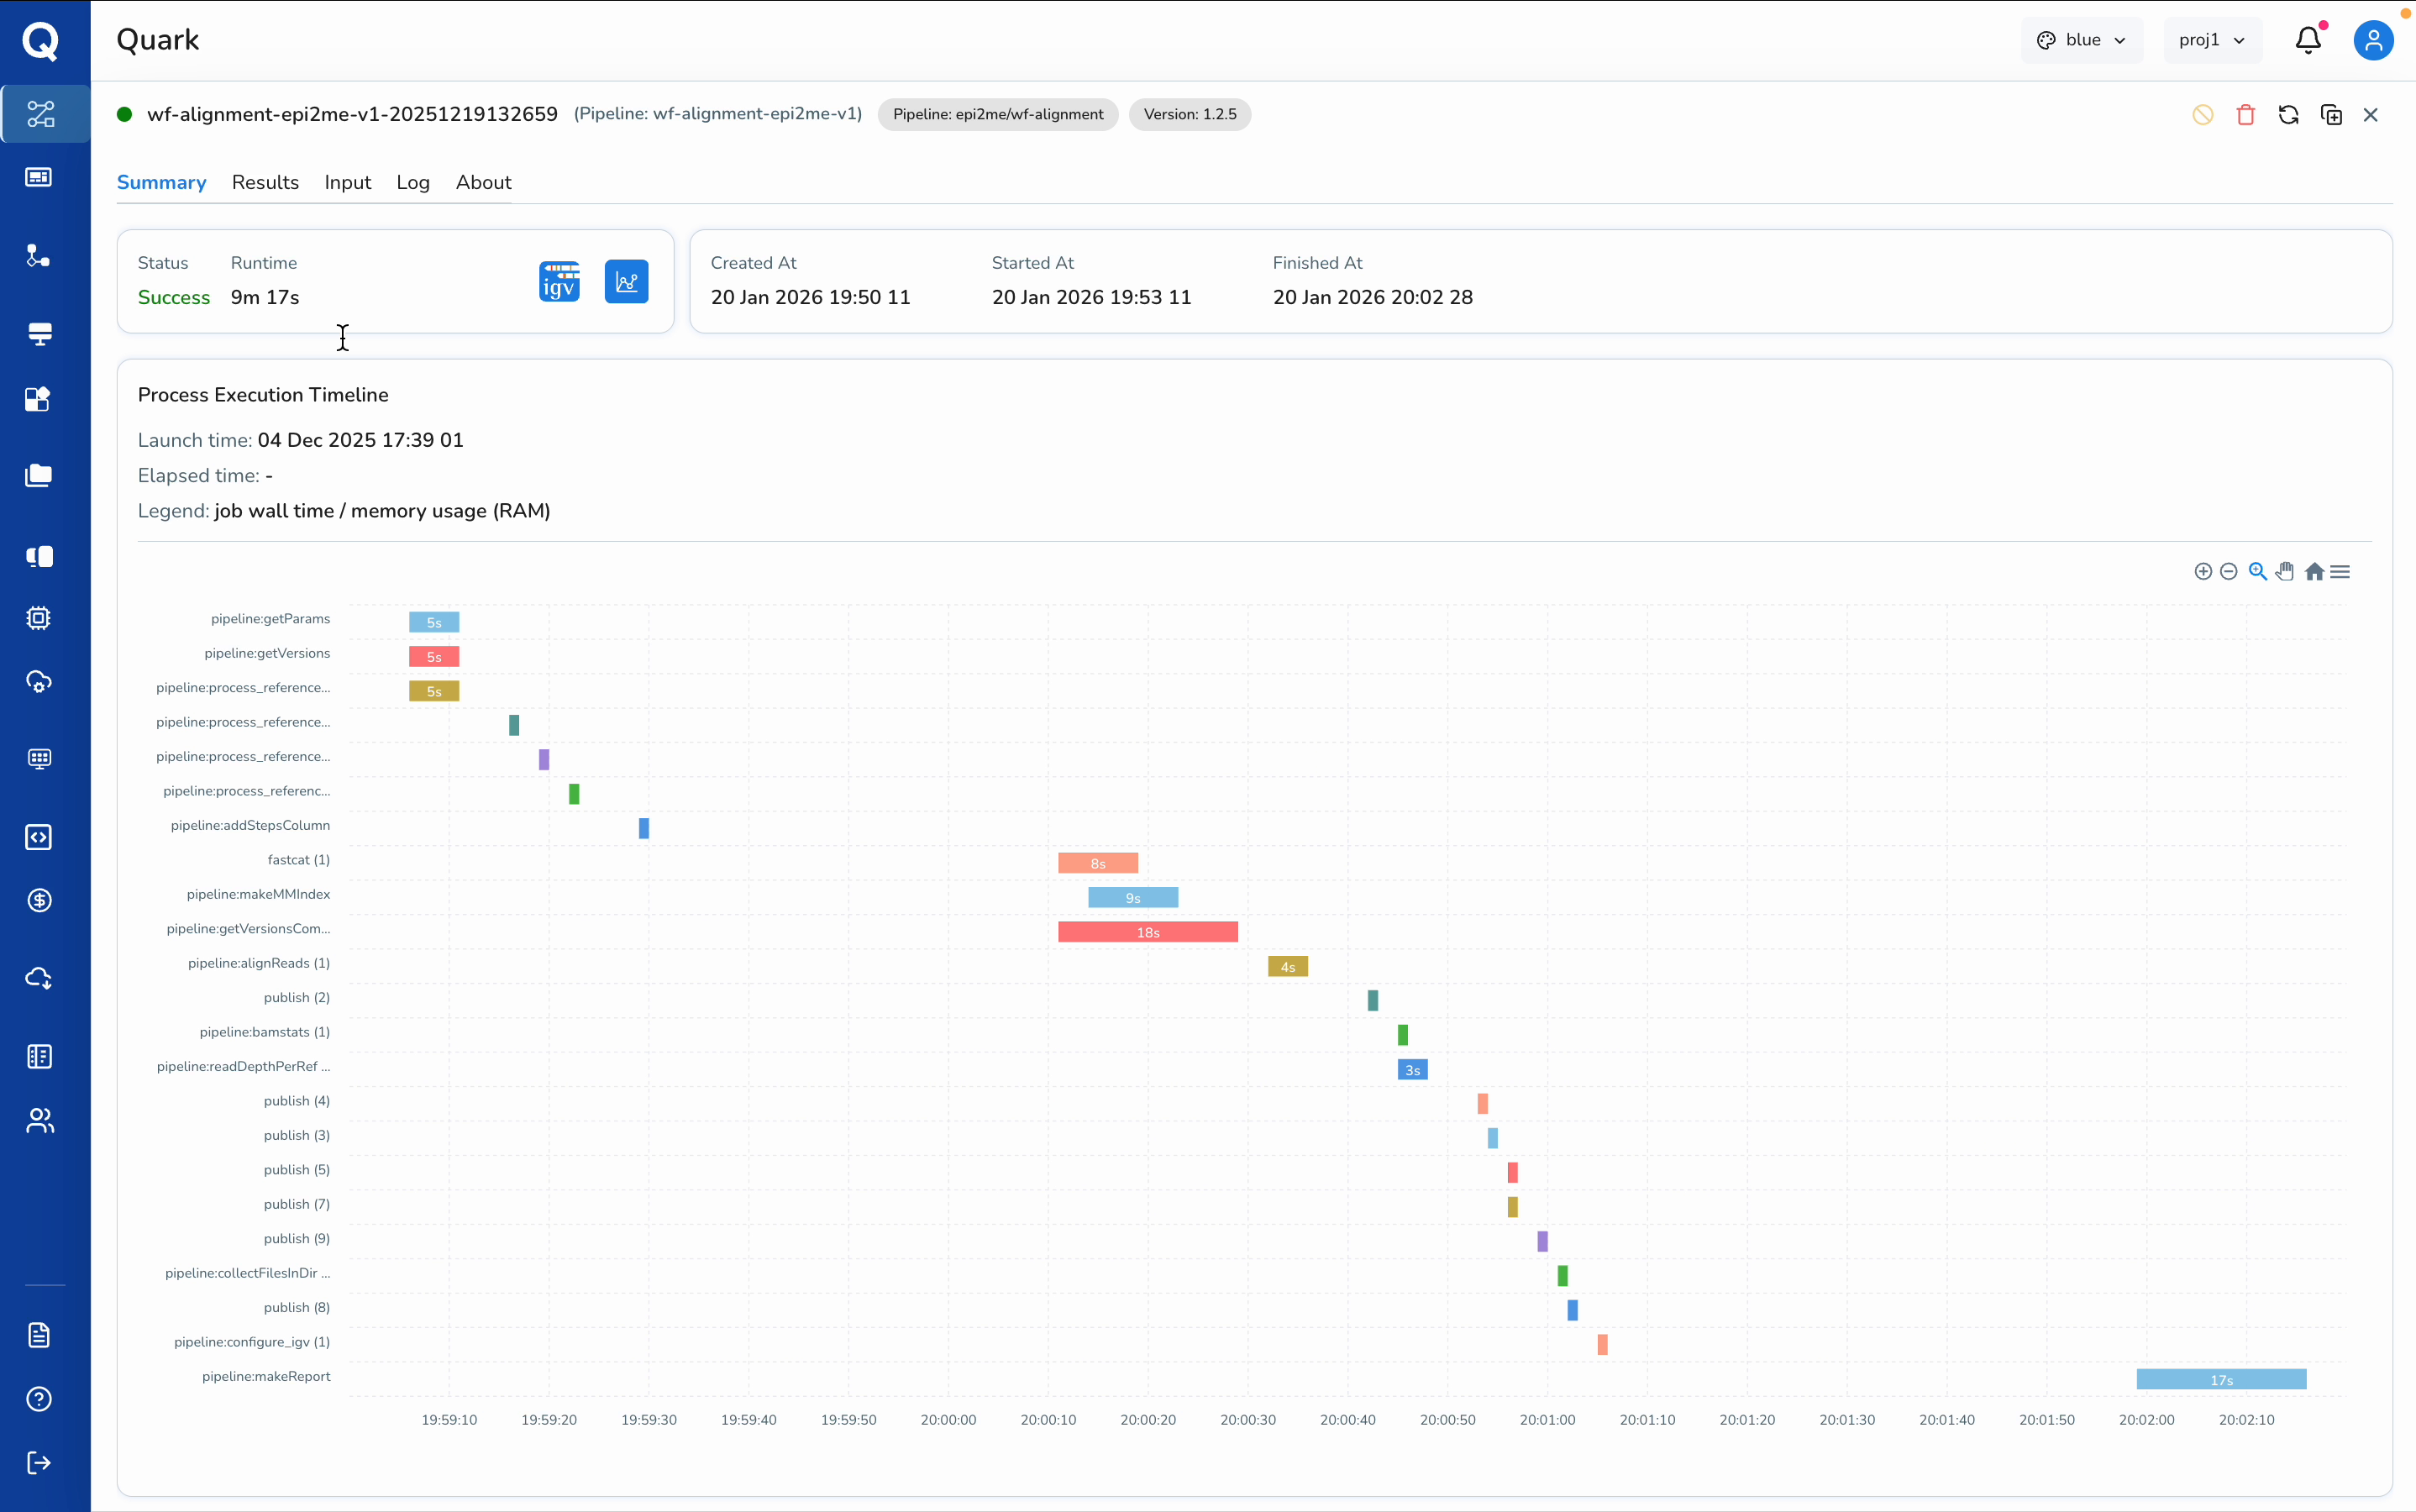
Step 4: Open the Summary Tab and Launch the Visualisation App
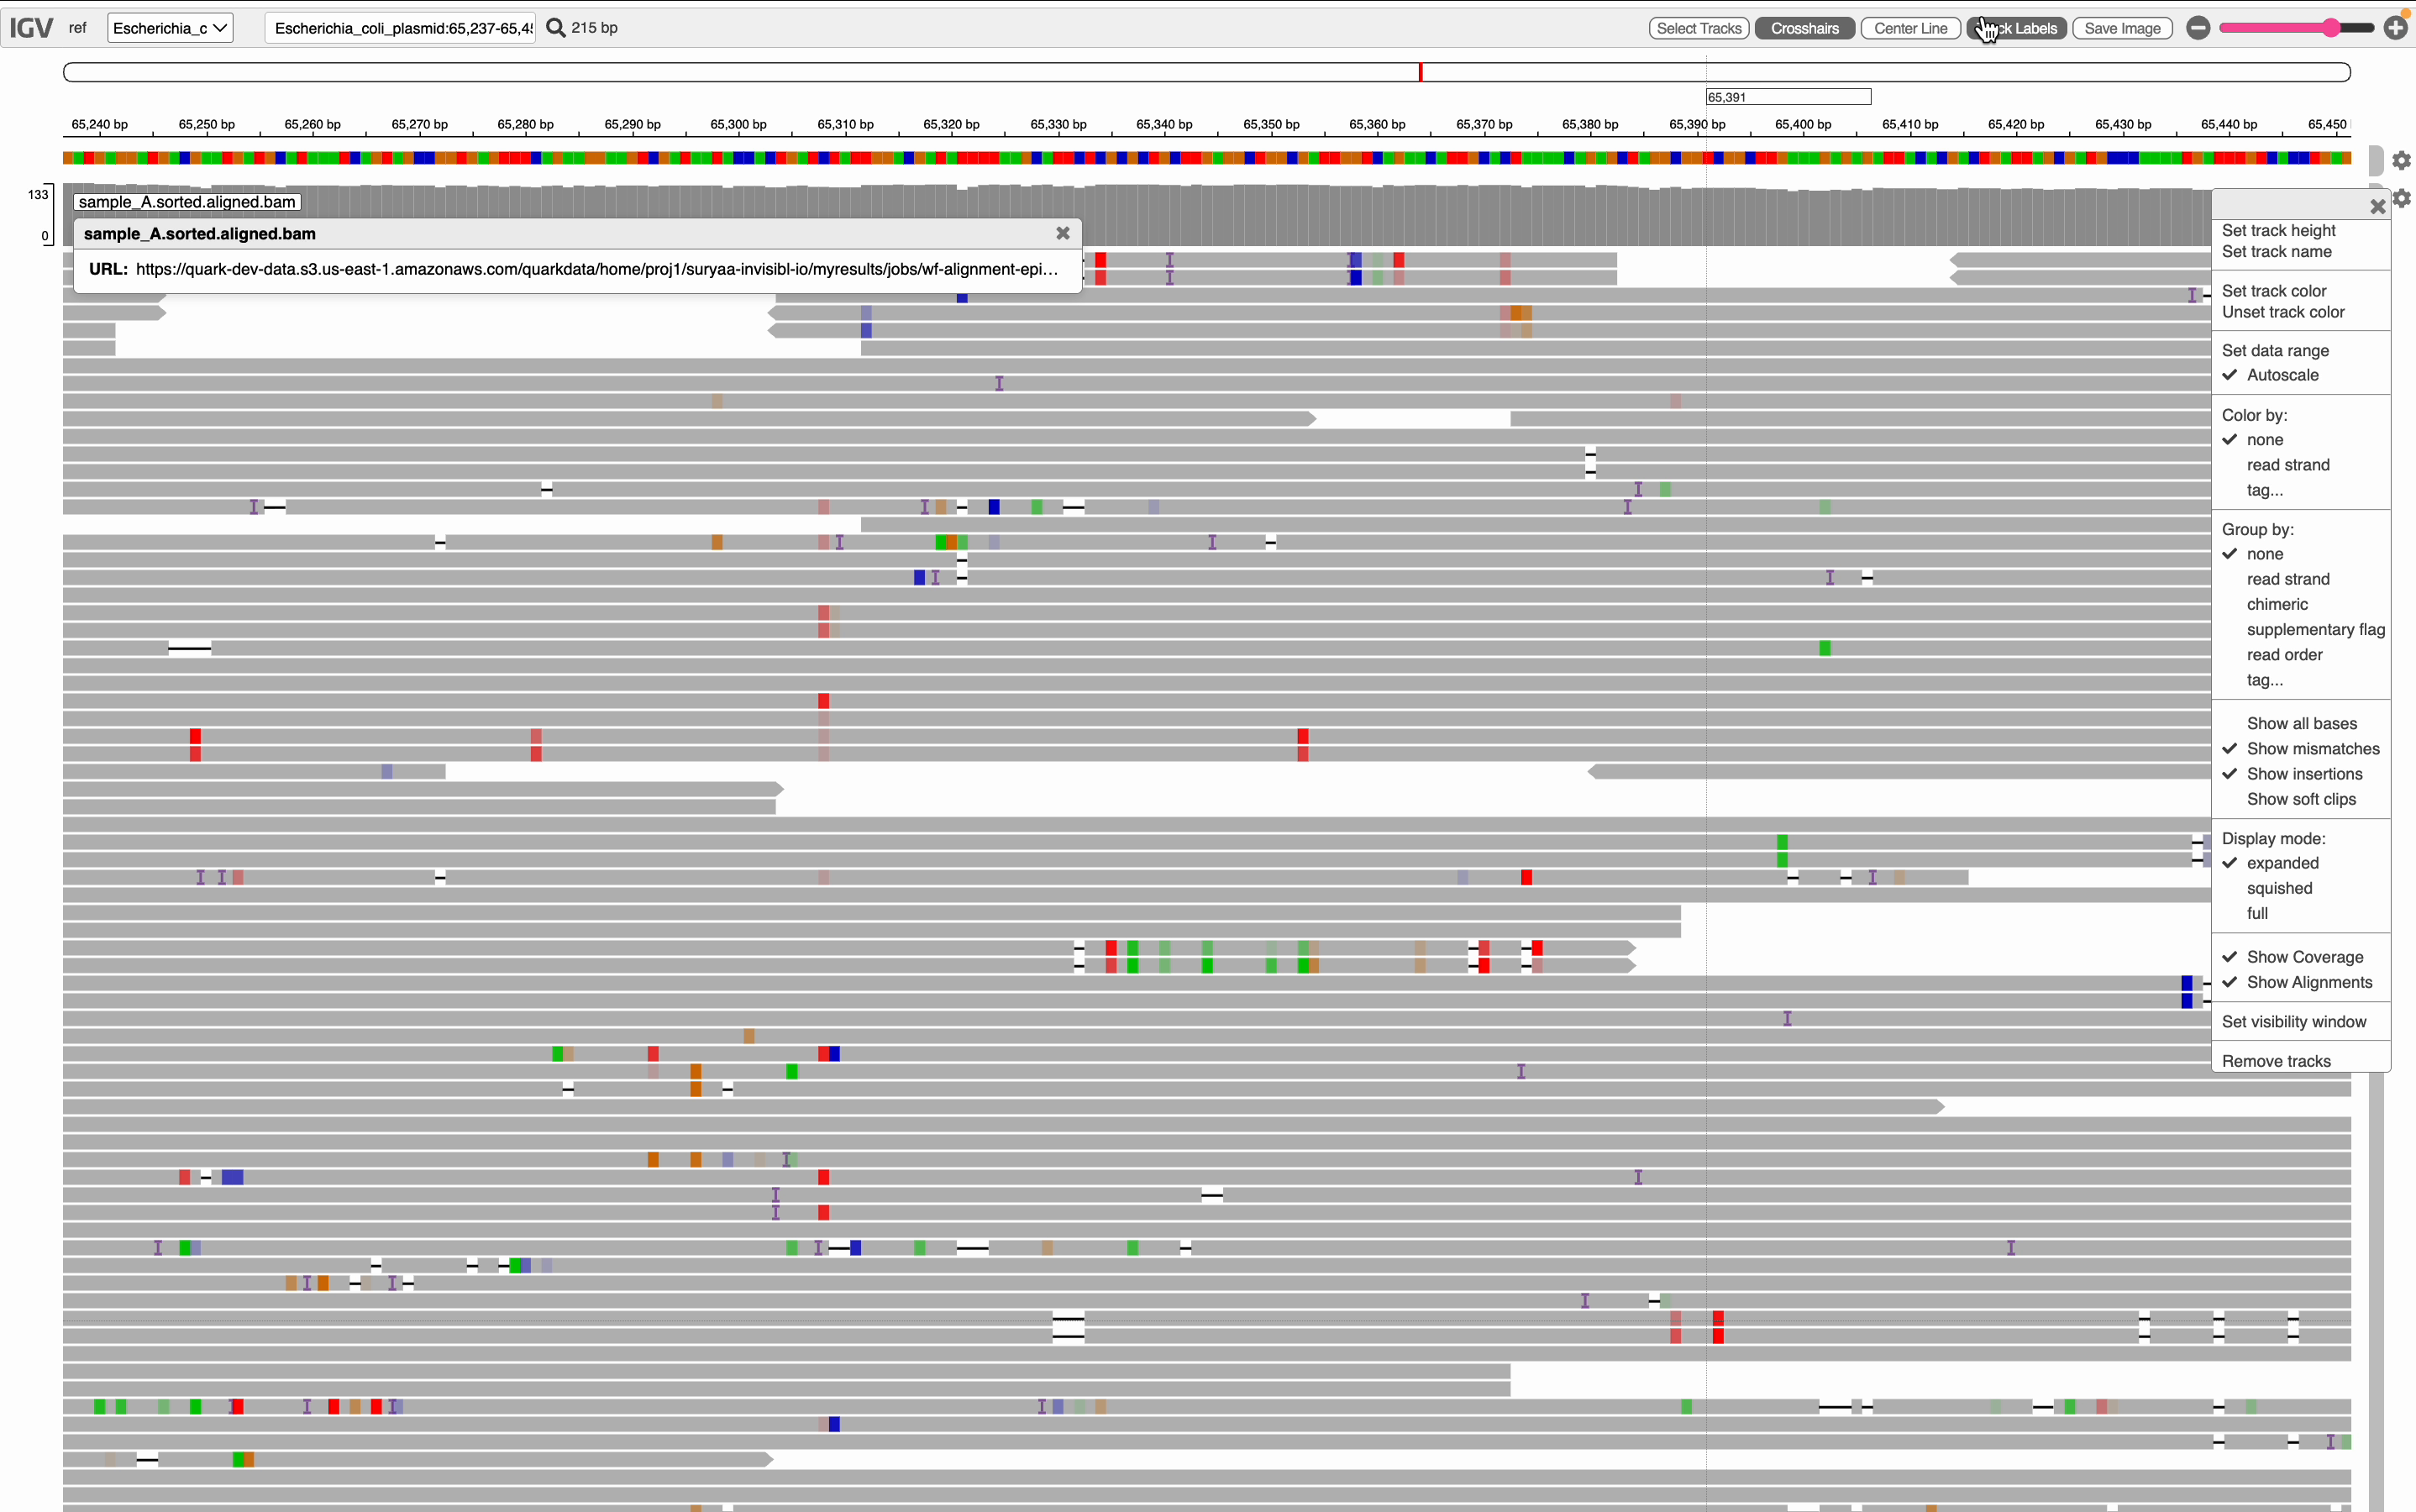
Navigate to the Summary tab within the run details. If your Pipeline Run is configured with a Visualisation App, its icon will appear in the display, next to Runtime.
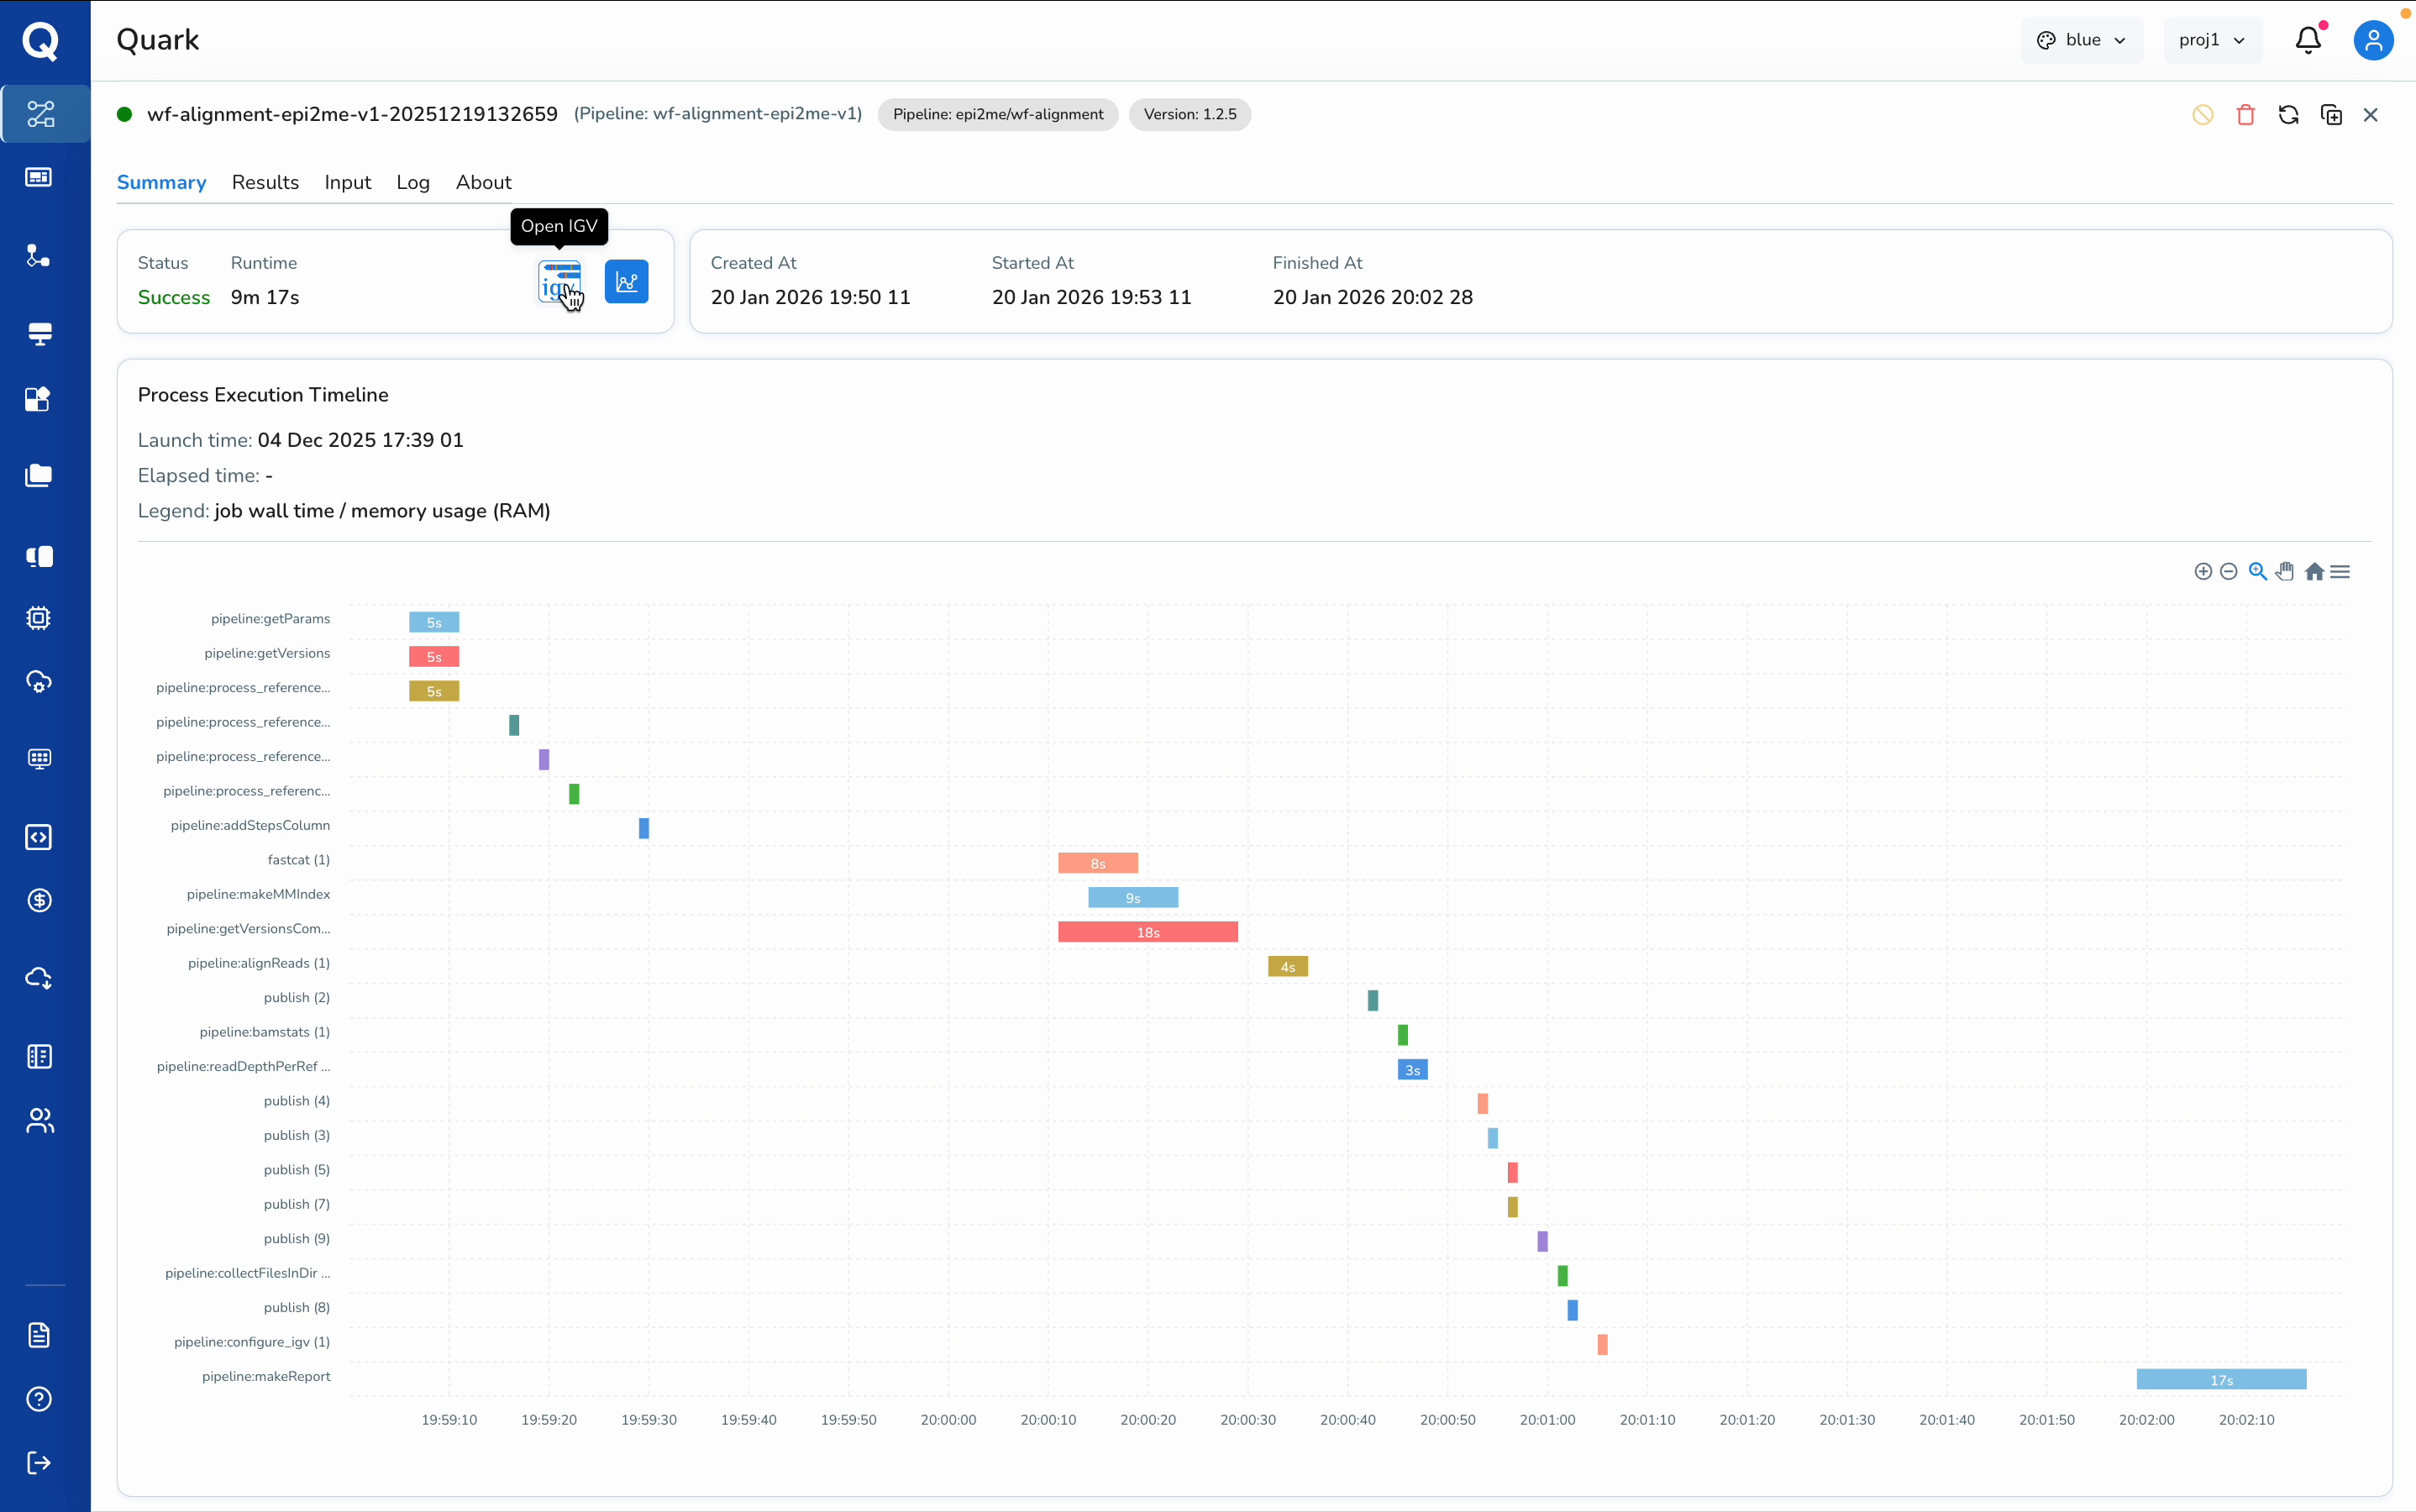
Open the app (e.g. IGV) to launch it. This will take you directly to your results, without having to leave the Quark environment.
Summary
| Step | Action |
|---|---|
| 1 | Open Pipelines → Runs |
| 2 | Search or filter to locate your completed run |
| 3 | Review runtime, logs, and result files in Run Details |
| 4 | Open the Summary tab and launch your visualisation app |
Further Reading
- Managing Files — accessing result files from completed runs
- Apps and Visualisation — configuring and managing visualisation tools